Sample Category Title
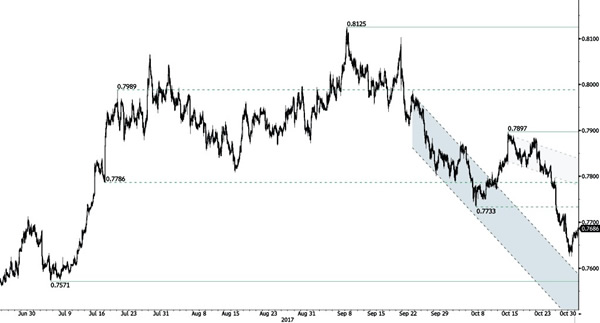
AUD/USD Ready To Monitor Strong Support
AUD/USD is bouncing back but downside pressures are still lively. Hourly resistance is given at 0.7897 (13/10/2017 high). Further. Expected to show continued decline towards key support at 0.7571 (05/07/2017 low).
In the long-term, the trend is turning positive. Key supports stands at 0.6009 (31/10/2008 low) . A break of the key resistance at 0.8164 (14/05/2015 high) is needed to invalidate our long-term bearish view.
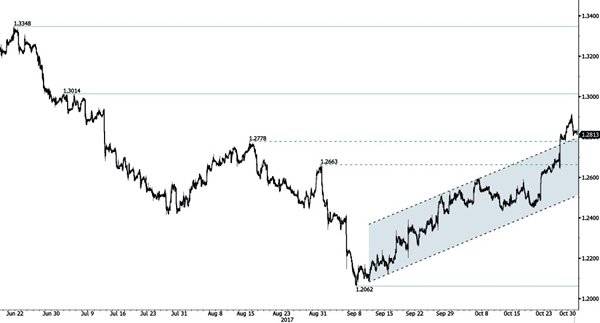
USD/CAD Pausing Within Strong Bullish Momentum
USD/CAD has broken resistance at 1.2778 (15/08/2017 high). This suggests an extension of bullish momentum. Hourly support lies at 1.2331 (26/09/2017 high). Expected to show continued short-term bullish pressures.
In the longer term, the pair has broken longterm support that can be found at 1.2461 (16/03/2015 low). Strong resistance is given at 1.4690 (22/01/2016 high). The pair is likely to head further lower.
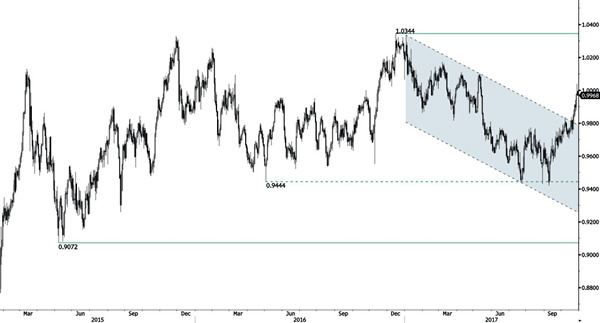
USD/CHF Continued Surge
USD/CHF is clearly in a strong bullish momentum. The technical structure suggests an improving short-term buying interest. Expected to show continued bullish pressures within uptrend channel. Hourly support stands at 0.9712 (12/10/2017 low).
In the long-term, the pair is still trading in range since 2011 despite some turmoil when the SNB unpegged the CHF. Key support can be found 0.8986 (30/01/2015 low). The technical structure favours nonetheless a long term bullish bias since the unpeg in January 2015.
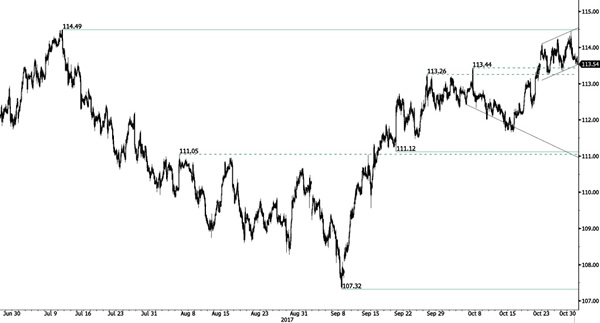
USD/JPY Ready To Bounce Back
USD/JPY is riding higher within short-term uptrend channel. Key resistance stands at 114.49 (11/07/2017 high). Support is located at 111.12 (20/09/2017 low).
We favor a long-term bearish bias. Support is now given at 99.02 (10/08/2013 low). A gradual rise towards the major resistance at 125.86 (05/06/2015 high) seems unlikely. Expected to decline further support at 93.79 (13/06/2013 low).
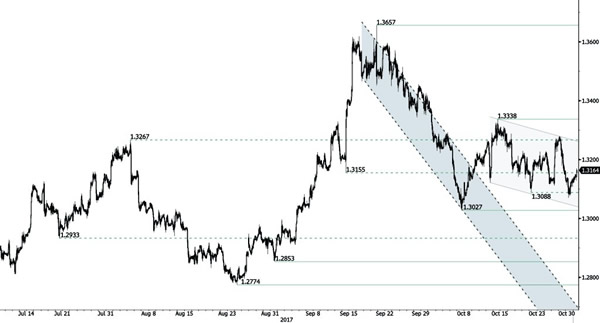
GBP/USD Ready For Another Leg Lower
GBP/USD has successfully broken support at 1.3088 (12/10/2017 low) before bouncing back. Resistance lies at (1.3229 reaction high). Expected to show further weakness towards support at 1.3027 (06/10/2017 low).
The long-term technical pattern is reversing. The Brexit vote had paved the way for further decline. Long-term support can be found at 1.1841 (07/10/2017 low). Long-term resistance given around 1.35 is at stake and indicates a long-term reversal in the negative trend. Yet, it is very unlikely at the moment.
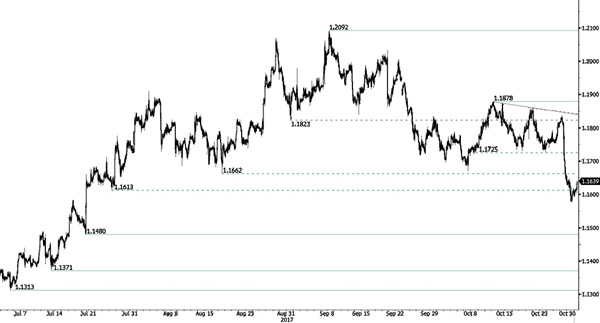
EUR/USD Bullish Consolidation
EUR/USD has broken strong support given at a distance at 1.1613 (26/07/2017 low) before bouncing back higher. Key resistance is located at 1.1878 (12/10/2017 high). Expected to show some short-term consolidation.
In the longer term, the momentum is now turning largely positive. We favour a continued bullish bias. Key resistance is holding at 1.2252 (25/12/2014 high) while strong support lies at 1.0341 (03/01/2017 low).
Gold Remains Under Pressure, Maintains Short-Term Bearish Bias
Gold remains under pressure and risk is still to the downside as prices continue to drift lower from the 1300 psychological level. The short-term technicals are bearish and point to more weakness in the market.
Looking at the 4-hour chart, gold prices are looking capped by the 20 and 50-period moving averages which are negatively aligned after a bearish crossover that took place on October 19.
The next target is the October 6 low at 1260.59. At this stage the market would likely see a resumption of the downtrend from the 1357.47 peak and put in place a lower high at 1306.05.
Upside moves are likely to find resistance at 1283.04. This is the 23.36% Fibonacci retracement level of the downleg from 1357.47 to 1260.59. There is an important resistance zone between 1296.77 and 1308.04 (38.2 and 50% Fibonacci levels). Rising above this area would help shift the focus to the upside towards 1335.25. Breaking this level could see a re-test of the 1357.47 high and turn the bias to bullish.
In the short-term, the bearish phase remains in play especially if gold prices continue to trade below the 50% Fibonacci and under the key 1300 level. In the bigger picture, the market is neutral to bearish as long as the 1260.59 level holds.
Mueller, Fed And NFP To Guide U.S Dollar This Week
Monday October 30: Five things the markets are talking about
This is a busy week on many fronts; there are geopolitical risks in Spain (Catalonia) and the U.S, a plethora of central bank meetings and a busy season of corporate earnings along with U.S data that will keep capital markets on its toes.
The Fed (Wed. Nov. 1), the Bank of Japan (Mon. Oct 30) and Bank of England (Thu. Nov. 2) will announce their respective monetary policy decisions this week. No change is expected from the Fed or BoJ; however, Governor Carney and team are expected to hike interest rates by +25 bps to +0.5%.
Elsewhere, updates on employment in the U.S and Canada along with initial estimates of Q3 GDP in the eurozone will be announced. There are a number October manufacturing PMI's to be released from Asia, Europe and the U.S.
Corporate earning reports this week from some of the world's largest companies may show if there's enough optimism in the earnings season to push global equities to new heights.
Speculation continues around who U.S President Donald Trump will choose as the next Fed chair, with Governor Jerome Powell said to be the front-runner.
Note: Trump is expected to announce his choice ahead of his Asia trip this Friday
And today in Washington it's rumoured that special counsel Robert Mueller's probe into Russian meddling in the 2016 U.S election and possible collusion with Trump's election campaign could see an 'arrest.'
1. Stocks mixed results
Japan's Nikkei share average made little headway in choppy trade overnight, with gains in suppliers to Apple offset by selling in financials and caution ahead of Tier I central bank meetings this week. The Nikkei ended flat, after hitting a fresh 21-year intraday high, while the broader Topix was also little changed.
Down-under, Australia's S&P/ASX 200 Index rose +0.3%, while South Korea's Kospi index gained +0.2%.
In Hong Kong, shares fell overnight, opposing the trend in Asia markets, with sentiment hurt by a slump in mainland stocks that was triggered by liquidity concerns. The Hang Seng index fell -0.4%, while the China Enterprises Index lost -0.7%.
Note: Increasing cross-border flows have made Hong Kong more vulnerable to swings in China markets.
In China, Shanghai stocks posted their biggest one-day slide in nearly three-months, hurt by expectations of a new wave of initial public offerings (IPO's) and a further rise in bond yields, signalling tighter liquidity. The Shanghai Composite Index dropped -0.8%, while the blue-chip CSI300 index fell -0.3%.
Note: Overnight, China's 10-year yield climbed +6 bps to +3.90%, touching the highest print since 2014.
In Europe, regional indexes are trading mixed with notable out performance from the Spanish Ibex, which trades over +1% higher while the Swiss SMI and FTSE 100 trade slightly weaker.
In the U.S, stocks are set to open in the 'red' (-0.2%).
Indices: Stoxx600 flat at 393.4, FTSE -0.1% at 7498, DAX +0.1% at 13229, CAC-40 +0.1% at 5495, IBEX-35 +1.4% at 10339, FTSE MIB +0.3% at 22739, SMI -0.3% at 9158, S&P 500 Futures -0.2%
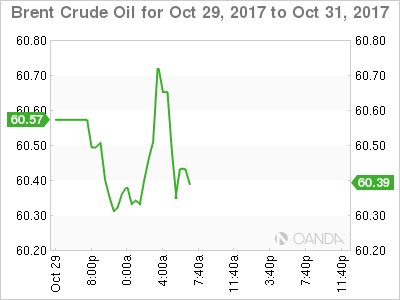
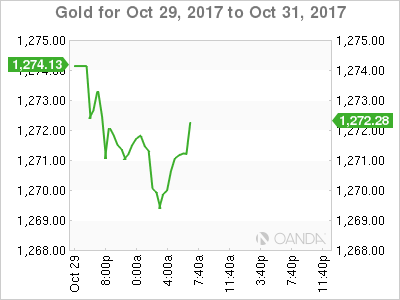
2. Oil prices rise on expected extension of output cuts, gold lower
Oil prices start the week better bid, with Brent crude prices remaining above the psychological +$60 per barrel on expectations that an OPEC-led production cut due to expire next March would be extended, although rising exports from Iraq continues to cap most price gains.
Brent crude futures are trading at +$60.73 per barrel, +29c or +0.48% above Friday's close and atop of their highest level in two-years.
Note: Brent has rallied more than +36% since June's 2017 lows.
U.S West Texas Intermediate (WTI) crude futures are up +16c, or +0.3% at +$54.06 a barrel.
OPEC plus Russia and nine other non-OPEC producers have agreed to hold back about -1.8m bpd to get rid of a supply glut. The pact runs to March 2018, but Saudi Arabia and Russia have both voiced their support to extend the agreement.
Note: OPEC is scheduled to meet officially at its headquarters in Vienna, Austria, on Nov. 30.
Capping price gains is the +900k bpd export capacity increase from Iraq's southern ports to +4.6m bpd, reported on the weekend.
Gold prices start the week under pressure, as the market remains cautious ahead of Tier I central banks policy meetings, while keeping an eye on the appointment of the next U.S Fed chair. Ahead of the U.S open, spot gold has dipped -0.3% to +$1,269.23 per ounce.
3. Sovereign yields fall on flight to safety
By extending its QE program last week, the ECB is prolonging the 'hunt for yield' theme in bond markets.
Bond yields have fallen to record low levels in the past few years on the back of the ECB's generous monetary stimulus, greatly reducing the borrowing costs of many eurozone members.
Also providing pressure is uncertainty in Catalonia, which is boosting 'flight-to-safety' flows into German Bunds. Yields on the 10-year German Bunds trade at +0.383%, down from +0.48% before last week's ECB meeting.
Note: The Spanish central government has taken control of the region and there are signs 'anti-separatists' maybe gaining momentum.
Elsewhere, the yield on 10-year U.S Treasuries decreased less than -1 bps to +2.40%, while in the U.K 10-year Gilt yield increased +1 bps to +1.348%.
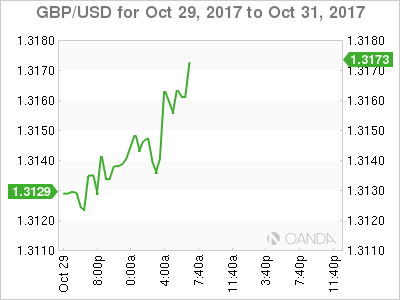
4. Pound gains as BoE is expected to raise rates
Sterling (£1.3162) starts the week firmer ahead of a Bank of England (BoE) policy meeting on Thursday (Nov. 2 08:00am EDT), where it is widely expected to raise interest rates by +25 bps to +0.5%. EUR/GBP is down -0.1% to €0.8838.
Events in Catalonia are trying to put pressure on an otherwise strong EUR (€1.1637), but the single unit has started the week steady. In response to the Catalan parliament's declaration of independence last week, Madrid has triggered article 155 – stripping the region from its autonomy- and called for snap regional elections on Dec. 21.
Note: The Spanish government are hoping that the new elections would return an administration that is less 'pro-independence.' However, uncertainty remains high given 'pro' and 'anti' -independence parties are roughly neck-and-neck in the polls.
The 'mighty' U.S dollar is expected to be driven by Wednesday's Fed meeting, which should not alter market expectations of a December interest rate increase, and by Friday's non-farm payrolls, which is expected to come in strong (+311k expected headline print).
5. U.K consumer credit slowed in September
Data this morning showed growth in U.K. unsecured borrowing slowed in September, but remained above the six-month average, as U.K consumers continued to rely on cheap credit to fund their spending amid accelerating inflation.
New consumer credit stood at £1.6B, down from the £1.8B seen in August, but still the streets expectations.
The Bank of England has previously said that speedy growth in consumer credit represents 'a pocket of risk' in an otherwise benign borrowing environment.
Note: The U.K economy accelerated in Q3, according to a preliminary estimate, and inflation hit a five-year high in September.
Market Update – European Session: German Oct State CPI Data Shows Softening In Trend
Notes/Observations
Central Bank decisions in focus (BOJ on Tues, Fed on Wed, BOE on Thurs) with focus on normalization of policy
German State CPI readings seen below consensus for the Overall German data; affirmed ECB stance that interest rates were seen at present level well past the end of QE program
Iceland heads to coalition talks to form govt after vote; populists gain
Next Fed Chair remain the most important factors in assessing Fed policy outlook; Trump decision likely this week and seems to be leaning toward Powell at this point
Overnight
Asia:
BOJ Gov Kuroda likely to stay for another 5 year term after his current term ends on April 2018. Govt will proposed list of possible candidates for Gov and Dep Govs in January
Europe:
ECB's Coeure (France): Hopeful that have seen the last extension of QE bond buying program. QE program would run until inflation clearly moved towards the 2% target
ECB's Smets (Belgium): Permanently low inflation would be dangerous if people had grown accustomed to a weaker price trend
SNB Vice president Zurbruegg: Reiterates view that country need negative interest and the readiness to intervene in currency markets in order to be able to fulfill our monetary policy mandate
El Mundo Catalan poll: Anti-independence parties winning 43.4% support; Pro-independence parties at 42.5%
Germany 2017 budget surplus could hit €14B. New projection due to solid economic growth and growing tax revenues
German Federal Court of Auditors: Germany will have saved €109B in interest payments on €1.3T debt by 2020 because of ECB's low rate policy
Recent sovereign ratings:
S&P affirmed Germany sovereign rating at AAA; outlook Stable
S&P affirmed United Kingdom sovereign rating at AA; outlook Negative
S&P raised Italy sovereign rating one notch to BBB from BBB-; outlook Stable
Fitch affirmed United Kingdom sovereign rating at AA; outlook Negative
Fitch affirmed Netherlands sovereign rating at AAA, Outlook Stable
Americas:
President Trump reportedly leaning towards naming Powell as Fed chair; decision likely this week (Oct 30th thru Nov 3rd)
First charges said to be filed in Mueller investigation
Economic Data
(NL) Netherlands Oct Producer Confidence: 8.2 v 8.6e
(DE) Germany Sept Retail Sales M/M: 0.5% v 0.5%e; Y/Y: 4.1% v 3.0%e
(NO) Norway Sept Retail Sales W/Auto Fuel M/M: -0.8% v -0.6% prior
(TR) Turkey Oct Economic Confidence: 101.4 v 103.0 prior
04:00 (AT) Austria Sept PPI M/M: No est v 0.2% prior; Y/Y: No est v 1.4% prior
(DE) Germany Oct CPI Saxony M/M: 0.0% v 0.2% prior; Y/Y: 1.8% v 2.0% prior
(ES) Spain Q3 Preliminary GDP Q/Q: 0.8% v 0.8%e; Y/Y: 3.1% v 3.1%e
(ES) Spain Oct Preliminary CPI M/M: 0.9% v 0.8%e; Y/Y: 1.6% v 1.6%e
(ES) Spain Oct Preliminary CPI EU Harmonized M/M: 0.6% v 0.4%e; Y/Y: 1.7% v 1.7%e
(CH) Swiss Oct KOF Leading Indicator: 109.1 v 106.5e
(DE) Germany Oct CPI Bavaria M/M: -0.1% v +0.2% prior; Y/Y: 1.5% v 1.8% prior
(DE) Germany Oct CPI Hesse M/M: -0.2% v +0.3% prior; Y/Y: 1.6% v 2.1% prior
(DE) Germany Oct CPI Baden Wuerttemberg M/M: -0.2% v +0.3% prior; Y/Y: 1.5% v 1.9% prior
(AT) Austria Oct Manufacturing PMI: 59.4 v 59.4 prior
(DE) Germany Oct CPI North Rhine Westphalia M/M: 0.0% v 0.1% prior; Y/Y: 1.6% v 1.9% prior
(UK) Sept Mortgage Approvals: 66.2K v 66.0Ke
(UK) Sept Net Consumer Credit: £1.6B v £1.5Be; Net Lending: £3.8B v £4.0Be
(UK) Sept M4 Money Supply M/M: No est v 0.9% prior Y/Y: No est v 4.4% prior
(PT) Portugal Oct Consumer Confidence: 2.1 v 1.5 prior; Economic Climate Indicator: 2.1 v 2.1 prior
Fixed Income Issuance:
(DK) Denmark sold total DKK1.94B in 1-month and 3-month bills
SPEAKERS/FIXED INCOME/FX/COMMODITIES/ERRATUM
Equities
Indices [Stoxx600 flat at 393.4, FTSE -0.1% at 7498, DAX +0.1% at 13229, CAC-40 +0.1% at 5495, IBEX-35 +1.4% at 10339, FTSE MIB +0.3% at 22739, SMI -0.3% at 9158, S&P 500 Futures -0.2%]
Market Focal Points/Key Themes: European Indicies trade mixed this morning with notable out performance from the Spanish Ibex which trades over 1% higher while the Swiss SMI and FTSE 100 trade slightly weaker. HSBC reported Q3 results which were largely in line with estimates, while AkerBP trades higher after strong results. In the M&A space, Novartis signs an MOU with Advanced Accelerator Applications valued at $3.9B and Akzo Nobel confirmed its in talks with Axalta on merger of Paints and Coatings business. Looking ahead notable earners include Loews, Roper Tech and Cooper Tire & Rubber
Equities
Materials: [Akzo Nobel [AKZA.NL] -0.8% (Confirms merger negotiations of Paints and coatings business with Axalta)]
Financials: [ HSBC [HSBA.UK] -0.9% (Earnings)]
Technology: [Fugro [FUR.NL] -10% (Earnings)]
Healthcare: [Poxel [POXEL.FR] +38% (Strategic partnership), GenNeuro [GNRO.FR] +33% (GeNeuro and Servier Announce Promising post hoc Analyses of Six-Month Data from CHANGE-MS Phase 2b Study )]
Energy: [EDF [EDF.FR] -2.2% (Cuts outlook), AkerBp [AKERBP.NO] +4.0% (Earnings)]
Speakers
South Africa Central Bank' Mminele: SARB is concerned that CPI expectations were still too close to the upper end of range. Negative impact of low confidence on domestic GDP was increasing. Aggressive easing could result in disappointing returns
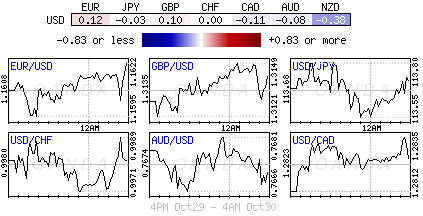
Currencies
Some key central bank rate decision during the week. The Fed is expected to hold steady while keeping the door open for a 3rd hike this year. The BOE is seen raising rates for the 1st time since 2007 at its meeting on Thursday. BOJ is expected to keep its policy steady when it meets on Tuesday.
Next Fed Chair remain the most important factors in assessing Fed policy outlook; Trump decision likely this week and seems to be leaning toward Powell at this point. Analysts noted that if Trump nominated Powell to replace Yellen it would imply continuity in the Federal Reserve's interest rate and the balance sheet policy, at least for a time
EUR/USD pair was steady in the session. The situation is Spain still simmered after the central government took control of the Catalan region on Friday and there were signs anti-separatists was gaining momentum. However, uncertainty could be high given pro and anti-independence parties were roughly neck-and-neck in the polls
GBP/USD higher by 0.2% at 1.3160 as BOE was preparing to begin to normalize monetary policy after nearly a decade of super-loose conditions. However, the central bank tightening to begin under a backdrop of weak growth and heightened uncertainty as the UK heads towards Brexit in March 2019
Fixed Income
Bund futures trade at 162.45 up 5 ticks confirming the post-ECB sentiment shift. Support lies at 161.00, followed by 160.38. Resistance stands initially at 162.75, followed by 163.51.
Gilt futures trade at 124.16 up 6 ticks, with the focus remaining on BOE meeting on Thursday. Continued downside eyeing 123.26. Upside targets 124.90 then 125.24.
Monday's liquidity report showed Friday's excess liquidity rose to €1.828T from €1.810T and use of the marginal lending facility rose to €328M from €253M
Corporate issuance sees primary set to break October issuance record.
Looking Ahead
(BE) Belgium Oct CPI M/M: No est v -0.1% prior; Y/Y: No est v 2.0% prior
(DE) Germany Oct CPI Brandenburg M/M: No est v 0.2% prior; Y/Y: No est v 1.6% prior
(MX) Mexico Sept YTD Budget Balance (MXN): No est v 105.4B prior
(BR) Brazil Oct CNI Consumer Confidence: No est v 98.5 prior
06:00 (EU) Euro Zone Oct Business Climate Indicator: 1.40e v 1.34 prior; Final Consumer Confidence: -1.0e v -1.0 advance
06:00 (BR) Brazil Oct FGV Inflation IGPM M/M: 0.3%e v 0.5% prior; Y/Y: -1.3%e v -1.5% prior
06:00 (EU) Daily Euribor Fixing
06:00 (IT) Italy Debt Agency (Tesoro) to sell €4.0-5.0B in 5-year and 10-year BTP Bonds
06:00 (IT) Italy Debt Agency (Tesoro) to sell €3.0-3.5B in new Apr 2025 CCTeu (Floating Rate bond)
06:00 (ZA) South Africa announces details of upcoming I/L bond sale (held on Fridays)
06:25 (BR) Brazil Central Bank Weekly Economists Survey
06:30 (PT) ECB's Costa (Portugal) in Lisbo
07:00 (IL) Israel Aug Manufacturing Production M/M: No est v -2.2% prior
07:00 (PT) Portugal Sept Industrial Production M/M: No est v 4.7% prior; Y/Y: No est v 10.4% prior
07:00 (PT) Portugal Sept Retail Sales M/M: No est v -1.3% prior; Y/Y: No est v 3.2% prior
07:00 (IL) Israel to sell 2022, 2026, 2027 and 2047 bonds - 07:45 (US) Daily Libor Fixing
08:00 (IN) India announces details of upcoming bond sale (held on Fridays)
08:00 (CL) Chile Sept Total Copper Production: No est v 508.6K tons prior
08:00 (CL) Chile Sept Manufacturing Production Y/Y: -1.5%e v +1.4% prior; Industrial Production Y/Y: 2.0%e v 5.1% prior
08:00 (ZA) South Africa Sept Budget Balance (ZAR): No est v -12.6B prior
08:30 (US) Sept Personal Income: 0.4%e v 0.2% prior; Personal Spending: +0.9%e v -0.1% prior
08:30 (US) Sept PCE Core M/M: 0.1%e v 0.1% prior; Y/Y: 1.3%e v 1.3% prior
08:30 (US) Sept PCE Deflator M/M: 0.4%e v 0.2% prior; Y/Y: 1.6%e v 1.4% prior
08:30 (BR) Brazil Sept Primary Budget Balance (BRL): -23.4Be v -9.5B prior; Nominal Budget Balance: -55.8Be v -45.5B prior
09:00 (DE) Germany Oct Preliminary CPI M/M: 0.1%e v 0.1% prior; Y/Y: 1.7%e v 1.8% prior
09:00 (DE) Germany Oct Preliminary CPI EU Harmonized M/M: 0.1%e v 0.0% prior; Y/Y: 1.7%e v 1.8% prior
09:00 (ES) Spain Debt Agency (Tesoro) announces size of upcoming actions in week
09:05 (UK) Baltic Dry Bulk Index
09:50 (FR) France Debt Agency (AFT) to sell combined €4.3-5.5B in 3-month, 6-month and 12-month Bills
10:00 (BE) Belgium Q3 preliminary GDP Q/Q: No est v 0.4% prior; Y/Y: No est v 1.5% prior
10:30 (US) Oct Dallas Fed Manufacturing Activity: 21.0e v 21.3 prior
10:30 (EE) ECB's Hansson (Estonia) in Tallinn
10:30 (EU) ECB announces Covered-Bond Purchases
10:35 (EU) ECB calls for bids in 7-Day Main Refinancing Tender
11:30 (US) Treasuries to sell 3-Month and 6-Month Bills
16:00 (US) Weekly Crop Progress Report
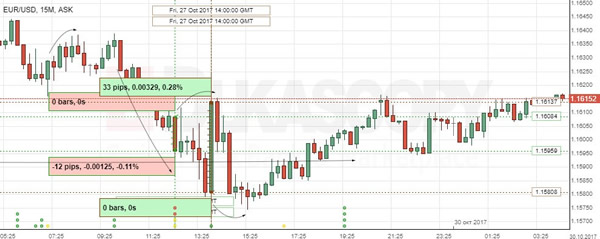
EUR/USD: US Gross Domestic Product
The EUR/USD exchange rate fell slightly on the US GDP data on Friday. The Euro lost 0.11% against the Greenback, though the following report showing the US consumer sentiment caused 33 base points gain, putting the pair back to 1.1613, where it returned again by the session end.
The Commerce Department revealed that the US gross domestic product marked a 3.0% yearly growth pace in the third quarter, fuelled by higher business investment, while consumer spending growth eased slightly as incomes were hurt by hurricanes. Separate report showed that the US consumer sentiment remained at lofty levels over the course of October and was expected to improve further. Meanwhile, economists anticipate the Fed to raise rates one more time in December.