Sample Category Title
EUR/CHF Eases Toward 1.16, Crude Oil Price Breaks Resistance
SNB sits back and relaxes
After hitting 1.1711 against the Swiss franc, its highest level since the SNB removed the 1.20 floor, EUR/CHF started to reverse gains in the wake of last Thursday’s ECB meeting. Mario Draghi scored a pretty good knack during the press conference as he was able to announce a reduction of the monthly asset purchase of €30bn per month, which is clearly tightening, while at the same time sounding dovish. The trick was to claim that this was no taper but rather a small adjustment to take into account the improvement of the economic situation. The icing on the cake was the Draghi’s reminder that the central bank would be ready to reverse course the situation requires.
The last few months have been genuine holidays for the Swiss National Bank as EUR/CHF have kept rising. The total sight deposits at the SNB have stabilized at around CHF578bn since early May. Domestic sight deposits have even eased by 22.3bn since July; however, this decrease was offset by a surge in “other sight deposits”.
We believe that further upside EUR/CHF is quite limited in the short-term as traders are progressively adopting a more bearish bias on the pair. In addition, the Catalan crisis reminded everybody that the European Union is not as united as Brussels says. On the other hand, there is little incentive for investors to bet on a sharp reversal in EUR/CHF as monetary policy divergence is clearly in favour of the single currency. In addition, the SNB is far from lifting borrowing rates. A period stabilization is therefore the most likely scenario.
Crude Oil Prices: World Bank renewed its bullish forecast for 2018
The WTI crude oil price has broken its resistance area around 53$. The commodity is now trading above $54. This increase appears after the World Bank, in its last report, is predicting an increase in price for 2018. The World Bank target is $56 for next year. In this report the institution considers that the increase in demand as well as a decline the production volume will likely add upside pressures on the price.
It is worth noting that the forecast regarding oil prices are lower than the one made in April. Indeed the agreement between OPEC members may not be extended and the end of oversupply is likelier which increase upside risks in crude oil barrel valuation. If the OPEC agreement was abandoned, the impact on oil prices would definitely be significant. The World Bank also underlines risk that shale gas producers may also increase their production at current price levels.
For the time being, OPEC members have committed to their agreement at 120%, certainly in an effort to keep market shares against the US shale gas industry. We nonetheless consider that OPEC margin is getting thinner. Competition on oil prices are fierce and should still be at the advantage of the OPEC for some more time.
XAU/USD Analysis: Goes Up Amid Catalan Crisis
The pair had all means to reach the bottom trend-line of a dominant ascending channel. A release of information about the US GDP growth was projected to give an additional stimulus. However, a declaration of independence by the Catalan parliament and subsequent sack of the regional government by Spanish PM spiked demand for gold. As a result, the new trading session the pair started at the updated weekly PP at 1,274.04. As this barrier is additionally secured by the 55- and 100-hour SMA, the exchange rate is expected to resume movement to the south, trying to reach the weekly S1 at 1,264.23. Fundamental background, generally, supports strengthening of the Dollar. But in the meantime, North Korean and Catalan geopolitical risks might provoke short-term recoveries of the yellow metal.
USD/JPY Analysis: Approaches 113.80
New trading week the currency rate stared in a limbo between the 200-hour SMA from the bottom and a combination of the weekly PP, the 55- and 100-hour SMAs from the top. Such neutral movement reflects anticipation of the Bank of Japan Policy Rate announcement. But since there is high probability that the central bank will left the monetary policy unchanged, the pair is not expected to act unpredictably. Such assumption is partially supported by presence of two extremums, which have already forced the rate to make a rebound more than once. The first is located near the 114.30 mark, while the other at the 113.34 level. A breakout through one of these barriers is likely to follow after the FOMC Statement, which will be delivered on Wednesday.
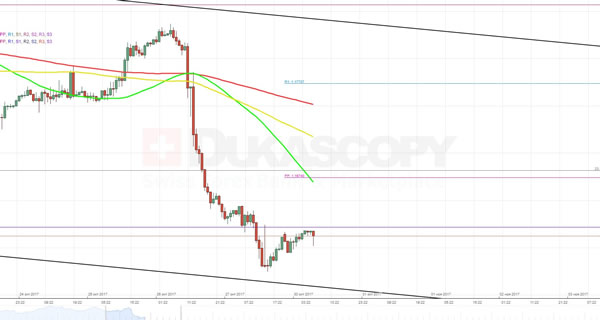
GBP/USD Analysis: Approaches Weekly PP At 1.3160
Friday's trading session was significant for two reasons. On the one hand, the cable managed to break through the lower trend-line of the senior ascending channel. On the other hand, it failed to slip below the 1.3090 mark, which correlates with location of the bottom boundary of an alleged larger, dominant ascending channel.
Such outcome allows assuming that this pattern will be strong enough to block another attempt of the pair to fall below the 1.3100 mark, following the general strengthening of the Dollar. At the same time, rapid recovery of the Pounds seems unlikely as well due to presence of a combined resistance set up by the weekly PP, the 55-, 100- and 200-hour SMAs.
EUR/USD Analysis: Starts New Week Near 1.1614
In result of the previous trading session, the currency exchange rate slipped through the updated 23.6% Fibonacci retracement level at 1.1679 and, in essence, made a rebound from the bottom trend-line of a dominant descending channel. Due to absence of any fundamental data releases, bulls are likely to try to return the rate back to 1.1643, at minimum. However, the further recovery of the Euro seems unlikely because of a combined resistance formed by the monthly S1 at 1.1658, the weekly PP at 1.1674 and the falling 55-hour SMA. The southern side, in contrast, remains barrier-free. In addition to that, there is couple of fundamental factors that incite further appreciation of the Dollar, such as Donald Trump’s tax reform and possible nomination of John Taylor, as the Fed chair.
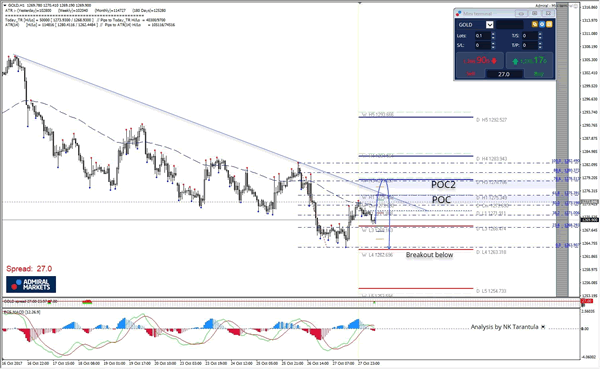
Gold Bearish Zig Zag Confluence At 61.8 And 78.6 Fib
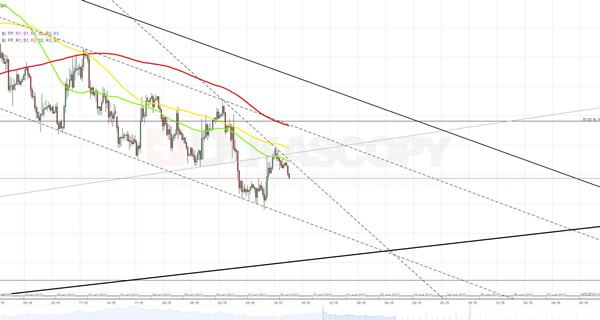
Gold is in a steady downtrend. Better than expected advance GDP in US continues to weight on Gold. My conclusion is that the USD gains and risk appetite continue to limit the upside for Gold. However we might see a retracement from L3 towards POC1 and POC2. The POC1 (D cm, W H1, EMA89, 61.8, trend line, atr pivot) 1273.20-1275.35 could turn the price down to 1268.18 and 1262.69. A deeper retracement might also target POC2 1278.50 zone-1280.00 (D H3, WH3, atr pivot) and the rejection should target same levels as I mentioned above. 1h momentum or 4h candle close below 1262.69 might target 1254.73
W H3 - Weekly Camarilla Pivot (Weekly Interim Resistance)
W H4 - Weekly Camarilla Pivot (Strong Weekly Resistance)
D H4 - Daily Camarilla Pivot (Very Strong Daily Resistance)
D L3 – Daily Camarilla Pivot (Daily Support)
D L4 – Daily H4 Camarilla (Very Strong Daily Support)
POC - Point Of Confluence (The zone where we expect price to react aka entry zone)
Forex Technical Analysis: EUR/USD, USD/JPY, GBP/USD
EUR/USD
Current level - 1.1612
Current rebound after 1.1572 low should be considered corrective, preceding another leg downwards, to 1.1480 zone. Initial resistance lies at 1.1660, followed by the crucial break-out zone at 1.1720.
| Resistance | Support | ||
| intraday | intraweek | intraday | intraweek |
| 1.1660 | 1.1840 | 1.1580 | 1.1480 |
| 1.1720 | 1.1940 | 1.1480 | 1.1300 |
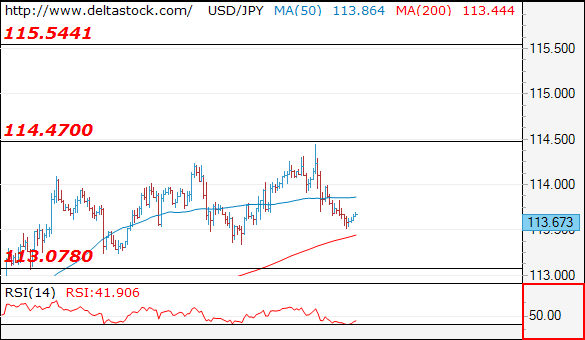
USD/JPY
Current level - 113.67
The intraday outlook is counter-trend, for a reversal and renewal of the general rise towards 115.50 zone. Key support lies at 113.05.
| Resistance | Support | ||
| intraday | intraweek | intraday | intraweek |
| 114.50 | 114.50 | 113.50 | 111.00 |
| 115.50 | 115.50 | 113.05 | 107.30 |
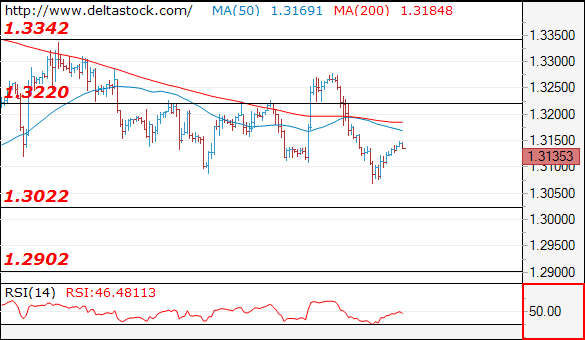
GBP/USD
Current level - 1.3135
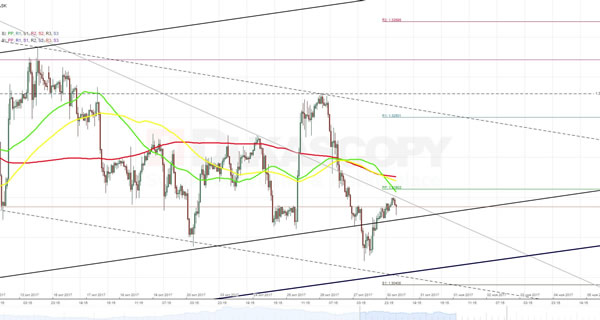
The recent low at 1.3067 signals a completion of the slide from 1.3280, but the rebound is by all means corrective, so 1.3180 is expected to cap the upside, for another leg downwards, to 1.3020, en route to 1.2910 area.
| Resistance | Support | ||
| intraday | intraweek | intraday | intraweek |
| 1.3180 | 1.3340 | 1.3020 | 1.2910 |
| 1.3280 | 1.3650 | 1.3020 | 1.2760 |
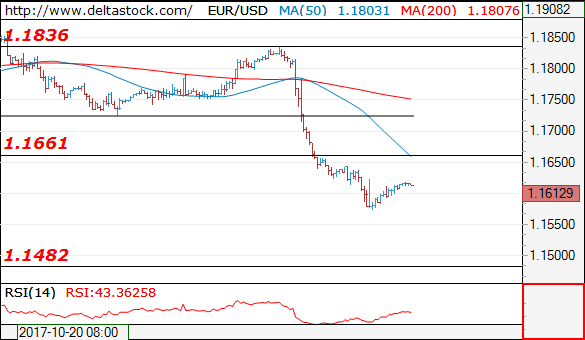
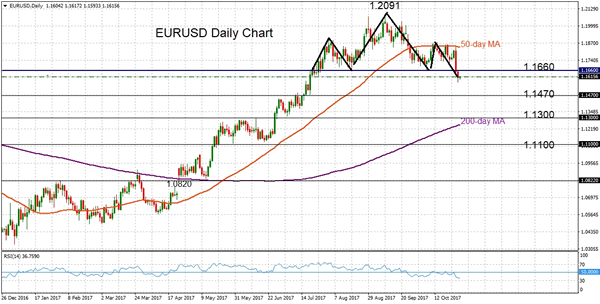
EURUSD Enters Bearish Short-Term Phase After Break Of Key Support Level
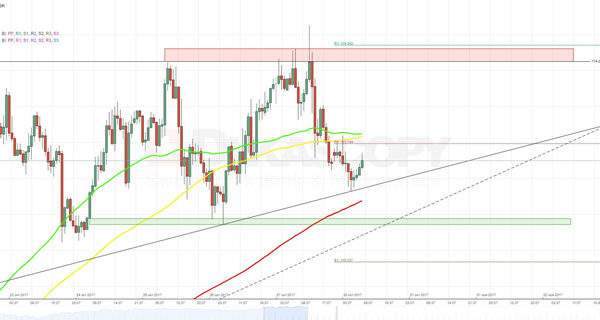
EURUSD has come under increased pressure after dipping another leg lower to break below the head and shoulders neckline at 1.1660. The drop below what was considered to be a key support level with strong downside momentum indicates that the market has moved into a bearish phase and further weakness is expected.
Prices have currently stabilized around 1.1615 and the 1.1470 level is expected to provide solid support. From here, the focus would shift to key levels at 1.1300 and 1.1100 ahead of the 1.0820 low.
Immediate resistance is now provided by previous support at 1.1660. Rising above this important level would target the area around 1.1845, which is where the 50-day moving average has provided a barrier during the past month. Thus, rising above this resistance would indicate the short-term bearish phase has ended and EURUSD would be on the path to re-test the 1.2091 multi-year high that was hit on September 8. Clearing this point would confirm the resumption of the uptrend that started from 1.0820.
In the near-term, EURUSD is vulnerable, with risk clearly tilted to the downside as RSI is bearish below 50. The technical break of the head and shoulders neckline (1.1660) suggests downside risks remain.
US Dollar Off Friday’s Best Levels As Market Awaits Key Data And Events Week
The US dollar faced some profit-taking against other majors, after receiving a boost the previous week on tax reform hopes in the US and strong third quarter growth while the euro was hit by the political uncertainty in Spain.
Euro/dollar climbed above the 1.16 level to trade around 1.1615, as markets will be focusing on Catalonia and how the region is going to function during the week after the central government in Madrid has taken over control of the region and sacked the regional government. The tense situation seems to be weighing on the euro, which was further hit the previous week after Draghi pledged that the ECB's asset purchase program is likely to be extended further than the 9 months of 2018 and that rates would also not rise next year.
The dollar also failed to hold the 114 mark against the Japanese yen as it dipped to as low as 113.50 before recovering to 113.72. 10-year Treasury yields were lower at 2.40% (compared to a high of 2.48% on Friday), which took away some support from the greenback.
In the session's notable movers, the New Zealand dollar fell once more after its attempt to recover from Friday's lows. The kiwi traded at 0.6845 against the greenback, significantly down on the session but off Friday's low of 0.6817. The kiwi has been plagued by worries that the country's new incoming coalition government could undertake economic reforms that might lead to lower interest rates and less foreign investment.
In today's economic news, German retail sales for September missed expectations by coming in at 0.5% month-on-month against analyst forecasts of 0.7%. This had an initial negative effect on the euro, but the currency quickly recovered from those losses in an indication perhaps that some traders were willing to buy the euro at its current levels.
A little later in the European session, October business climate and consumer confidence surveys out of the European Commission will come out and in the United States, personal income and spending together with the Fed's favorite inflation indicator will also be published. In Europe the clocks turned back to winter time over the weekend, which means that the time difference with the US is smaller by one hour during this week, until the US also switches to winter time next weekend.
XAUUSD Intraday Analysis
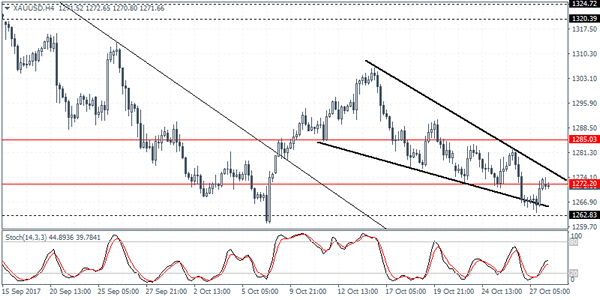
XAUUSD (1271.66): Gold prices continued to push lower last week as price briefly fell close to the 1266 handle in the short term. The current consolidation seen at 1272 level will be crucial for price action in the short term. A convincing close above this level will suggest further upside towards 1285.00. A potential breakout above this level though will shift to the bullish bias in gold prices. The next main resistance level is seen at 1324 - 1320 level.