Sample Category Title
BITCOIN Monitoring All-Time High
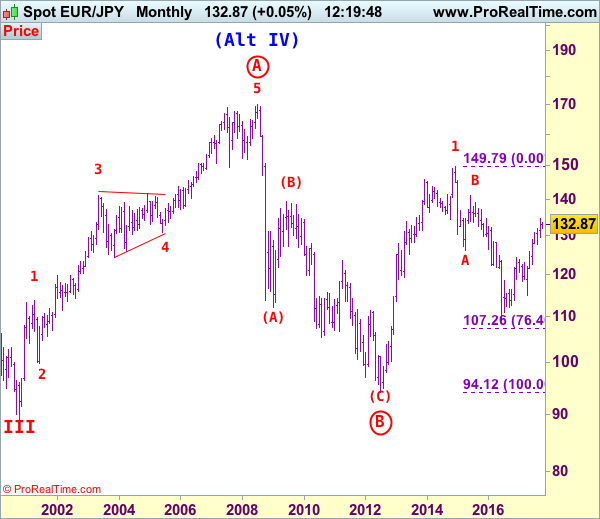
Bitcoin remains weak as long as prices remains below the key resistance at 6063. Strong support stands very far at 2975 (22/08/2017 low). However with rising trend unbroken road is wide open for further bullish momentum. Support can be located at 5325 (rising trendline). In the shortterm, the digital currency should continue rising above $6000.
In the long-term, the digital currency has had an exponential growth. There are decent likelihood that the asset will reach $10'000.
EUR/CHF Back Within Former Uptrend Channel
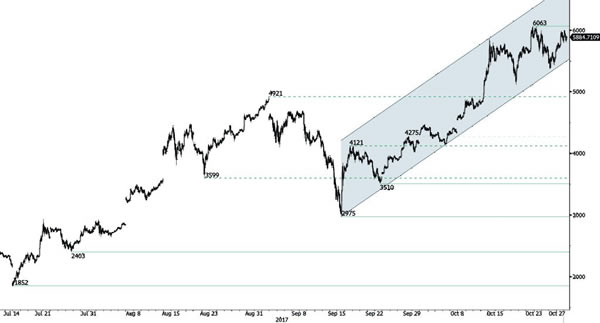
EUR/CHF is back within former uptrend channel. Support is given at 1.1610 (intraday low). Rising channel suggests further bullish momentum.
In the longer term, the technical structure has reversed. Strong resistance is given at 1.20 (level before the unpeg). Yet, the ECB's QE programme is likely to cause persistent selling pressures on the euro, which should weigh on EUR/CHF. Supports can be found at 1.0184 (28/01/2015 low) and 1.0082 (27/01/2015 low).
EUR/GBP Monitoring Support Area
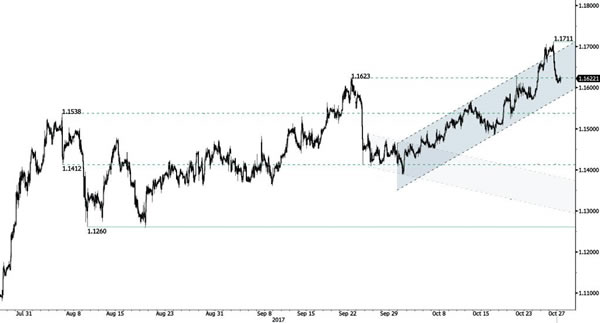
EUR/GBP is showing increasing short-term buying interest near the weak support at 0.8899 (19/09/2017 low). However, as long as prices are below the resistance at 0.9046 (05/09/2017 high), the short-term technical structure is biased to the downside Hourly support is given at a distance at 0.8746 (27/09/2017 low).
In the long-term, the pair has largely recovered from recent lows in 2015. The technical structure suggests a growing upside momentum. The pair is trading above from its 200 DMA. Strong resistance can be found at 0.9500 (psychological level).
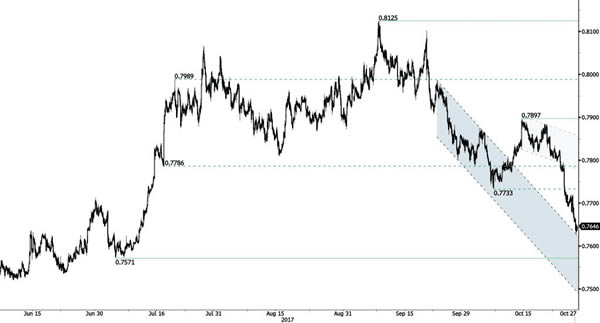
AUD/USD Continued Weakness
AUD/USD has weakened. The pair has broken support at 0.7733 (06/10/2017 low) Hourly resistance is given at 0.7897 (13/10/2017 high). Further. Expected to show continued decline towards key support at 0.7571 (05/07/2017 low).
In the long-term, the trend is turning positive. Key supports stands at 0.6009 (31/10/2008 low) . A break of the key resistance at 0.8164 (14/05/2015 high) is needed to invalidate our long-term bearish view.
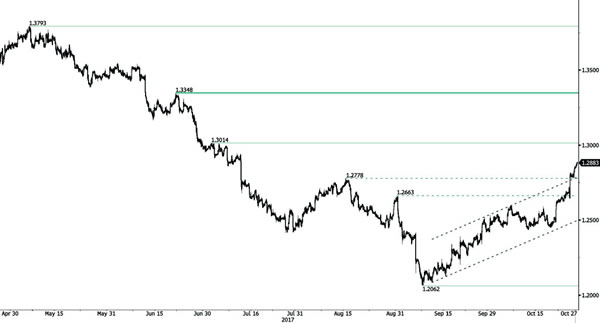
USD/CAD Surging
USD/CAD has broken resistance at 1.2778 (15/08/2017 high). This suggests an extension of bullish momentum. Hourly support lies at 1.2331 (26/09/2017 high). Expected to show continued short-term bullish pressures.
In the longer term, the pair has broken longterm support that can be found at 1.2461 (16/03/2015 low). Strong resistance is given at 1.4690 (22/01/2016 high). The pair is likely to head further lower.
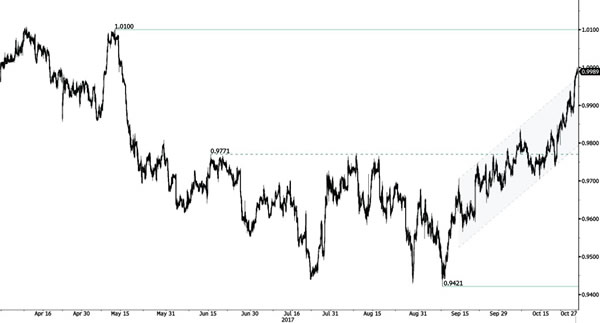
USD/CHF Bullish Breakout
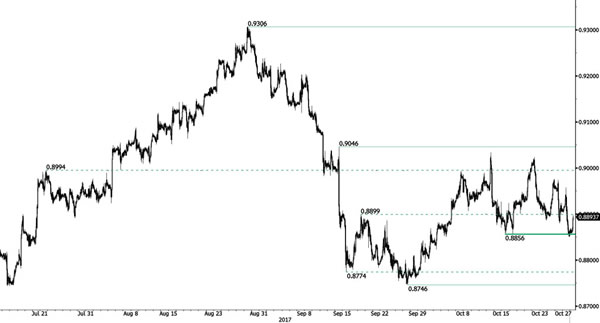
USD/CHF is clearly in a strong bullish momentum. The technical structure suggests an improving short-term buying interest. Expected to show continued bullish pressures within uptrend channel. Hourly support stands at 0.9712 (12/10/2017 low).
In the long-term, the pair is still trading in range since 2011 despite some turmoil when the SNB unpegged the CHF. Key support can be found 0.8986 (30/01/2015 low). The technical structure favours nonetheless a long term bullish bias since the unpeg in January 2015.
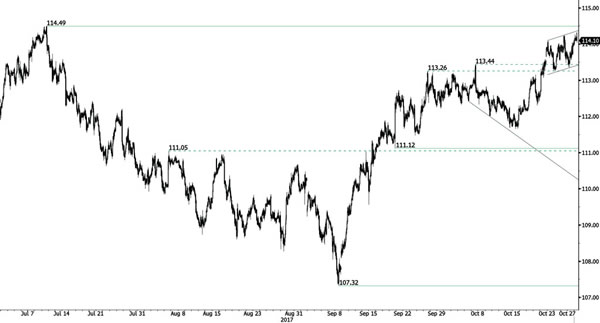
USD/JPY Heading Higher
USD/JPY has bounced back lower after reaching after setting a new hourly resistance at 114.24 (25/10/2017 high). Next key resistance can be found at 114.49 (11/07/2017 high). Support is located at 111.12 (20/09/2017 low).
We favor a long-term bearish bias. Support is now given at 99.02 (10/08/2013 low). A gradual rise towards the major resistance at 125.86 (05/06/2015 high) seems unlikely. Expected to decline further support at 93.79 (13/06/2013 low).
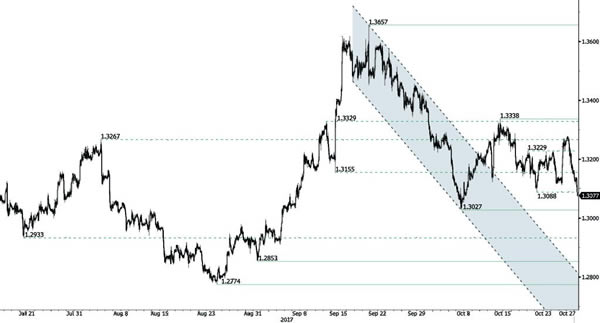
GBP/USD Pushing Lower
GBP/USD has successfully broken support at 1.3088 (12/10/2017 low). Resistance lies at (1.3229 reaction high) bouncing towards 1.3027 support. Expected to show further weakness.
The long-term technical pattern is reversing. The Brexit vote had paved the way for further decline. Long-term support can be found at 1.1841 (07/10/2017 low). Long-term resistance given around 1.35 is at stake and indicates a long-term reversal in the negative trend. Yet, it is very unlikely at the moment.
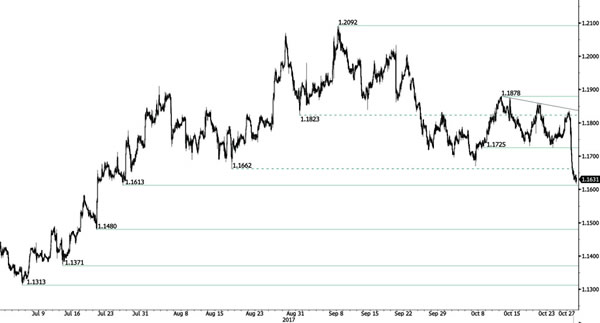
EUR/USD Sharp Decline
EUR/USD has broken support at 1.1725 (23/10/20107 low) which has triggered bearish extension to strong support given at a distance at 1.1613 (26/07/2017 low). Key resistance is located at 1.1878 (12/10/2017 high). Expected to show renewed short-term consolidation.
In the longer term, the momentum is now turning largely positive. We favour a continued bullish bias. Key resistance is holding at 1.2252 (25/12/2014 high) while strong support lies at 1.0341 (03/01/2017 low).
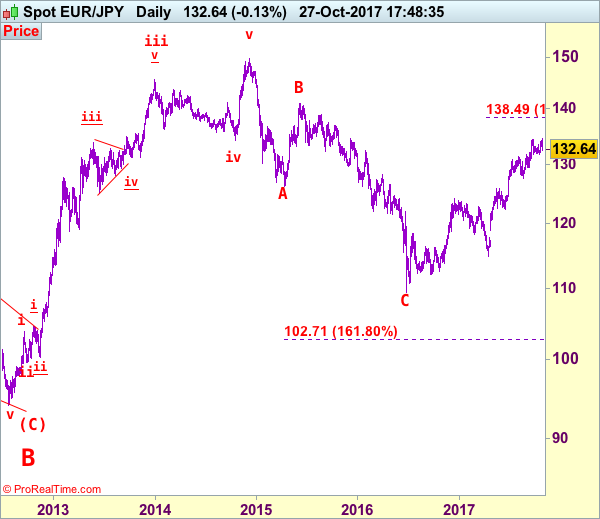
EUR/JPY Elliott Wave Analysis
EUR/JPY - 133.00
Although the single currency briefly broke above previous resistance at 134.41, lack of follow through buying and the subsequent retreat from 134.50 suggest consolidation below this level would be seen with mild downside bias for weakness to 132.45-50, then 132.00, however, a break of previous support at 131.66 is needed to signal top has been formed there, bring retracement of recent upmove to 131.00, then towards another previous support at 130.62, having said that, reckon 130.00 would hold from here, bring rebound later.
The daily chart is labeled as attached, early selloff from 169.97 (July 2008) to 112.08 is wave (A) of B instead of end of entire wave B and then the rebound from there to 139.26 is wave (B), hence, wave (C) has possibly ended at 94.12 with a diagonal triangle as labeled in the daily chart, hence upside bias is seen for further gain. Recent rally above indicated retracement level at 116.69 (50% Fibonacci retracement of the intermediate fall from 139.26-94.12) adds credence to this view and signal major reversal has commenced but first leg of this wave C has possibly ended at 149.79, hence wave 2 has commenced with wave A ended at 126.09, followed by wave B at 141.06, wave C commenced and could have ended at 109.49, indicated upside targets at 126.00 and 130.00 had been met and further gain to 135.00 would follow.
On the upside, whilst initial recovery to 133.50-60 cannot be ruled out, reckon 134.00 would hold and bring another retreat. Only break of said resistance at 134.50 would abort and signal recent upmove has resumed and extend further gain to 135.00, however, loss of upward momentum should prevent sharp move beyond 136.00-10 and reckon 136.95-00 would hold, price should falter well below 138.45-50 (1.618 times extension of 109.49-124.10 measuring from 114.85), bring correction later.
Recommendation: Sell at 133.50 for 131.50 with stop below 134.50.
To re-cap the corrective upmove from the record low of 88.93 (18 Oct 2000), the wave A from there is subdivided as: 1:88.93-113.72, 2:99.88 (1 Jun 2001), 3:140.91 (30 May 2003), 4:124.17 (10 Nov 2003) and 5 ended at record high of 169.97 (21 Jul 2008). The brief but sharp selloff to 112.08 is viewed as a-b-c x a-b-c wave (A) of B. The subsequent rebound to 139.26 is (B) of B and (C) of (B) has possibly ended at 94.12 and in any case price should stay well above previous chart support at 88.93, bring rally in larger degree wave C towards 150.00.