Sample Category Title
Trade Idea: EUR/GBP – Sell at 0.8920
EUR/GBP - 0.8848
Original strategy :
Sell at 0.8920, Target: 0.8820, Stop: 0.8960
Position : -
Target : -
Stop : -
New strategy :
Sell at 0.8920, Target: 0.8820, Stop: 0.8960
Position : -
Target : -
Stop : -
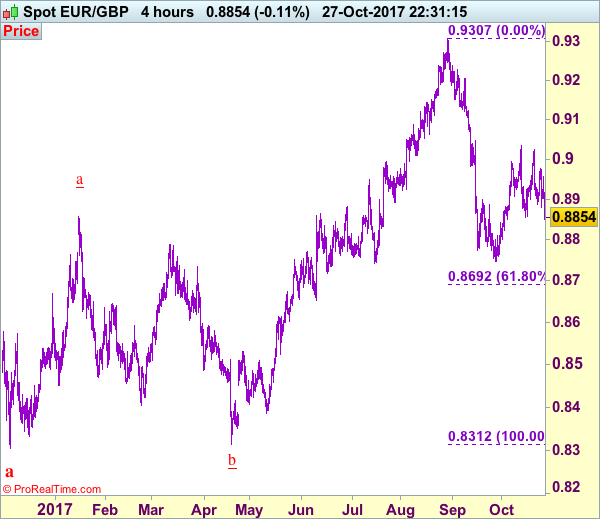
As the single currency has remained under pressure after breaking below previous support at 0.8856, adding credence to our bearish view that top has been formed at 0.9033 earlier and downside bias remains for the erratic decline from there to bring further fall to 0.8820-25, then towards 0.8800, however, near term oversold condition should limit downside and reckon 0.8770 would hold from here.
In view of this, we are looking to sell euro again on recovery as 0.8920-30 should limit upside. Above said resistance at 0.8957 would shift risk to upside for test of 0.8976 but reckon upside would be limited to 0.9000 and said resistance at 0.933 should remain intact, bring another retreat later.
Our preferred count is that, after forming a major top at 0.9805 (wave V), (A)-(B)-(C) correction is unfolding with (A) leg ended at 0.8400 (A: 0.8637, B: 0.9491 and 5-waver C ended at 0.8400. Wave (B) has ended at 0.9413 and impulsive wave (C) has either ended at 0.8067 or may extend one more fall to 0.8000 before prospect of another rally. Current breach of indicated resistance at 0.9043 confirms our view that the (C) leg has ended and bring stronger rebound towards 0.9150/54, then towards 0.9240/50.
Trade Idea: USD/CAD – Buy at 1.2785
USD/CAD - 1.2892
Trend: Near term up
Original strategy :
Buy at 1.2720, Target: 1.2900, Stop: 1.2660
Position: -
Target: -
Stop: -
New strategy :
Buy at 1.2785, Target: 1.2985, Stop: 1.2725
Position: -
Target: -
Stop:-
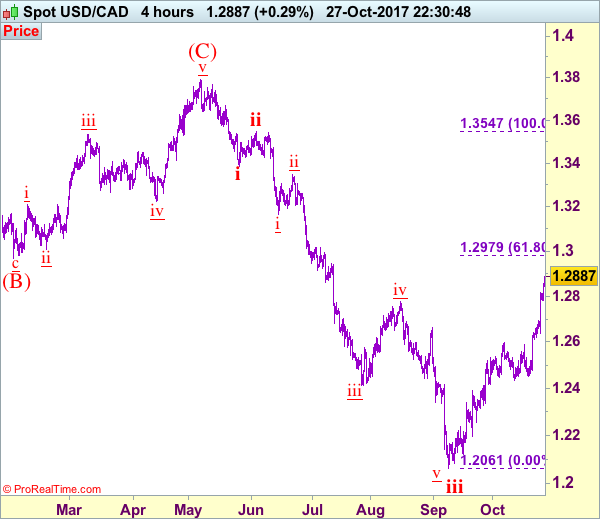
As the greenback has continued heading north, adding credence to our bullish view that the rise from 1.2061 low is still in progress and upside bias remains for this move from there (wave iii trough) to extend further gain to 1.2920, having said that, as we are still treating this rebound from 1.2061 as wave iv, reckon 1.2975-80 (61.8% Fibonacci retracement of wave iii) would limit upside and 1.3000 should hold, bring selloff later in wave v. We are keeping our count that wave v as well as wave (C) ended at 1.3794 and impulsive wave (i ii, i ii) is now unfolding with minor wave iii ended at 1.2414, followed by wave iv correction ended at 1.2778, wave v has reached our indicated downside target at 1.2100 and may extend to 1.2000.
In view of this, we are looking to reinstate long on pullback but at a higher level as 1.2785-90 should limit downside and bring another rise. Below 1.2725-30 would defer and suggest a temporary top is possibly formed, bring correction to 1.2690-00 but break of support at 1.2635-40 is needed to confirm, bring weakness to 1.2610-15, then test of 1.2591.
To recap, wave B from 1.3066 is unfolding as an a-b-c and is sub-divided as a: 1.2192, b: 1.2716 and wave c is a 5-waver with i: 1.1983, ii: 1.2506, extended wave iii with minor iii at 1.0206, wave iv ended at 1.0781 and wave v as well as wave iii has ended at 0.9931, hence the subsequent choppy trading is the wave iv which is unfolding as (a)-(b)-(c) with (a) leg of iv ended at 1.0854, followed by (b) leg at 1.0108 and (c) leg as well as the wave iv ended at 1.0674. The wave v is sub-divided by minor wave (i): 0.9980, (ii): 1.0374, (iii): 0.9446, (iv): 0.9913 and (v) as well as v has possibly ended at 0.9407, therefore, consolidation with upside bias is seen for major correction, indicated target at 1.3700 and 1.4000 had been met and further gain to 1.4700 would be seen later.
A Story of the Euro and the Dollar, Rather than of Sterling
- Most European equity indices show solid gains between 0.5% and 1.0% supported by good earnings and by a stronger dollar. Spain is the exception to the rule as political uncertainty intensifies.
- US equities also open in positive territory. The Nasdaq outperforms, supported by strong results from the likes Amazon, Google and Microsoft, published yesterday after the close of the markets.
- Catalonia's parliament has voted overwhelmingly in favour of independence from Spain even as the Spanish authorities prepared to take direct control of the powerful and wealthy region.
- The US economy expanded at a 3.0% annualized rate in the third quarter, better than consensus. Personal consumption growth held up better than expected. Business investment also supported growth as did inventories. Net exports also contributed in a positive way. The core PCE deflator rose for 0.9% to 1.3%, as expected but remains well below the 2% mark.
- Swedish economic tendency indicator falls to 113.3 in October from revised 113.9 in September and vs est. 112.0. Still, the NIER said that the indicator points to 'much stronger growth than normal in the Swedish economy'. Consumer confidence rises to 105.3 from 101.8 in September and vs est. 102.0.
- Respondents to European Central Bank's Survey of Professional Forecasters raised the inflation outlook for 2022 to 1.9% from 1.8% three months ago. They kept the inflation outlook for 2017, 2018, 2019 unchanged at 1.5%, 1.4%, 1.6%, respectively
- Britain's talks on exiting the European Union cannot progress, as London wishes, to cover trade relations until it gives more clarity on what will happen at the border with Ireland, Irish Foreign Minister Simon Coveney said.
Rates
Catalan parliament votes in favour of independence
The Bund's outperformance vs the US Note future continued today. Bunds still profited (marginally) from yesterday's dovish ECB meeting, while the Catalan vote on a declaration of independence also warranted some cautiousness and lead to an underperformance of Spanish assets. The eco calendar was uneventful while hawkish German Bundesbank president Weidmann already showed his disagreement with keeping APP open-ended. Of course, as ECB President Draghi indicated yesterday, he is in the minority. The Bund trades with an upward bias as we finish our report after Catalan parliament effectively voted in favour of independence. The US eco calendar was more enticing with the first reading of Q3 GDP. The outcome beat expectations with 3% Q/Q growth on an annual basis and good contributions from consumption and investments. It didn't inflict additional losses on US Treasuries. However, from a technical point of view, US yields remain above key technical levels (5-yr: 2%, 10-yr: 2.42%, 30-yr: 2.95%) suggesting new, higher, trading bands.
At the time of writing, changes on the German yield curve range between -0.4 bps (2-yr) and +1.4 bps (30-yr). The US yield curve flattens with yield changes varying between +0.5 bps (2-yr) and -2.4 bps (30-yr). On intra-EMU bond markets, 10-yr yield spread changes versus Germany are nearly unchanged with Portugal outperforming (-5 bps) and Spain underperforming (+7 bps) after the Catalan vote. This will probably be countered by a reaction from Madrid, by voting on the implementation of article 155 and stripping Catalunya from its autonomy.
Currencies
EUR/USD extends decline after yesterday's break
EUR/USD extended the decline that started after yesterday's ECB decision. The move was both due to euro softness and USD strength. EUR/USD filled bids below 1.16 after a good US GDP. USD/JPY tested 114.45 resistance, but a break didn't occur despite broad-based equity gains.
Overnight, Asian equities mostly traded with decent gains, supported by strong earnings from several US Tech bellwethers after the close on WS. USD/JPY only made some modest extra gain despite the equity rally and traded in the low 114 area. EUR/USD traded with a slightly negative bias in the wake of yesterday's 'soft' ECB policy decision.
European equity markets mostly opened with good gains supported by positive sentiment in the US and in Asia this morning. Yesterday's decline of the euro/rise of the dollar was also supportive for European equities. EUR/USD tried to extend yesterday's decline early in European dealings, but the moved stalled in the 1.1615 area as investors awaited the Q3 US GDP report. US/German interest rate differentials also stabilized after yesterday's big widening. USD/JPY still struggled to extend gains beyond 114 despite positive equity sentiment. Headlines on the political developments in Spain remained chaotic, but had little impact on markets outside Spain, including on the single currency.
The dollar captured again a better bid as US traders joined the fray. The US Q3 GDP release came out at 3.0% Q/Qa, above the consensus estimate of 2.6%. Consumption growth slowed less than expected and investments were stronger than expected. The reaction on the US interest rate markets was negligible. Still the dollar made some further headway. EUR/USD dropped below the 1.16 mark. USD/JPY touched the 114.45 range top, but a real break didn't occur. EUR/USD trades currently in the 1.1595 area. USD/JPY trades again in the low 114 area. Yesterday's technical break of EUR/USD below 1.1670/62 looks to be confirmed today. We still considered it in the first place a repositioning out of euro longs after yesterday's ECB decision. Dollar sentiment is also improving, but the inability of USD/JPY to break a key technical level on rising interest rate support combined with a strong upleg of equities suggests that not all underlying doubts on the dollar have receded yet.
A story of the euro and the dollar, rather than of sterling
EUR/GBP declined quite sharply yesterday as the euro sold off after the ECB's policy decision. EUR/GBP dropped below the 0.89 handle. This morning, EUR/USD held near the post-ECB lows, but EUR/GBP returned to the 0.89 area as ongoing diffuse comments on the Brexit process from inside and outside the UK weighed on sterling. However, the sterling decline petered out around noon. EUR/GBP trades currently again in the 0.8855 area, close to the intraday lows. Cable trades just below 1.31. For this cross rate, the intraday lows are still within reach. Today's price action in the major sterling cross rates mainly mirrors repositioning in the euro and the dollar rather than telling anything on sterling.
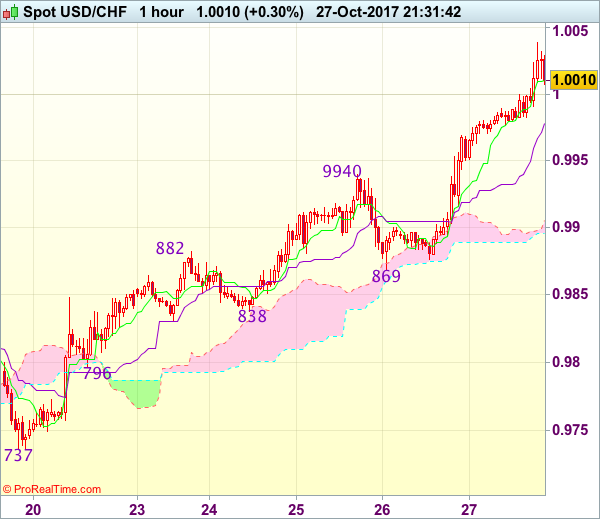
Trade Idea Update: USD/CHF – Buy at 0.9935
USD/CHF - 1.0010
Original strategy :
Buy at 0.9935, Target: 1.0035, Stop: 0.9900
Position : -
Target : -
Stop : -
New strategy :
Buy at 0.9935, Target: 1.0035, Stop: 0.9900
Position : -
Target : -
Stop : -
As the greenback has continued heading north after breaking resistance at 0.9940, adding credence to our bullish view that recent rise from 0.9421 low is still in progress and may extend further gain to 1.0040-50, having said that, overbought condition should limit upside to 1.0075-80 and price should falter below 1.0100 resistance and bring retreat later.
In view of this, we are looking to buy dollar again on pullback as previous resistance at 0.9940 should turn into support and limit downside, bring another rise later. Below the Ichimoku cloud (now at 0.9905-13) would defer and suggest top is possibly formed, risk test of support at 0.9869.
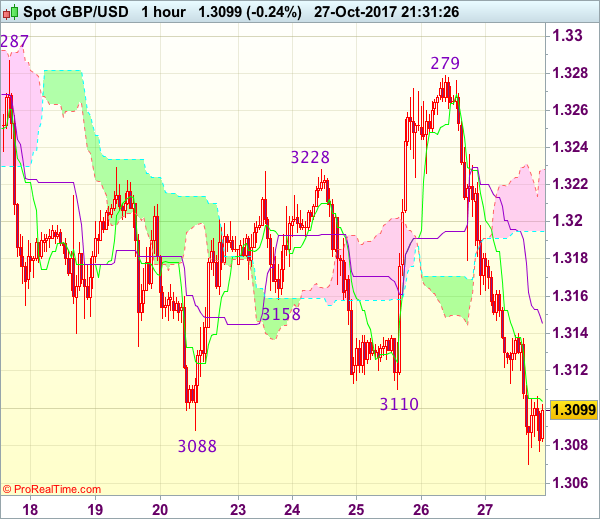
Trade Idea Update: GBP/USD – Sell at 1.3160
GBP/USD - 1.3087
Original strategy :
Sell at 1.3170, Target: 1.3070, Stop: 1.3205
Position : -
Target : -
Stop : -
New strategy :
Sell at 1.3160, Target: 1.3060, Stop: 1.3195
Position : -
Target : -
Stop : -
As cable’s decline from 1.3279 has accelerated and price just broke below indicated support at 1.3110, adding credence to our view that the rebound from 1.3088 has ended there and retest of this support is underway, however, break there is needed to confirm early decline from 1.3338 has resumed and extend weakness to 1.3050, then towards recent low at 1.3027 which is likely to hold on first testing due to near term oversold condition.
In view of this, we are looking to sell cable on recovery as the Kijun-Sen (now at 1.3146) should limit upside and bring another decline later. Above 1.3195-00 would defer and risk a stronger rebound to 1.3230-35, however, price should falter well below said resistance at 1.3279 and bring another decline later.
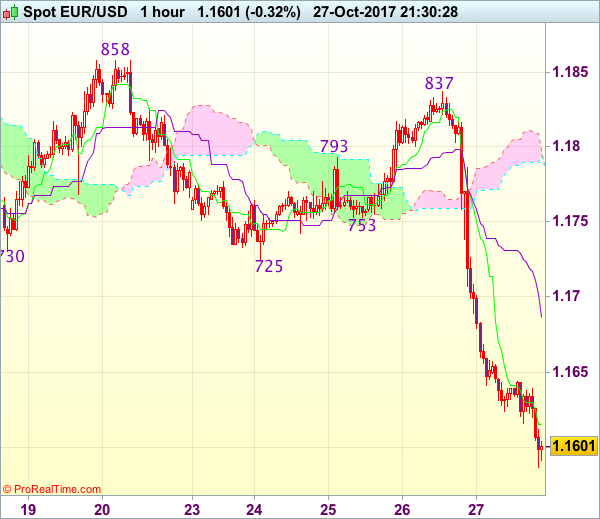
Trade Idea Update: EUR/USD – Sell at 1.1715
EUR/USD - 1.1591
Original strategy :
Sell at 1.1715, Target: 1.1615, Stop: 1.1750
Position : -
Target : -
Stop : -
New strategy :
Sell at 1.1685, Target: 1.1585, Stop: 1.1720
Position : -
Target : -
Stop : -
Euro’s decline has gathered momentum after breaking below support at 1.1725 yesterday and previous low at 1.1669 was breached as well, adding credence to our view that the fall from 1.2093 top is still in progress and bearishness remains for this move to extend weakness to 1.1580-85, however, near term oversold condition should limit downside to 1.1550-55 and reckon 1.1520-25 would hold, bring rebound later.
In view of this, we are looking to sell euro on recovery but at a lower level as the Kijun-Sen (now at 1.1686) should limit upside and bring another decline. Only above previous support at 1.1725 (now resistance) would signal an intra-day low is formed, bring retracement of recent decline to 1.1750-55 first.
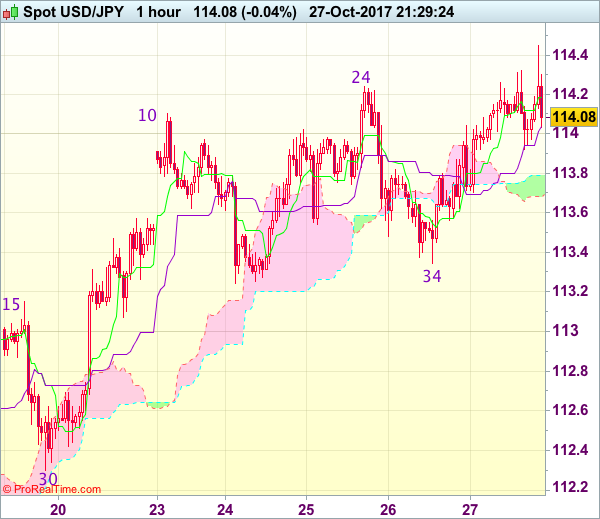
Trade Idea Update: USD/JPY – Stand aside
USD/JPY - 114.09
Original strategy :
Buy at 113.70, Target: 114.70, Stop: 113.35
Position : -
Target : -
Stop : -
New strategy :
Stand aside
Position : -
Target : -
Stop : -
As dollar has retreated after intra-day brief rise to 114.45, suggesting consolidation below this level would be seen and pullback to the upper Kumo (now at 113.79) cannot be ruled out, however, reckon downside would be limited to 113.50 and support at 113.34 (yesterday’s low) should remain intact, bring another rise later.
In view of this, would not chase this rise here and would be prudent to stand aside for now. Above 114.45 would extend recent rise from 107.32 low for further gain to 114.75-80 (61.8% projection of 111.65-114.10 measuring from 113.24), however, overbought condition should limit upside to 115.00 and risk from there is seen for a retreat later.
US GDP Jumped Higher Again in Q3 Despite Severe Weather
Highlights:
- US Q3 GDP rose 3.0% - marking a second-consecutive quarter of 'above-potential' growth following a similar 3.1% Q2 gain.
- The Fed will likely be encouraged by both the headline growth number and the composition - in particular another solid gain in business investment.
- Our forecast assumes further gradual interest rate hikes from the Federal Reserve will be warranted. We look for another 25 basis point hike in December and another 4 over the course of 2018
Our Take:
The 3.0% gain in Q3 GDP marks a second consecutive quarter of growth well-above the economy's long-run 'potential' growth rate. Alongside another drop in the unemployment rate in Q3, that should provide further reassurance that output continues to grow at a pace that is strong enough to absorb any remaining excess capacity in the economy. The composition of growth was also relatively favourable. Household spending growth slowed but probably in part due to the hurricanes and business investment rose solidly for a third straight quarter despite the severe weather. Business investment was largely a missing component of growth in 2016, so the emergence of a more 'balanced' growth profile in 2017 - less dependent on household spending alone - has been a positive development that appears to be persisting.
Inflation pressures have admittedly remained benign, with growth in the core PCE deflator slowing further in Q3. Inflation also typically lags the economic cycle, though, so an economy that otherwise now looks close to capacity limits continues to suggest that price growth will rise rather than fall going forward. We don't think the Fed will opt to hike rates following next week's policy meeting after announcing tapering asset holdings at the last meeting in September. The relatively strong flow of recent data, though, should further strengthen already widely-held expectations that monetary policymakers will raise the fed funds target range by 25 basis points for a third time this year in December.
U.S. Economy Tops Expectations With 3% Growth in Q3
The American economy grew by 3.0% (annualized) in the third quarter according to the BEA's advance estimated, ahead of consensus forecast for 2.6%.
Consumer spending also came in ahead of expectations, rising by 2.4% (the median consensus estimate was 2.1%). The gain was led by spending on durable goods, which climbed +8.3%. Non-durable goods spending rose 2.1%, while services spending inched up 1.4%. The services category was likely negatively impacted by hurricane activity.
Business investment had another decent quarter, rising by 3.9%, even as non-residential structures fell 5.2%. The gain was led by equipment spending, which rose 8.6%, while spending on intellectual property products rose 4.3%
Residential construction also fell 6.0%. Both residential and non-residential structures categories were impacted by disruptions related to Hurricanes Harvey and Irma.
Net exports added 0.4 percentage points to real GDP growth. Exports rose 2.3% while imports fell 0.8%. Imports may have been delayed by hurricanes and this is one area where there could be modest give back in the quarter ahead.
Inventory investment also made a significant contribution to growth, adding 0.7 percentage points to the headline figure.
Key Implications
Even with two major hurricanes making landfall in the United States, the economy made significant progress in the third quarter. Outside of the areas directly impacted by the hurricanes, there are few signs of weakness in this report.
With rebuilding likely to boost economic growth in the fourth quarter, there is a good chance that yet another quarter of 3% growth is in store. This is well-above the economy's potential rate (around 2.0%) and is consistent with ongoing declines in the unemployment rate, which, at 4.2% is already below its estimated long-run level.
Score one for the hawks on the Federal Open Market Committee. The FOMC may hold on raising rates at its meeting next week, but with such broad-based economic strength, a hike in December is near certain at this point.
USD/JPY Mid-Day Outlook
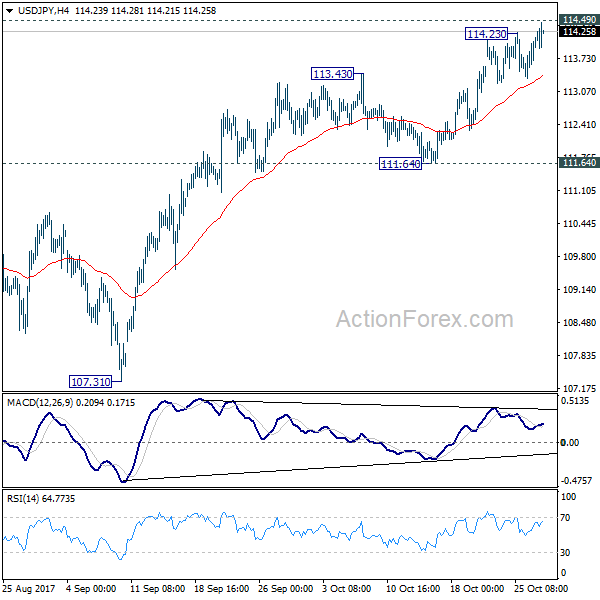
Daily Pivots: (S1) 113.52; (P) 113.79; (R1) 114.26; More...
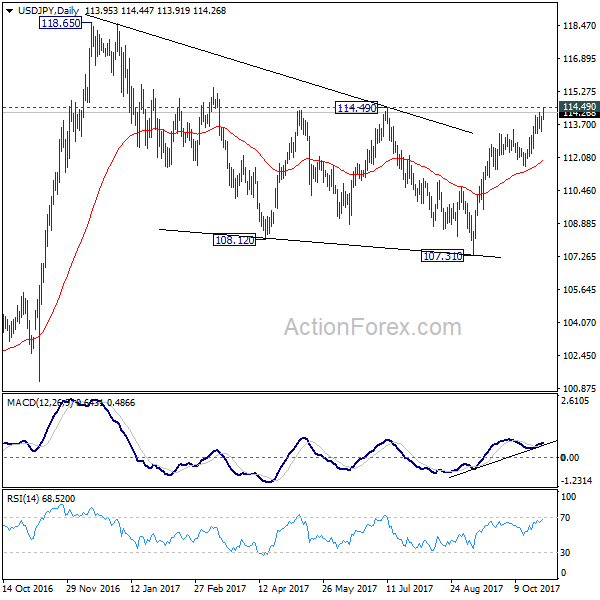
Focus remains on 114.49 resistance in USD/JPY. Decisive break there will confirm that correction pattern from 118.65 has completed at 107.31 already. And USD/JPY should then target a test on 118.65. And in any case, outlook will remain cautiously bullish as long as 111.64 support holds.
In the bigger picture, medium term rise from 98.97 (2016 low) is not completed yet. It should resume after corrective fall from 118.65 completed. Break of 114.49 resistance will likely resume the rise to 61.8% projection of 98.97 to 118.65 from 107.31 at 119.47 first. Firm break there will pave the way to 100% projection at 126.99. This will be the key level to decide whether long term up trend is resuming.