
Sample Category Title
USD/CHF Weekly Outlook
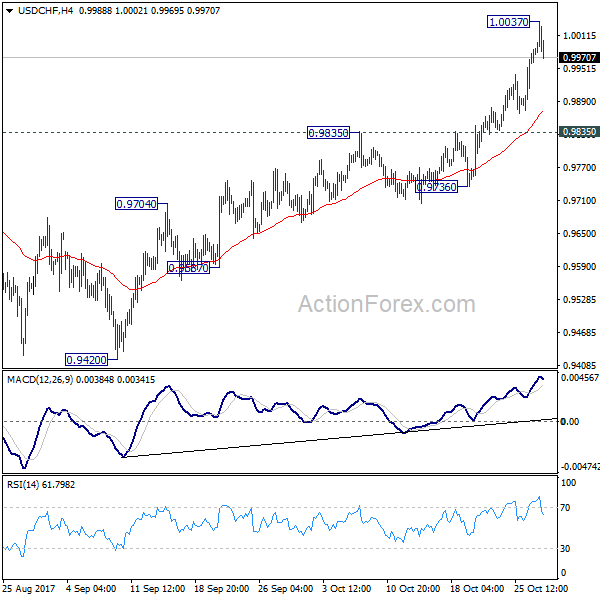
USD/CHF surged to as high as 1.0037 last week but formed a temporary top there and retreated. Initial bias is neutral this week for consolidation first. Downside should be contained above 0.9835 resistance turned support and bring rally resumption . Since 61.8% retracement of 1.0342 to 0.9420 at 0.9990 is already met, break of 1.0037 will turn bias to the upside for 1.0342 key resistance next.
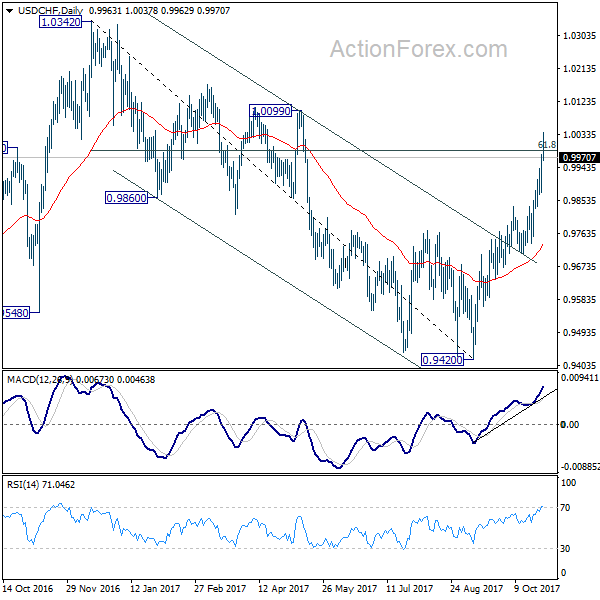
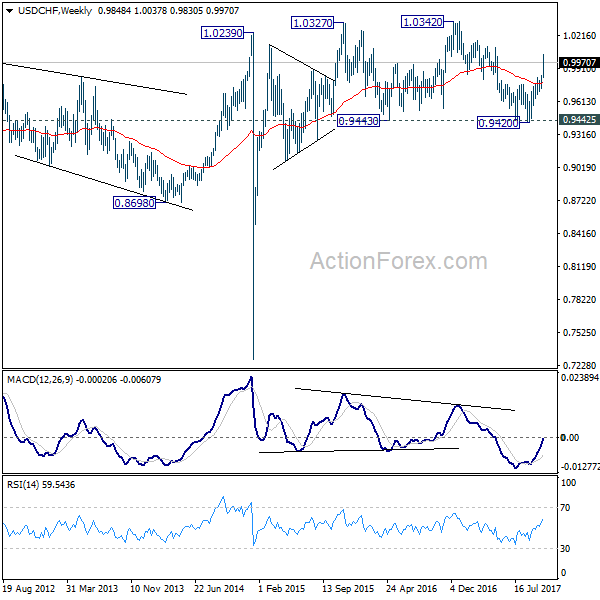
In the bigger picture, current development suggests that USD/CHF has defended 0.9443 (2016 low) key support level again. Rise from 0.9420 could is a medium term up move and should target a test on 1.0342 high. This represents the upper end of a long term range that started back in 2015. On the downside, break of 0.9736 support is now needed to indicate completion of the rise from 0.9420. Otherwise, further rally will remain in favor in medium term.
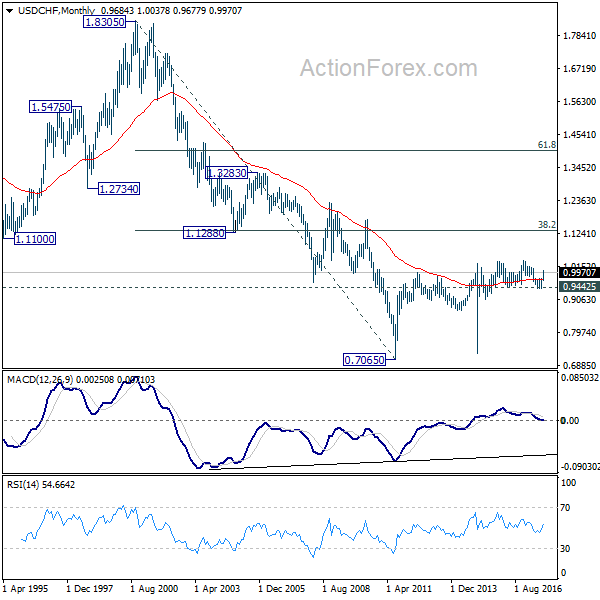
In the long term picture, while upside momentum is unconvincing, with 0.9443 key support intact, rise from 0.7065 (2011 low) is still expected to continue. Break of 1.0342 will target 38.2% retracement of 1.8305 (2000 high) to 0.7065 at 1.1359.
AUD/USD Weekly Outlook
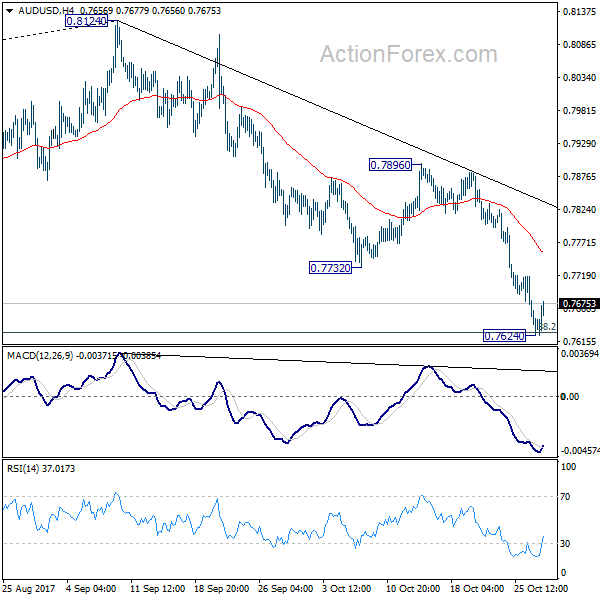
AUD/USD's decline from 0.8124 resumed last week by taking out 0.7732 already. A temporary low is formed at 0.7624 after hitting 0.7628 fibonacci level. Initial bias is neutral this week for consolidations first. But upside of recovery should be limited well below 0.7896 resistance to bring fall resumption. Firm break of 0.7624 will target next key cluster level at 0.7322/8.
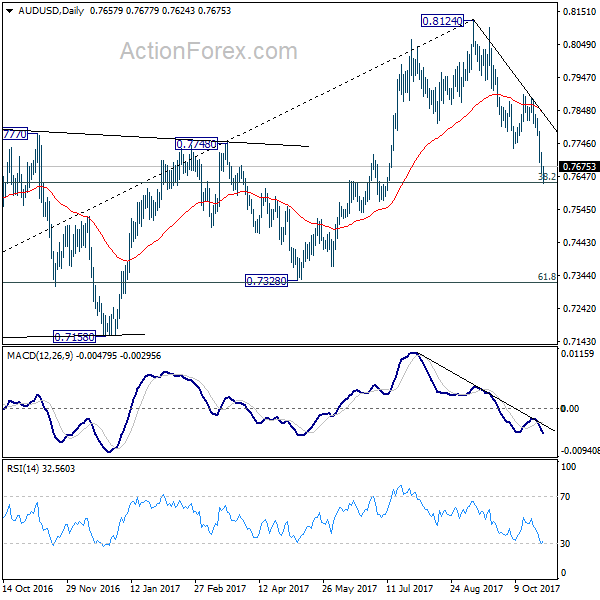
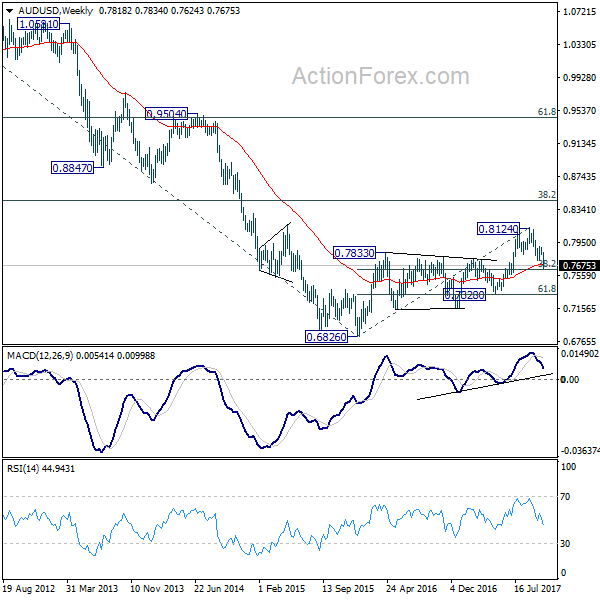
In the bigger picture, corrective rise from 0.6826 medium term bottom is likely completed at 0.8124, after hitting 55 month EMA (now at 0.8067). Decisive break of 0.7328 key cluster support (61.8% retracement 0.6826 to 0.8124 at 0.7322) will confirm. And in that case, long term down trend from 1.1079 (2011 high) will likely be resuming. Break of 0.6826 will target 61.8% projection of 1.1079 to 0.6826 from 0.8124 at 0.5496. This will now be the favored case as long as 0.7896 near term resistance holds.
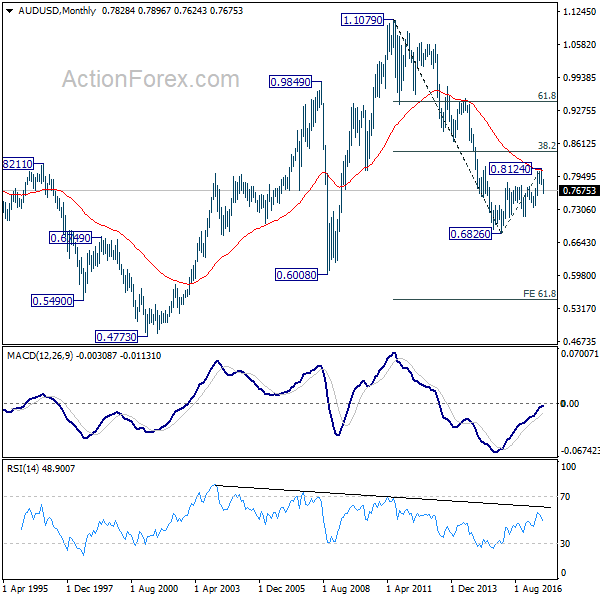
In the longer term picture, 0.6826 is seen as a long term bottom. Rise from there could either reverse the down trend from 1.1079, or just develop into a corrective pattern. At this point, we're favoring the latter. And, as long as 38.2% retracement of 1.1079 to 0.6826 at 0.8451 holds, we'd anticipate another decline through 0.6826 at a later stage. But strong support should be seen between 0.4773 (2001 low) and 0.6008 (2008 low).
USD/CAD Weekly Outlook
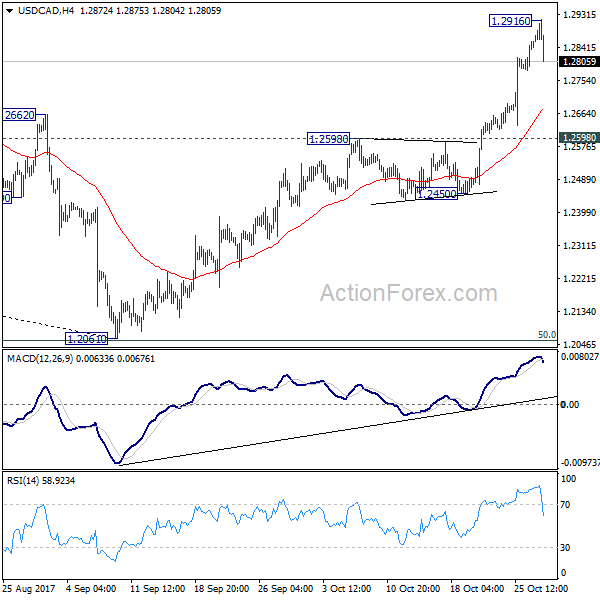
USD/CAD surged to as high as 1.2916 last week but formed a temporary top there and retreated. Initial bias is turned neutral for some consolidations this week first. Downside of retreat should be contained above 1.2598 resistance turned support and bring rally resumption. Medium term trend in USD/CAD should have reversed Break of 1.2916 will extend the rise from 1.2061 to 38.2% retracement of 1.4689 to 1.2061 at 1.3065.
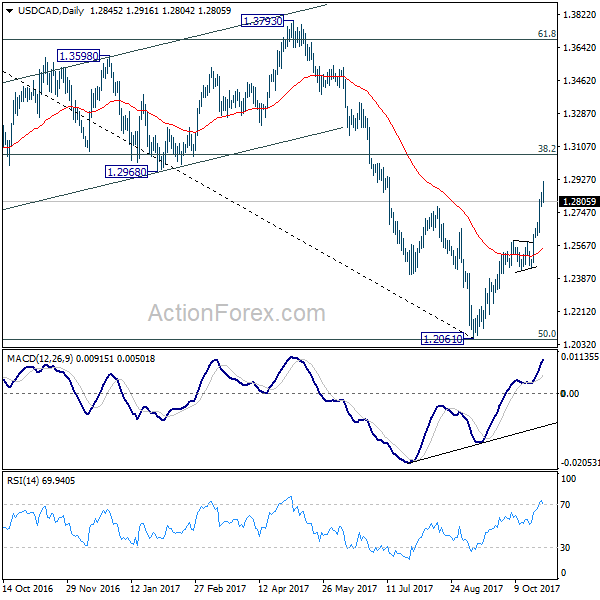
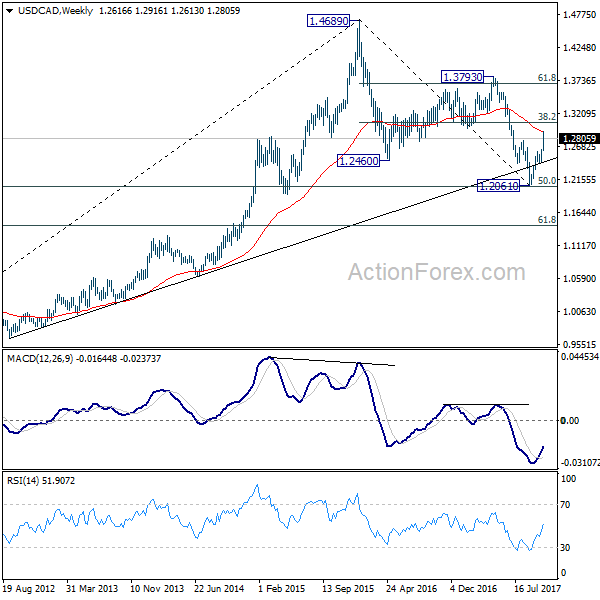
In the bigger picture, USD/CAD should have defended 50% retracement of 0.9406 (2011 low) to 1.4689 (2016 high) at 1.2048. And with 1.2048 intact, we'd favor the case that fall from 1.4689 is a correction. Rise from 1.2061 medium term bottom should now target 38.2% retracement of 1.4689 to 1.2061 at 1.3065. Firm break there will target 1.3793 key resistance next (61.8% retracement at 1.3685). We'll now hold on to this bullish view as long as 1.2450 support holds.
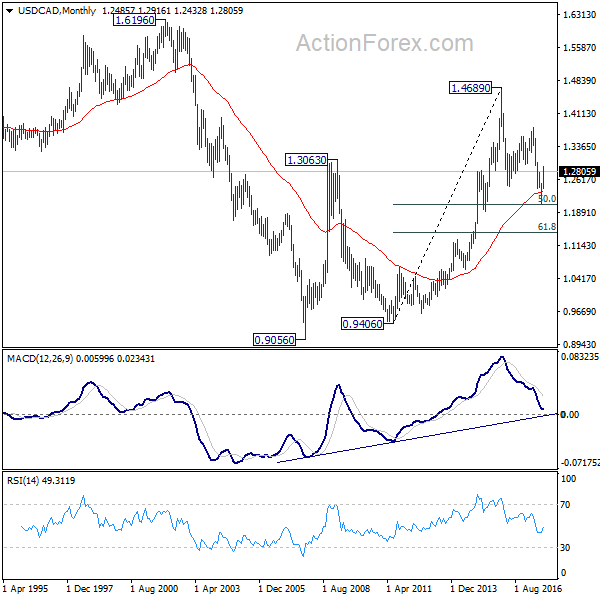
In the longer term picture, current development argues that correction from 1.4689 has completed with three waves down to 1.2061 already. And larger up trend from 0.9056 (2007 low) is still in progress. Firm break of 1.3794 resistance should now indicate up trend resumption through 1.4689 high.
GBP/JPY Weekly Outlook
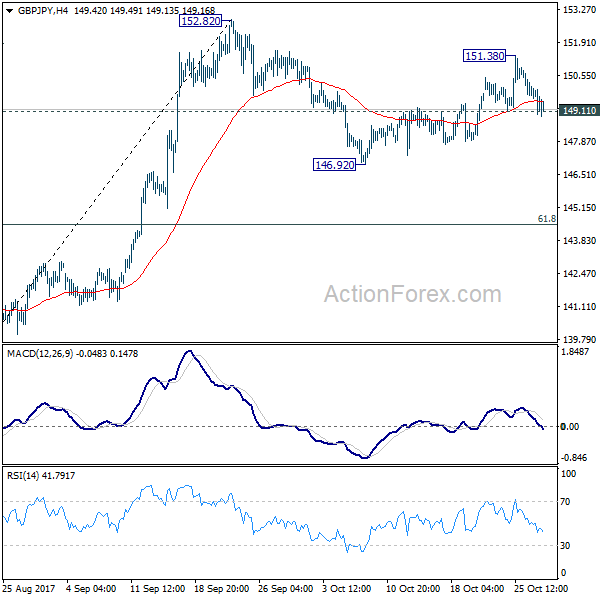
GBP/JPY recovered to 151.38 last week. But subsequent fall and break of 149.11 minor support indicates that the corrective rise from 146.92 is completed. Initial bias is turned to the downside or 146.92 first. Break there will resume the decline from 152.82 and target 61.8% retracement of 139.29 to 152.82 at 144.45. Such decline is seen as a correction and we'd look for strong support from 144.45 to bring rebound. On the upside, above 151.38 will target a test on 152.82 high instead.
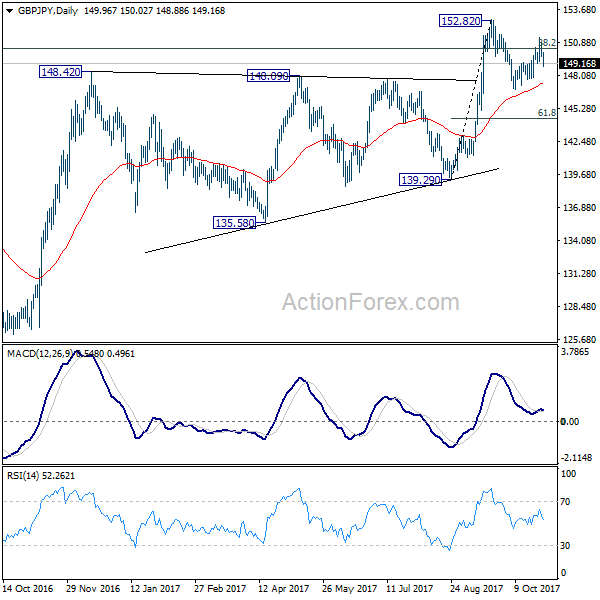
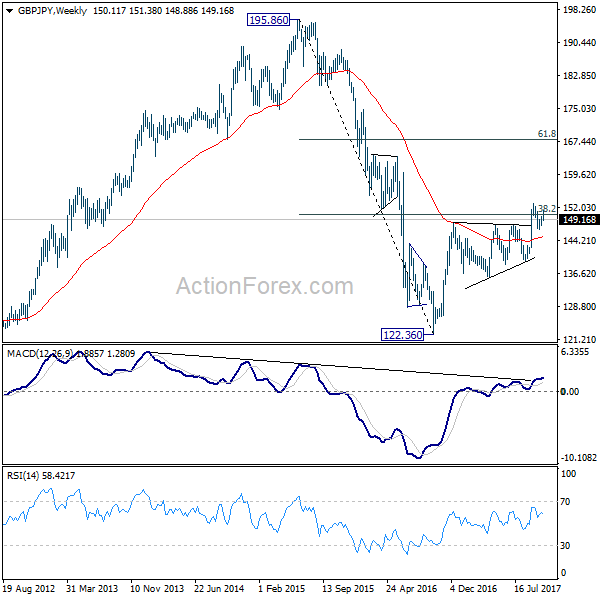
In the bigger picture, medium term rebound from 122.36 is still expected to resume after corrective pull back from 152.82 completes. Firm break of 38.2% retracement of 196.85 to 122.36 at 150.43 will carry long term bullish implications. In that case, GBP/JPY could target 61.8% retracement at 167.78. However, break of 139.29 will indicate rejection from 150.43 key fibonacci level. And the three wave corrective structure of rebound from 122.36 will argue that larger down trend is resuming for a new low below 122.26.
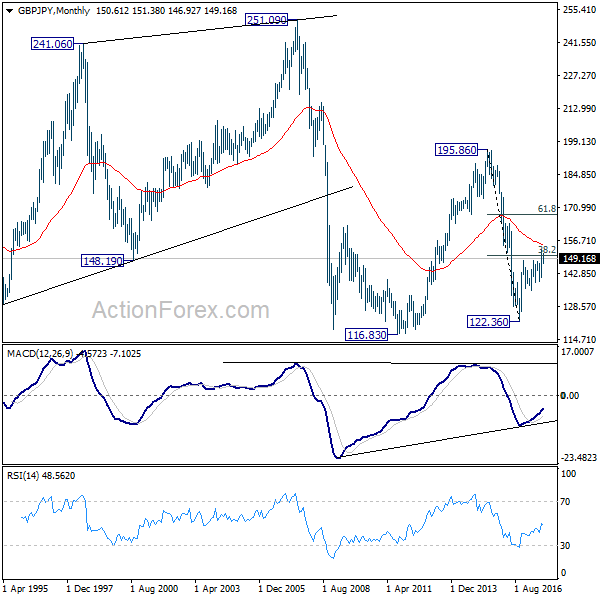
In the longer term picture, current rebound argues that the down trend from 195.86 (2015 high) has already completed at 122.36. Focus is now on 55 month EMA (now at 154.93). Firm break there will suggest that rise form 122.36 is developing into a long term move that target 195.86 again. And, price actions from 116.83 (2011 low) is indeed a sideway pattern that could last more than a decade. However, firm break of 139.29 will suggests that the long term down trend is still in progress and could break 116.83 low ahead.
EUR/JPY Weekly Outlook
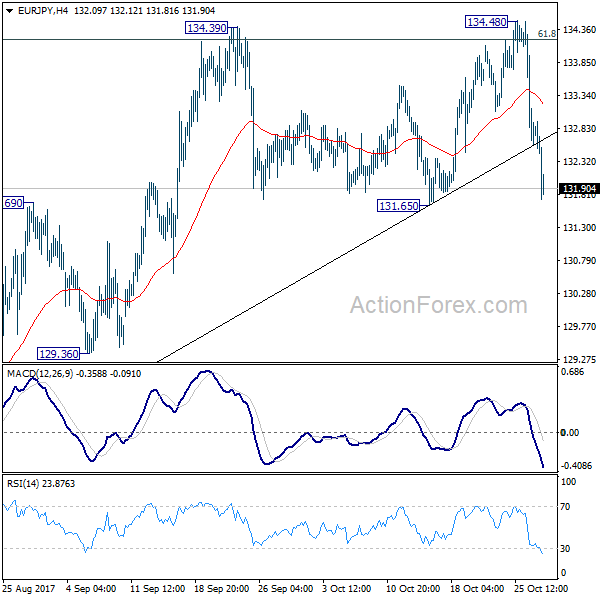
EUR/JPY edged higher to 134.48 last week but failed to sustain above 134.39 resistance and retreated sharply. Initial bias remains neutral this week with focus on 131.65 support. Decisive break there will confirm rejection from 134.20 fibonacci level. That will also complete and double top pattern and confirms near term reversal. 55 day EMA will also be firmly taken out. In that case, deeper decline should be seen back to 127.55 key support. Meanwhile, decisive break of 134.39/48 resistance zone will confirm up trend resumption. In such case, EUR/JPY should target 141.04 long term resistance.
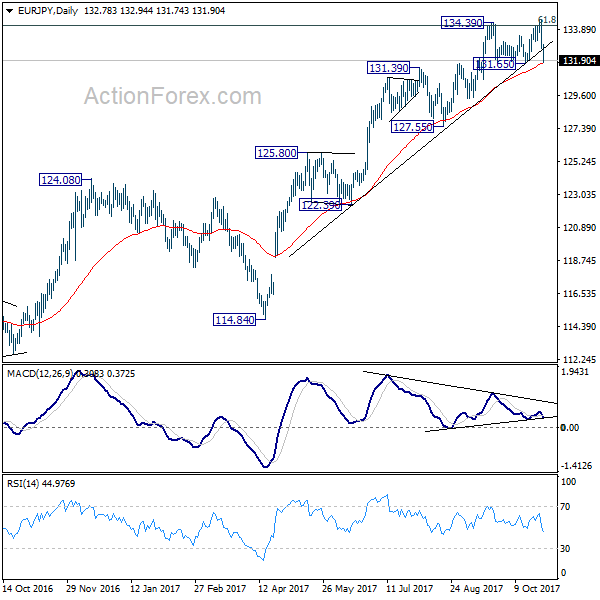
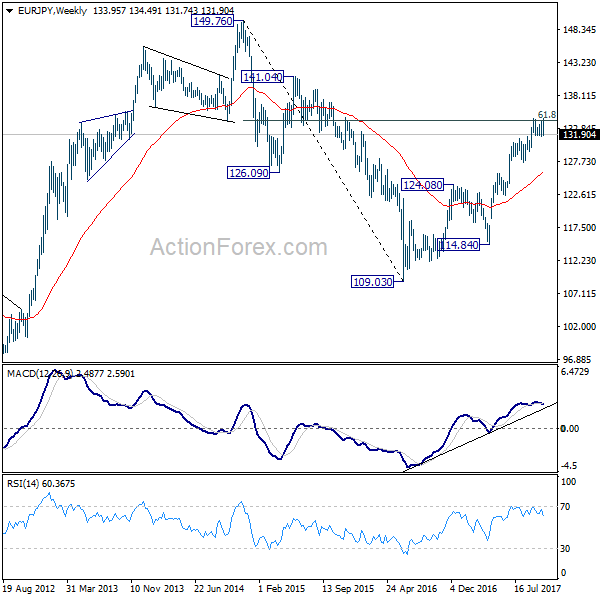
In the bigger picture, medium term rise from 109.03 (2016 low) is seen as at the same degree as the down trend from 149.76 (2014 high) to 109.03 (2016 low). 61.8% retracement of 149.76 to 109.03 at 134.20 is already met. Sustained break there will pave the way to key long term resistance zone at 141.04/149.76. However, break of 127.55 support will argue that the medium term trend has reversed and will turn outlook bearish for deeper fall.
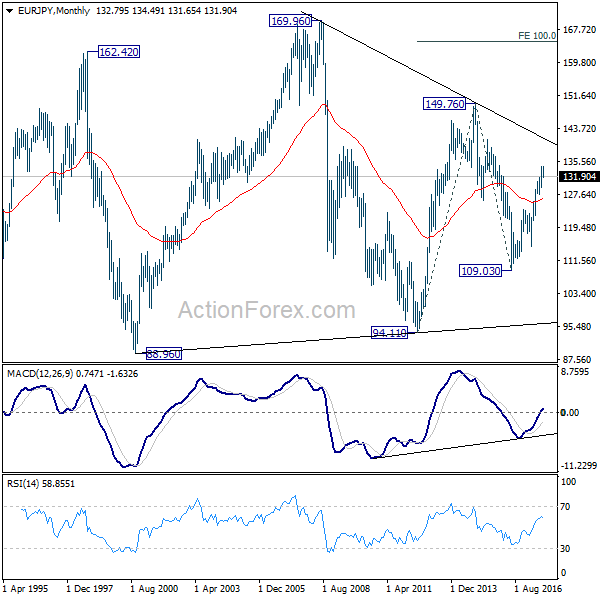
In the long term picture, at this point, there is no clear indication that rise from 109.03 is resuming that from 94.11. Hence, we'd be cautious on topping below 149.76 to extend range trading. Nonetheless, firm break of 149.76 will indicates strong underlying buying. In such case, EUR/JPY will target 100% projection of 94.11 to 149.76 from 109.03 at 164.68.
EUR/GBP Weekly Outlook
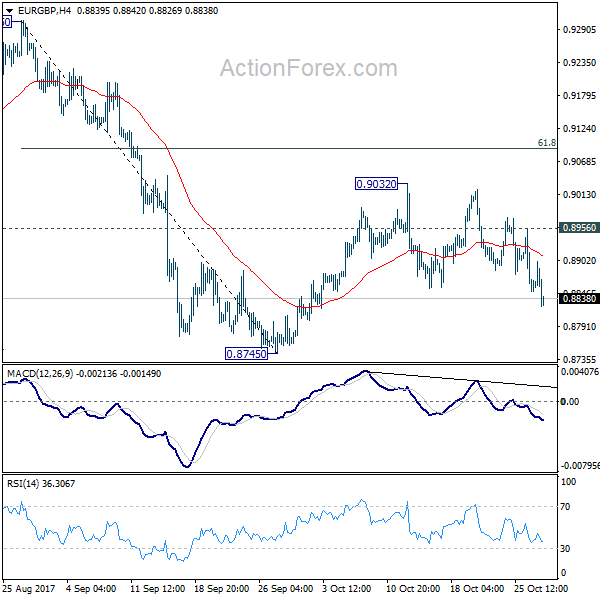
EUR/GBP's fall last week argues that recovery from 0.8745 has completed at 0.9032 already. Initial bias remains mildly on the downside this week for retesting 0.8745 first. Break there will resume whole fall from 0.9305 and target 0.8303 key support level. On the upside, above 0.8956 minor resistance will extend the corrective rise from 0.8745 with another rise. But upside should be limited by 61.8% retracement of 0.9305 to 0.8745 at 0.9091 to bring fall resumption eventually.
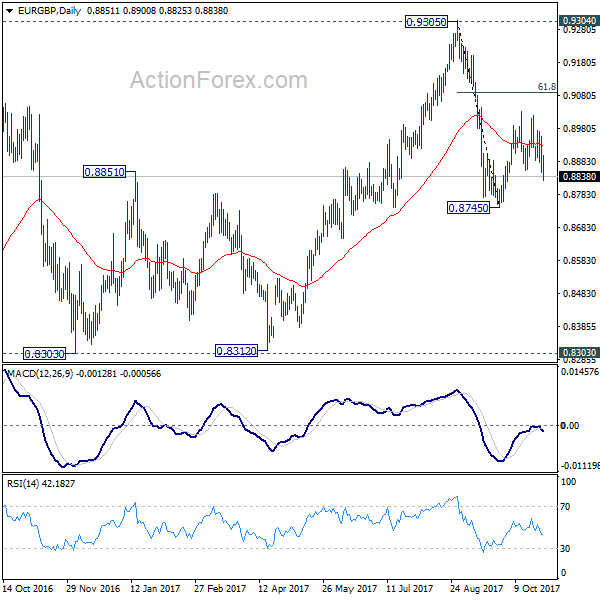
In the bigger picture, there are various ways to interpret price actions from 0.9304 high. But after all, firm break of 0.9304/5 is needed to confirm up trend resumption. Otherwise, range trading will continue with risk of another fall. And in that case, EUR/GBP could have a retest on 0.8303. But we'd expect strong support from 0.8116 cluster support (50% retracement of 0.6935 to 0.9304 at 0.8120) to contain downside.
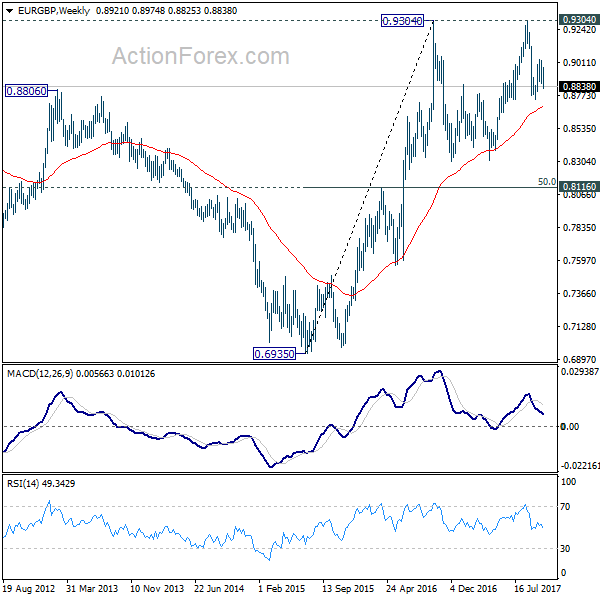
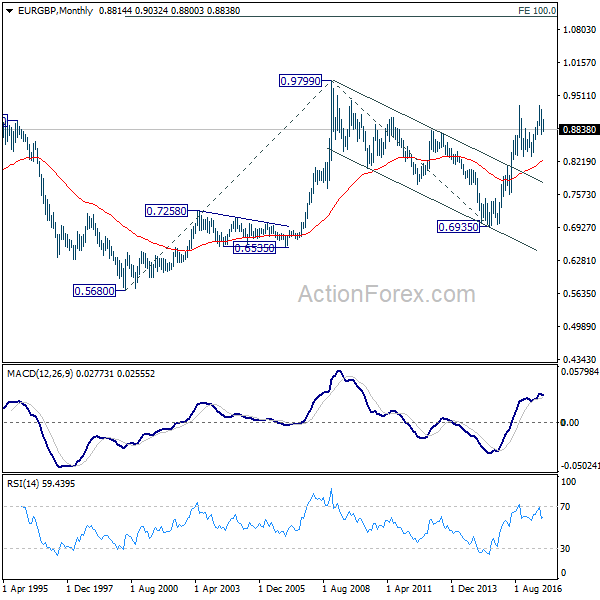
In the long term picture, firstly, price action from 0.9799 (2008 high) is seen as a long term corrective pattern and should have completed at 0.6935 (2015 low). Secondly, rise from 0.6935 is likely resuming up trend from 0.5680 (2000 low). Thirdly, this is supported by the impulsive structure of the rise from 0.6935 to 0.9304. Hence, after the correction from 0.9304 completes, we'd expect another medium term up trend through 0.9799 to 100% projection of 0.5680 to 0.9799 from 0.6935 at 1.1054.
EUR/AUD Weekly Outlook
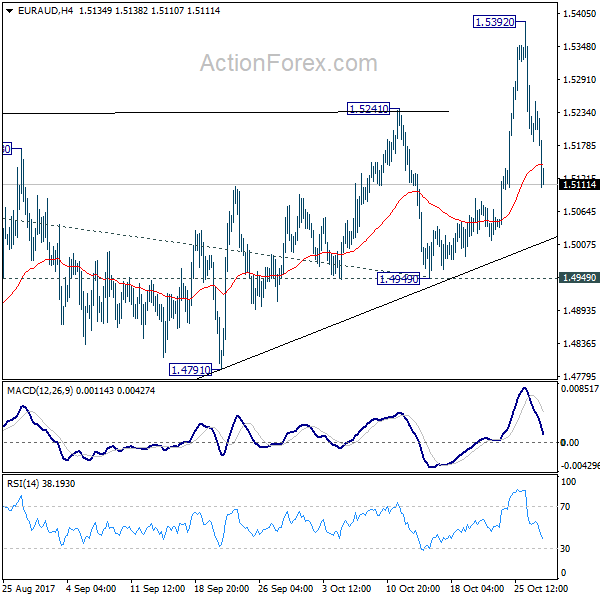
EUR/AUD broke out of medium term range and jumped to as high as 1.5319 last week. However, the cross reversed and dropped sharply since then. Initial bias is neutral this week. first. As long as 1.4949 support holds, further rally is still in favor. Break of 1.5392 will resume medium term rise from 1.3624 and target 61.8% projection of 1.3624 to 1.5226 from 1.4949 at 1.5939 first. However, decisive break of 1.4949 will carry larger bearish implication and turn bias to the downside.
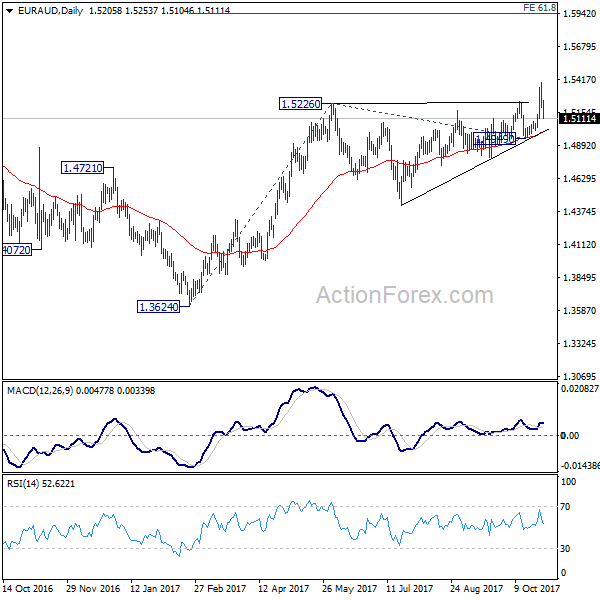
In the bigger picture, we're holding on to the view that corrective decline from 1.6587 medium term top has completed at 1.3624. Rise from 1.3624 is expected to extend to retest 1.6587. However, break of 1.4949 support will dampen our view and argue that rise from 1.3624 has completed. In that case, EUR/AUD would turn southward for retesting 1.3624 low.
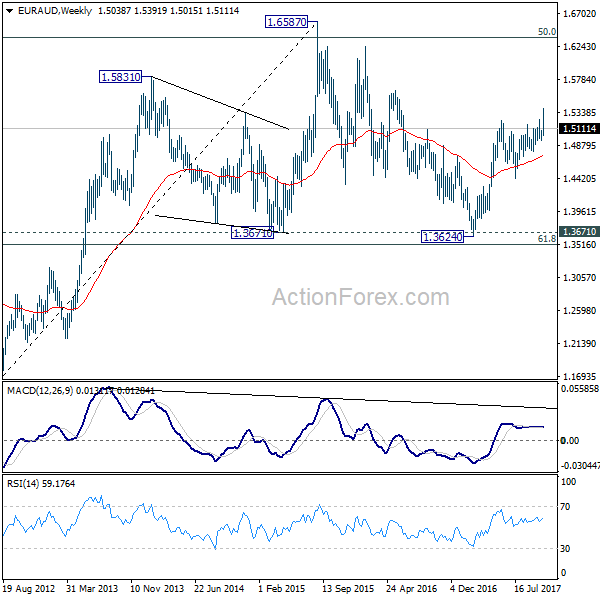
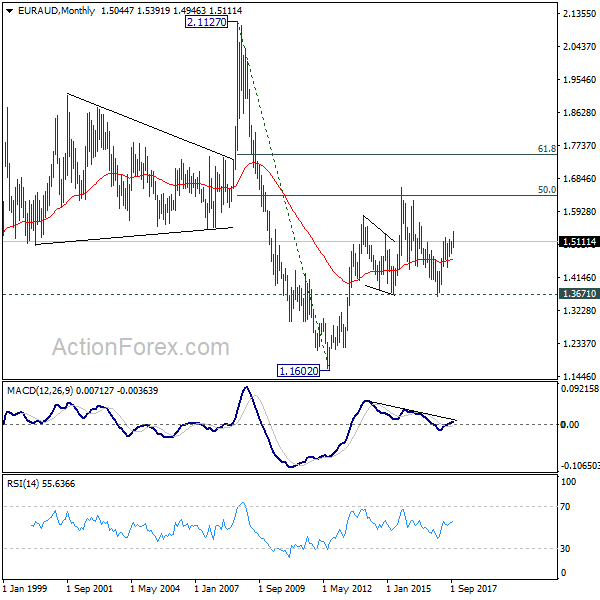
In the longer term picture, the rise from 1.1602 long term bottom isn't over yet. We'll keep monitoring the development but there is prospect of extending the rise to 61.8% retracement of 2.1127 to 1.1602 at 1.7488 and above. However, sustained trading below 1.3671 should confirm trend reversal and target 1.1602 long term bottom again.
EUR/CHF Weekly Outlook
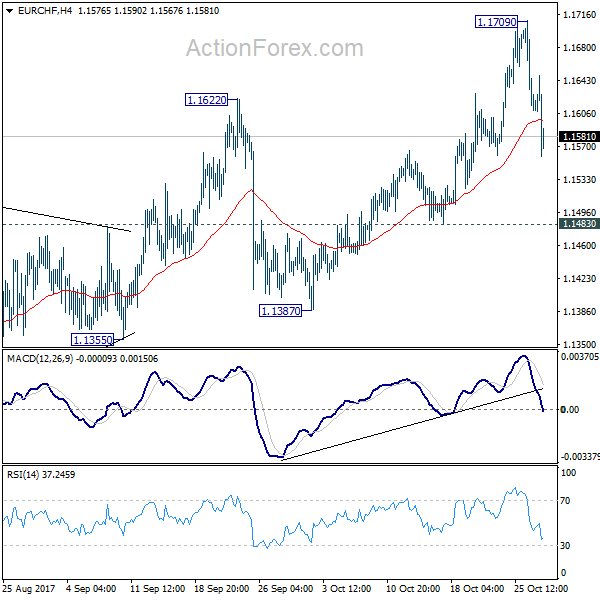
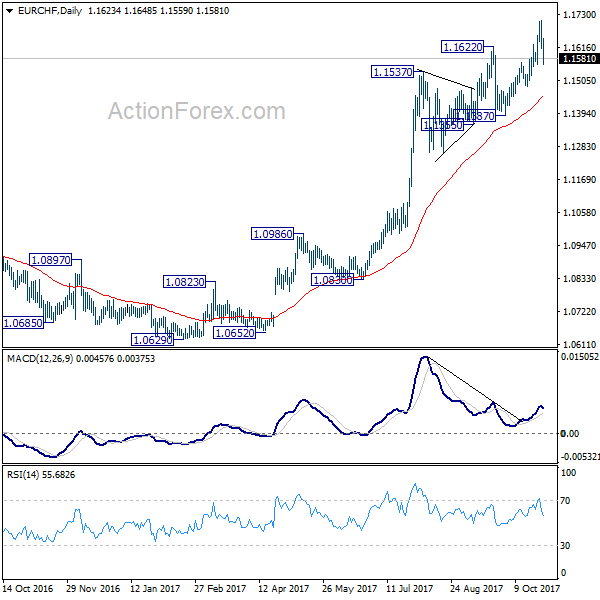
EUR/CHF jumped to as high as 1.1709 last week but dropped sharply since then. Initial bias is neutral this week first. As long as 1.1483 minor support holds, we'd expect further rally ahead. Break of 1.1709 will target 1.2 key level. However, break of 1.1483 will be an early sign of reversal. In that case, deeper decline should be seen back to 1.1355 support.
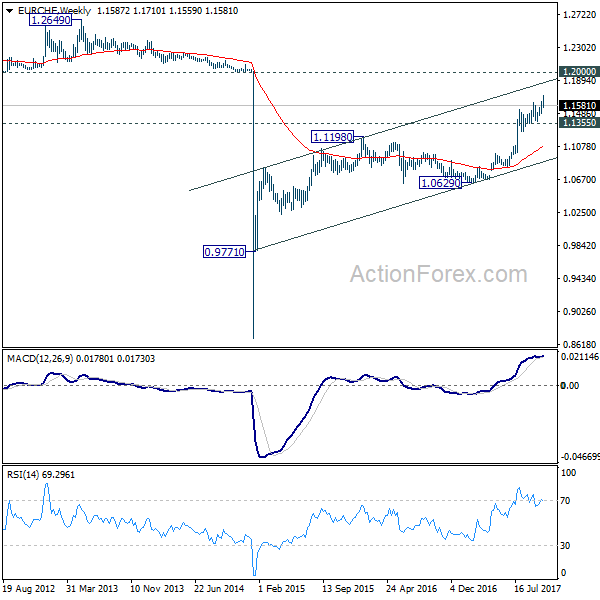
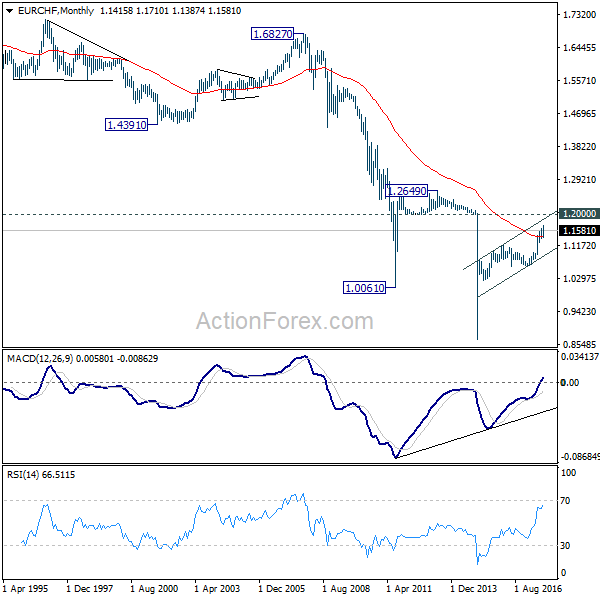
In the bigger picture, long term rise from SNB spike low back in 2015 is still in progress. EUR/CHF should now be heading back to prior SNB imposed floor at 1.2000. For now, this will be the favored case as long as 1.1355 support holds. However, break of 1.1355 will indicate medium term topping. In that case, EUR/CHF should head back to 55 week EMA (now at 1.1067) and possibly below.
Dollar to Look to Non-Farn Payroll to Solidify Momentum for Bullish Reversal
Dollar closed broadly higher last week, and closed as the strongest as boosted by a couple of factors. Firstly, House approved Senate's version of budget blueprint, and cleared an important procedural step for getting the tax cuts done by the end of the year. Secondly, markets responded positively to news that Fed chair Janet Yellen is out of the race for a renewal. Instead, Fed Governor Jerome Powell and Stanford University economist John Taylor are now the front runners. Powell is reported to be slightly more favored by US President Donald Trump and is seen as a less hawkish candidate. But after all, there is still a possibility of Powell/Taylor combination for chair/vice of Fed. And either one seems to be more welcomed by the markets than Yellen. Thirdly, Q3 GDP came in at an impressive 3% annualized growth, despite the impacts of hurricanes.
Dollar, yields and stocks took the news positively. Dollar index's strong break of 94.14 key resistance now confirm medium term reversal. 10 year yield broke 2.396 key resistance decisively and it's taken as a sign of medium term up trend resumption. Meanwhile, DOW, S&P 500 and NASDAQ all hit records highs last week, with late strengths seen in the latter two. Nonetheless, the late rebound in bonds after Catalonia declared independence could cloud the outlook initially this week. In particular, the pull back in yield also supported Japanese Yen, which closed as the second strongest. And that kept USD/JPY below 114.49 key resistance.
Euro weighed down by ECB and Catalonia
Euro, on the other hand, suffered deep selling after ECB policy decision. And it closed as the second weakest ECB announced to half monthly asset purchase to EUR 30b start January, and extends the program by 9 months to end of September 2018. That was indeed in line with consensus. But Euro bulls were unhappy that ECB left the options open for extending and even expanding the asset purchase program again. Stocks, on the other hand, responded positively with German DAX hitting new record high while French CAC 40 hit the highest since 2008. However, Catalonia's declaration of independence dragged Euro further lower before weekly close. We might see European markets in risk averse mode in initial trading this week.
Aussie and Canadian Dollar suffered deep selling
Commodity currencies ended generally lower, with Aussie as the weakest and Canadian Dollar as the third weakest. Australia CPI came in below market expectations and basically ruled out the chance for any RBA rate hike in near term. Meanwhile, BoC gave the markets a rather cautious statement after leaving interest rates unchanged. BoC noted that "Governing Council will be cautious in making future adjustments to the policy rate". Nonetheless, some support is seen for the Loonie as WTI crude oil surged to close at 54.19, setting the stage for testing 55.24 key resistance. There is room for Canadian Dollar to recover this week.
BoJ, Fed, and BoE to meet, non-farm payroll a highlight
Looking ahead, BoJ, Fed and BoE will meet this week. The key focus in on BoE rate hike and vote split. Sterling has been very resilient because of expectation of a 25bps rate hike by BoE. And that was supported by the above expectation 0.4% GDP growth in Q3 released last week. However, the Pound could suffered some steep selling if what BoE delivers this week is seen as a dovish high. Also, it's Super Thursday time and BoE's quarterly inflation report will also be closely watched.
Dollar, on the other hand, will look into a string of key economic data, in particular October non-farm payroll. Strong NFP number and wage growth will bolster the case for December Fed hike. And more importantly, Fed is projection three more hikes next year, WITHOUT tax cuts taken into consideration. Solid growth data, come back of inflation, and positive news on tax cuts in the upcoming weeks solidify the cases for Fed.
Dollar index confirmed medium term reversal
Technically, Dollar index's strong break of 94.14/26 resistance zone confirms medium term reversal on bullish convergence condition in daily MACD. That also came after drawing support from 91.91/93 key long term support (38.2% retracement of 72.69, 2011 low, to 103.82, 2016 high). It's too early to take about long term up trend resumption. But even if rise from 91.01 is the second leg of the corrective pattern from 103.82, further rebound would now be seen back to 61.8% retracement of 103.82 to 91.01 at 98.92 and above. This will be the favored case as long as 93.47 near term support holds.
10 year yield resuming medium term up trend
Dollar's rally was accompanied by sharp rally in 10 year yield too. TNX finally took out 2.396 key resistance decisively last week. That should confirm that correction from 2.621 has completed at 2.034 already. It's now very likely that medium term rise from 1.336 is resuming. Near term outlook stays bullish as long as 2..273 support holds. TNX should target a test on 2.621 key resistance first. Break will confirm our bullish view and target 61.8% projection of 1.336 to 2.621 from 2.034 at 2.827. Such development would help lift Dollar.
Trading strategy
Regarding trading strategy, our CAD/JPY long (bought at 89.90) was stopped out at 88.50 last week. More dovish than expected BoC statement was a favor. And Catalonia independence was another factor. We'll stay away from CAD/JPY first.
Meanwhile, we bought USD/JPY at 114.50 at open last week. 114.49 key resistance is so far proving to be strong. Nonetheless, there is no change in our bullish view on Dollar and yield. Hence, we'll stay long in USD/JPY with a stop at 112.50.
AUD/USD Weekly Outlook
AUD/USD's decline from 0.8124 resumed last week by taking out 0.7732 already. A temporary low is formed at 0.7624 after hitting 0.7628 fibonacci level. Initial bias is neutral this week for consolidations first. But upside of recovery should be limited well below 0.7896 resistance to bring fall resumption. Firm break of 0.7624 will target next key cluster level at 0.7322/8.
In the bigger picture, corrective rise from 0.6826 medium term bottom is likely completed at 0.8124, after hitting 55 month EMA (now at 0.8067). Decisive break of 0.7328 key cluster support (61.8% retracement 0.6826 to 0.8124 at 0.7322) will confirm. And in that case, long term down trend from 1.1079 (2011 high) will likely be resuming. Break of 0.6826 will target 61.8% projection of 1.1079 to 0.6826 from 0.8124 at 0.5496. This will now be the favored case as long as 0.7896 near term resistance holds.
In the longer term picture, 0.6826 is seen as a long term bottom. Rise from there could either reverse the down trend from 1.1079, or just develop into a corrective pattern. At this point, we're favoring the latter. And, as long as 38.2% retracement of 1.1079 to 0.6826 at 0.8451 holds, we'd anticipate another decline through 0.6826 at a later stage. But strong support should be seen between 0.4773 (2001 low) and 0.6008 (2008 low).
Summary 10/30 – 11/3
Monday, Oct 30, 2017
[php_everywhere] [/php_everywhere]
Tuesday, Oct 31, 2017
[php_everywhere] [/php_everywhere]
Wednesday, Nov 1, 2017
[php_everywhere] [/php_everywhere]
Thursday, Nov 2, 2017
[php_everywhere] [/php_everywhere]
Friday, Nov 3, 2017
[php_everywhere] [/php_everywhere].