Sample Category Title
Daily Wave Analysis: EUR/USD Bullish 38.2% Retracement To 1.1650 Within Downtrend
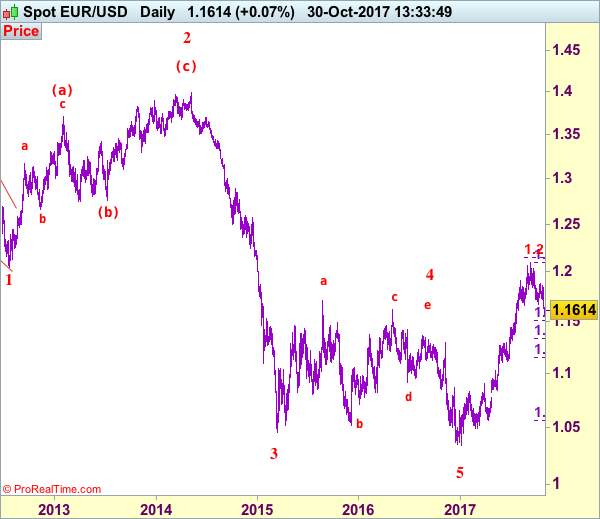
Currency pair EUR/USD
The EUR/USD broke below the support trend line and zone (dotted blue) yesterday and has space to continue towards the 38.2% Fib of wave 4 vs 3 (light purple). A bullish correction within wave 4 (blue) should take price back to the 23.6%-50% Fibonacci levels, which could act as a resistance zone.
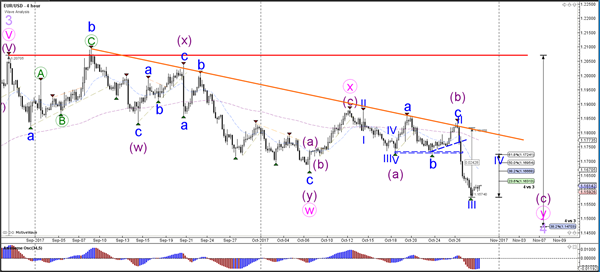
The EUR/USD is showing strong bearish momentum and has most likely completed a wave 3 (blue). An ABC (green) could be unfolding within the wave 4 (blue).
Currency pair GBP/USD
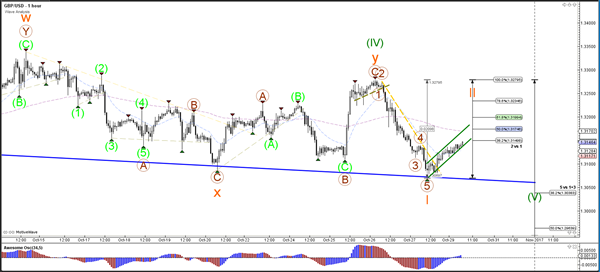
The GBP/USD remains choppy but a wave 5 (green) still seems most likely due to the wave bearish impulse. A break below the support line (blue) would confirm a bearish continuation.
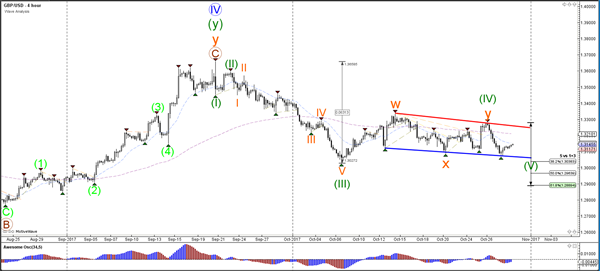
The GBP/USD bearish momentum is probably a wave 1 (orange) which could see a bounce and a retracement for a wave 2 (orange).
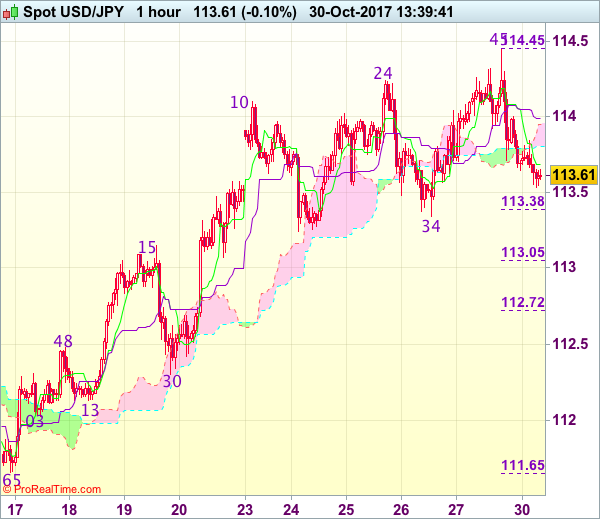
Currency pair USD/JPY
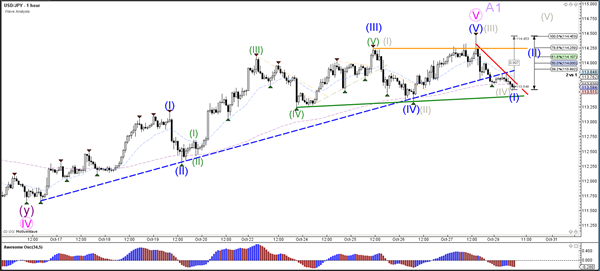
The USD/JPY has reached the main target zone at 114.50-115, but a break below the support trend line (green) is needed before a larger wave 2 or B (light purple) becomes more likely.
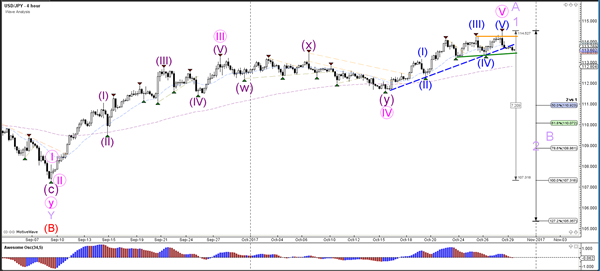
The USD/JPY is either in a wave 1-2 (blue) or in an ending diagonal (grey).
Euro Recovers Mildly in Steady Market, No Escalation in Catalonia
The forex markets opened the week rather steadily. Euro recovers mildly as there was no escalation in Catalonia tension. sacked regional president Carles Puigdemont remained calm and called for peaceful "democratic opposition" the Madrid's takeover. Dollar pares back some more of recent gains as markets await an eventful week. It's repeatedly reported that US President Donald Trump favors Fed Governor Jerome Powell for the job of Fed Chair after Janet Yellen's term expires early next year. And Powell is seen as sone one who will speed up the pace of tightening. But it's far from being certain as some unnamed persons close to Trump were quote saying he changes his minds everyday.
Meanwhile, it's reported in Japan over the weekend that BoJ Governor Haruhiko Kuroda remains the leading candidate to renew his term next year. Prime Minister Shinzo Abe's has already took renewed mandate on his Abenomics after recent landslide victory in the snap election. And no matter who will take the job of BoJ Governor, the ultra loose monetary policies will continue. Elsewhere, commodity currencies remain the weakest ones and will release need some strong economic data to give them support for rebound.
A busy week ahead with BoJ, Fed, BoE and NFP featured
It's a very busy week ahead. Three central banks will meet including BoJ, Fed and BoE.
BoE rate decision will catch most attention as it's widely expected to hike interest rate for the first time in a decade. The Bank Rate would be raised by 25bps to 0.50%. The core question is whether this is a one-off hike. In our view, it will be a one-off as the Bank Rate will be brought back to pre-Brexit referendum level. The impact of the voting decision is largely absorbed by the monetary stimulus as well as depreciation in Sterling. BoE policy makers would be hesitate to make any more move before getting a clearer picture on Brexit. With that in mind, the vote split of the decision is the first key point to watch. The tighter the decision, the more unlikely for another hike in near term. In addition, BoE will release the quarterly inflation report. Revision in inflation projection there will tell us how policymakers general feel about the recent surge in inflation.
FOMC meeting is possibly a non-event this week. Fed is widely expected to hike interest rates again in December. Fed fund futures are pricing in 97.8% chance for a 25bps hike to 1.25-1.50% in December. There is practically no chance for a change this week. The accompanying statement will be watched but shouldn't contain any surprise. Markets' focus will likely be more on news regarding the next Fed chair, Jerome Powell or John Taylor? Tax cuts, and economic data like ISM indices and non-farm payroll are the more important ones to watch.
BoJ will also keep monetary policies unchanged this week. The focus is on whether the central bank will downgrade inflation projections again.
On the data front, US data like ISMs and NFP will be the key to watch. Dollar was the strongest one last week as tax cut hopes and strong data bolster the case for December hike. Fed policymakers are projecting three more hikes next year but will need favorable data and developments to solidify the case. Sterling was also strong despite slow progress in Brexit negotiation. The Pound will also look into PMIs to be released this week. Eurozone will release GDP and CPI but that's unlikely to help the Euro after the dovish reactions to ECB last week. Meanwhile, commodity currencies will look into their own data for support after steep selloff. Canada GDP, Australia trade balance and retail sales, New Zealand employment, as well as China PMIs will be closely watched.
Here are some highlights for the week ahead:
- Monday: German retail sales, CPI; Swiss KOF leading indicator; UK mortgage approvals, M4; US personal income and spending
- Tuesday: Japan households spending, unemployment rate, industrial production, housing starts, BoJ rate decision; New Zealand building permits; China PMIs; French GDP; Eurozone GDP, unemployment rate, CPI; Canada CDP, IPPI and RMPI; US employment cost, S&P Case Shiller house price, Chicago PMI; consumer confidence
- Wednesday: New Zealand employment; China PMI manufacturing; Swiss PMI manufacturing; UK PMI manufacturing; US ADP employment, ISM manufacturing, construction spending, FOMC rate decision
- Thursday: Japan monetary base, consumer confidence; Australia trade balance, building approvals; Swiss SECO consumer confidence, retail sales; German unemployment; UK construction PMI; BoE rate decision; US jobless claims, non-farm productivity
- Friday: Australia retail sales; UK PMI services; Canada employment, trade balance; US trade balance, non-farm payroll; ISM services, factory orders
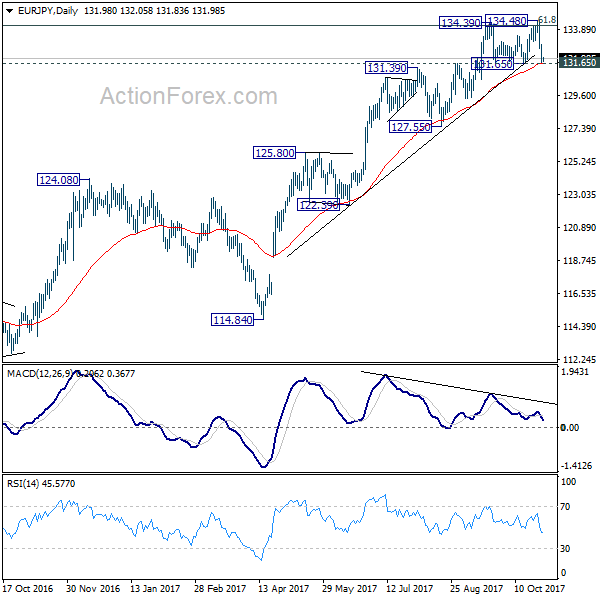
EUR/JPY Daily Outlook
Daily Pivots: (S1) 131.49; (P) 132.22; (R1) 132.68; More...
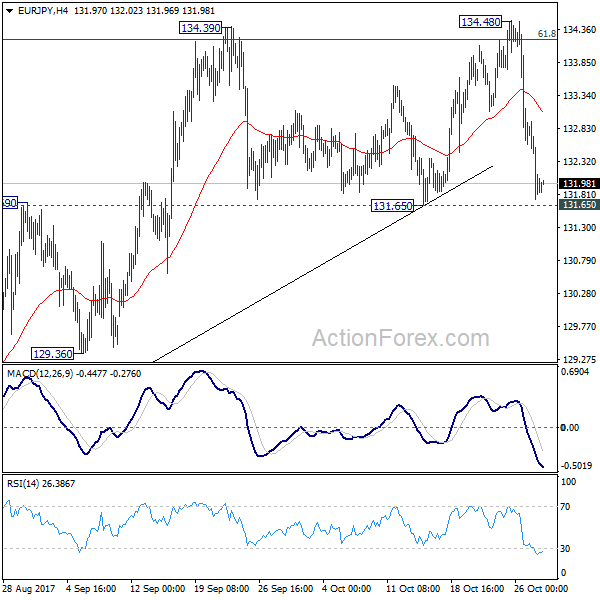
Intraday bias in EUR/JPY remains neutral for the moment with focus on 131.65 key support. Decisive break there will confirm rejection from 134.20 fibonacci level. That will also complete and double top pattern (134.39, 134.48) and confirms near term reversal. 55 day EMA will also be firmly taken out. In that case, deeper decline should be seen back to 127.55 key support. On the upside, decisive break of 134.39/48 resistance zone is needed to confirm up trend resumption. Otherwise, even in case of rebound, near term outlook is neutral at best.
In the bigger picture, medium term rise from 109.03 (2016 low) is seen as at the same degree as the down trend from 149.76 (2014 high) to 109.03 (2016 low). 61.8% retracement of 149.76 to 109.03 at 134.20 is already met. Sustained break there will pave the way to key long term resistance zone at 141.04/149.76. However, break of 127.55 support will argue that the medium term trend has reversed and will turn outlook bearish for deeper fall back to 114.84/124.08 support zone at least.
Economic Indicators Update
| GMT | Ccy | Events | Actual | Forecast | Previous | Revised |
|---|---|---|---|---|---|---|
| 23:50 | JPY | Retail Trade Y/Y Sep | 2.20% | 2.30% | 1.70% | 1.80% |
| 07:00 | EUR | German Retail Sales M/M Sep | 0.50% | -0.40% | ||
| 08:00 | CHF | KOF Leading Indicator Oct | 106.5 | 105.8 | ||
| 09:30 | GBP | Mortgage Approvals Sep | 66.0K | 66.6K | ||
| 09:30 | GBP | M4 Money Supply M/M Sep | 0.70% | 0.90% | ||
| 10:00 | EUR | Eurozone Economic Confidence Oct | 113.3 | 113 | ||
| 10:00 | EUR | Eurozone Business Climate Indicator Oct | 1.4 | 1.34 | ||
| 10:00 | EUR | Eurozone Industrial Confidence Oct | 7.1 | 6.6 | ||
| 10:00 | EUR | Eurozone Services Confidence Oct | 15 | 15.3 | ||
| 10:00 | EUR | Eurozone Consumer Confidence Oct F | -1 | -1 | ||
| 12:30 | USD | Personal Income Sep | 0.40% | 0.20% | ||
| 12:30 | USD | Personal Spending Sep | 0.90% | 0.10% | ||
| 12:30 | USD | PCE Deflator M/M Sep | 0.40% | 0.20% | ||
| 12:30 | USD | PCE Deflator Y/Y Sep | 1.60% | 1.40% | ||
| 12:30 | USD | PCE Core M/M Sep | 0.10% | 0.10% | ||
| 12:30 | USD | PCE Core Y/Y Sep | 1.30% | 1.30% | ||
| 13:00 | EUR | German CPI M/M Oct P | 0.10% | 0.10% | ||
| 13:00 | EUR | German CPI Y/Y Oct P | 1.70% | 1.80% |
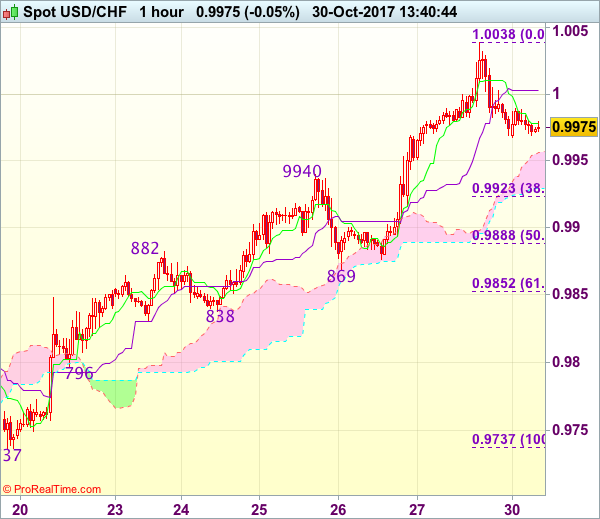
Trade Idea : USD/CHF – Buy at 0.9920
USD/CHF - 0.9972
Most recent candlesticks pattern : N/A
Trend : Up
Tenkan-Sen level : 0.9978
Kijun-Sen level : 1.0003
Ichimoku cloud top : 0.9956
Ichimoku cloud bottom : 0.9929
Original strategy :
Buy at 0.9920, Target: 1.0030, Stop: 0.9885
Position : -
Target : -
Stop : -
New strategy :
Buy at 0.9920, Target: 1.0030, Stop: 0.9885
Position : -
Target : -
Stop : -
Dollar’s retreat after rising to 1.0038 on Friday has retained our view that minor consolidation below this level would be seen and pullback to the upper Kumo (now at 0.9956) is likely, below would bring correction to previous resistance at 0.9940, however, reckon 0.9920-25 (38.2% Fibonacci retracement of 0.9737-1.0038) would limit downside and bring another rise, above said resistance at 1.0038 would extend recent rise from 0.9421 low to 1.0050-55, having said that, overbought condition should limit upside to 1.0075-80 and price should falter below 1.0100 resistance and bring retreat later.
In view of this, we are looking to buy dollar again on pullback as 0.9920-25 should limit downside, bring another rise later. Below 0.9885-90 (50% Fibonacci retracement of 0.9737-1.0038) would defer and suggest top is possibly formed, risk test of support at 0.9869.
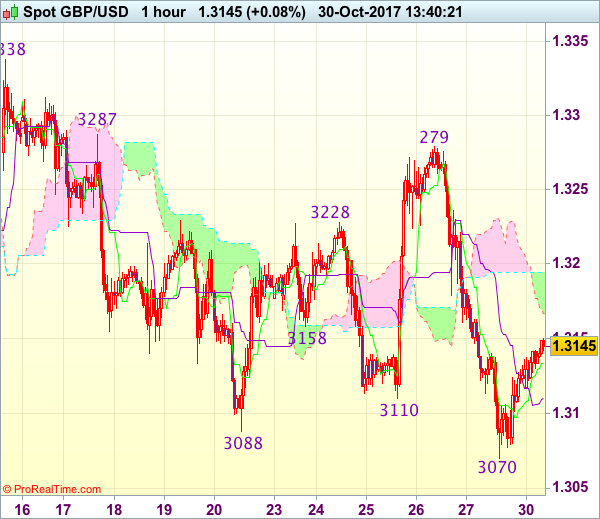
Trade Idea : GBP/USD – Sell at 1.3225
GBP/USD - 1.3146
Most recent candlesticks pattern : N/A
Trend : Near term down
Tenkan-Sen level : 1.3134
Kijun-Sen level : 1.3110
Ichimoku cloud top : 1.3195
Ichimoku cloud bottom : 1.3167
Original strategy :
Sell at 1.3180, Target: 1.3080, Stop: 1.3215
Position : -
Target : -
Stop : -
New strategy :
Sell at 1.3225, Target: 1.3125, Stop: 1.3260
Position : -
Target : -
Stop : -
As cable found support at 1.3070 on Friday and has rebounded, suggesting consolidation above this level would be seen and corrective bounce to 1.3175-80, then 1.3200 cannot be ruled out, however, still reckon upside would be limited to 1.3220-25 and bring another decline later, below 1.3100 would bring test of said support at 1.3070, break there would extend the erratic decline from 1.3338 to 1.3050, then towards recent low at 1.3027.
In view of this, we are looking to sell cable on further subsequent recovery as 1.3220-25 should limit upside. Above 1.3250 would dampen this bearish view and prolong consolidation, risk rebound to resistance at 1.3279-87 first.
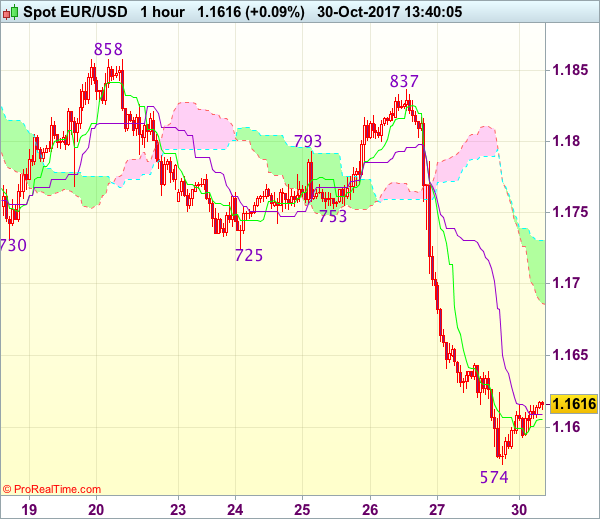
Trade Idea : EUR/USD – Sell at 1.1685
EUR/USD - 1.1616
Most recent candlesticks pattern : N/A
Trend : Down
Tenkan-Sen level : 1.1606
Kijun-Sen level : 1.1609
Ichimoku cloud top : 1.1731
Ichimoku cloud bottom : 1.1686
Original strategy :
Sell at 1.1685, Target: 1.1585, Stop: 1.1720
Position : -
Target : -
Stop : -
New strategy :
Sell at 1.1685, Target: 1.1585, Stop: 1.1720
Position : -
Target : -
Stop : -
As the single currency recovered after falling to 1.1574 on Friday, suggesting consolidation above this level would be seen and corrective bounce to 1.1645-50 cannot be ruled out, however, reckon upside would be limited to the lower Kumo (now at 1.1686) and bring another decline later, below said support at 1.1574 would extend recent decline from 1.2093 top to 1.1550-55 but loss of downward momentum should prevent sharp fall below 1.1520-25 and reckon 1.1500 would hold from here.
In view of this, we are looking to sell euro on subsequent recovery as the lower Kumo (now at 1.1686) should limit upside and bring another decline. Only above previous support at 1.1725 (now resistance) would signal low is formed instead, bring retracement of recent decline to 1.1750-55 first.
Trade Idea : USD/JPY – Sell at 114.20
USD/JPY - 113.63
Most recent candlesticks pattern : N/A
Trend : Near term up
Tenkan-Sen level : 113.69
Kijun-Sen level : 113.99
Ichimoku cloud top : 113.95
Ichimoku cloud bottom : 113.80
New strategy :
Sell at 114.20, Target: 113.20, Stop: 114.55
Position : -
Target : -
Stop : -
Dollar’s retreat after Friday’s brief rise to 114.45 suggests consolidation below this level would be seen and weakness to 113.34-38 (previous support and 38.2% Fibonacci retracement of 111.65-114.45), break there would add credence to our view that top has possibly been formed, bring correction of recent rise to 113.05-15 (50% Fibonacci retracement and previous resistance), however, reckon 112.70-75 (61.8% Fibonacci retracement) would remain intact, bring another rise later.
In view of this, we are looking to sell dollar on recovery as 114.20-25 should limit upside, bring another retreat. Above indicated resistance at 114.45-50 would extend recent rise from 107.32 low for further gain to 114.75-80 (61.8% projection of 111.65-114.10 measuring from 113.24), however, overbought condition should limit upside to 115.00 and risk from there is seen for a retreat later.
EUR/USD Elliott Wave Analysis
EUR/USD – 1.1614
EUR/USD: Wave (c) of 2 ended at 1.3993 and wave 3 of III has commenced for weakness to 1.0411 (1.236 of wave 1), then 1.0000.
The single currency met renewed selling interest at 1.1837 last week and has dropped below indicated previous support at 1.1662-69 (now resistance), dampening our bullishness and suggesting a temporary top has been made at 1.2093 earlier, hence bearishness is seen for the erratic fall from there to bring retracement of recent rise to 1.1550-60, then 1.1510-15 (38.2% Fibonacci retracement of 1.0570-1.2093) but reckon downside would be limited to support at 1.1479 and 1.1330-35 (50% Fibonacci retracement) should remain intact, bring rebound later.
Our preferred count on the daily chart remains that a wave (II) from 1.2329 ended at 1.5145 with A-leg ended at 1.4720, followed by wave B at 1.2457, the wave C from there was also a 3 legged move and is labeled as (a): 1.3739, (b): 1.2885, the wave iii of the 5-waver (c) from 1.2885 has ended at 1.4339 and wave iv is a triangle ended at 1.3878 and wave v formed a top at 1.5145. The decline from there is a 5-waver (C) with minor wave (i) of I of (C) ended at 1.4218 with wave (ii) ended at 1.4580, wave (iii) ended at 1.3267 and wave (iv) ended at 1.3692 and wave (v) ended at 1.1876, this is also the low of wave I of (C) and wave II ended at 1.4940, hence wave III is now in progress with a diagonal wave 1 ended at 1.2042, the breach of previous support at 1.1876 (wave I trough) adds credence to our view that the wave 2 has ended at 1.3993, wave 3 has commenced for further weakness to 1.0411, then towards 1.0000.
On the upside, although initial recovery back to previous support at 1.1662-69 cannot be ruled out, reckon another previous support at 1.1725 would hold and bring another decline later. A daily close above this level would defer and suggest low is possibly formed instead, bring rebound to 1.1790-00 but break of said resistance at 1.1837 is needed to confirm and bring test of key resistance at 1.1880. Looking ahead, only break of 1.1880 resistance would suggest the pullback from 1.2093 has ended, bring further gain to 1.1950-60, then towards 1.2000-05. A break of resistance at 1.2034 would confirm and bring retest of 1.2093, break there would signal recent upmove from 1.0340 low has resumed for headway to 1.2150-55 (61.8% projection of 1.1119-1.1910 measuring from 1.1662), having said that, loss of upward momentum should prevent sharp move beyond 1.2200-10 and price should falter below 1.2255-60, risk from there remains for a much-needed correction to take place later.
Recommendation: Sell at 1.1665 for 1.1465 with stop above 1.1765.
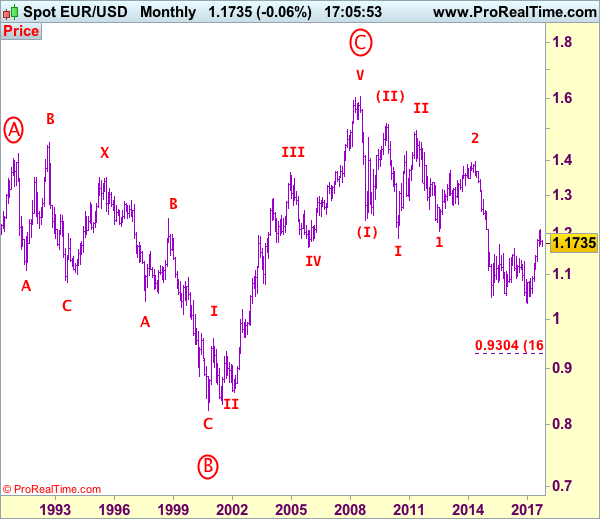
Euro's long-term uptrend started from 0.8228 (26 Oct 2000) with an impulsive structure. The rise from 0.8228 to 0.9593 (5 Jan 2001) is labeled as wave I, the retreat to 0.8352 (6 Jul 2001) is wave II and the rally to 1.3670 (31 Dec 2004) is wave III. Wave IV from there ended at 1.1640 (15 Nov 2005), the subsequent upmove to 1.6040 (July 15, 2008) is treated as wave V, the major selloff from the record high of 1.6040 to 1.2329 (October 27, 2008) signals a reversal has taken place with (I) leg ended at 1.2329 and once (II) ended at 1.5145, wave (III) itself is an extended move with I: 1.1876 and complex wave II ended at 1.4902, wave III has commenced with wave 1 and 2 ended at 1.2042 and 1.3993 respectively, wave 3 of III is now unfolding for weakness towards parity.
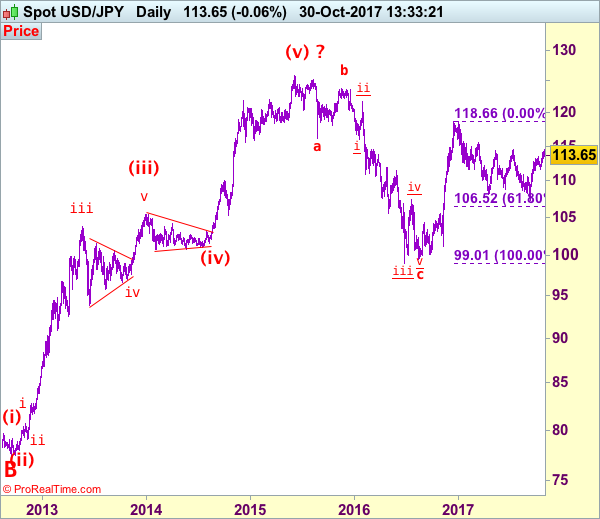
USD/JPY Elliott Wave Analysis
USD/JPY - 113.69
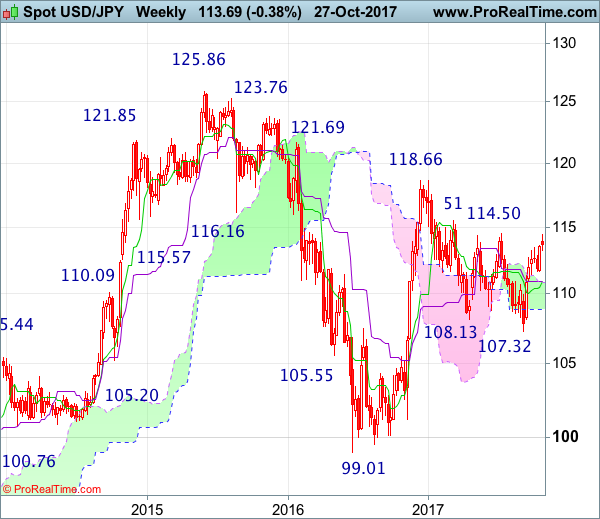
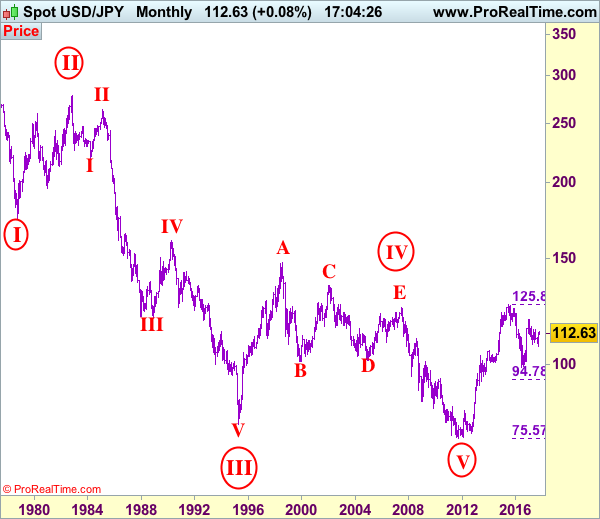
USD/JPY – Wave V of larger degree circle V has possibly ended at 75.31 and major correction has commenced and already met indicated target at 125.00.
Although the greenback edged higher to 114.45, as price has retreated after failing to test indicated previous resistance at 114.50, suggesting consolidation below this level would be seen and pullback to 113.00 and 112.50-60 is likely, however, reckon downside would be limited to 112.00 and renewed buying interest should emerge around previous support at 111.65 and bring another rise later. Above said resistance at 114.45-50 would signal the correction from 118.66 top has ended earlier at 107.32 and the rise from there may extend further gain to 115.00, then previous resistance at 115.51. Looking ahead, a sustained breach above this level at 115.51 would retain bullishness, then further subsequent gain to 116.00-10 and possibly 116.50-60 would follow.
Our preferred count is that, triangle wave IV (with circle) ended at 101.45 and the circle wave V brought dollar down to the record low of 75.31 in 2011 and the subsequent rebound signal major correction has commenced with A leg ended at 84.19, followed by wave B at 77.14 and impulsive wave C is now unfolding (indicated upside target at 125.00 had been met) for gain towards 127.00 level. In the event dollar drops below support at 99.01, this would confirm medium term decline from 125.86 top (2015 high) has resumed for subsequent weakness to 98.00 and possibly 97.00.
Under this count, this wave C is unfolding as impulsive waves with (1) (2), 1 2 ended at 80.67, 79.07, 82.84 and 81.69 respectively, hence the extended wave 3 has ended at 103.74 and wave 4 correction of recent upmove should bring weakness to 92.57, then towards 90.88 but psychological support at 90.00 should limit downside and bring another rally later in wave 5, indicated target at 125.00 had been met and gain to 127.00 cannot be ruled out but reckon price would falter below 130.00.
On the downside, whilst initial pullback to 113.00-10 cannot be ruled out, reckon downside would be limited to 112.50-60 and 112.00 would contain downside, renewed buying interest should emerge above support at 111.65 and bring another rise later. Only a drop below said support at 111.65 would suggest a temporary top is formed instead, bring weakness to 111.00 but downside should be limited to 110.40-50 and support at 109.55 should remain intact. A breach of strong support at 109.55 would abort and suggest the rebound from 107.32 has ended instead, risk weakness to 109.00 and possibly 108.50-60 but price should stay well above said support at 107.32 and bring another rebound later.
Recommendation: Buy at 111.80 for 114.00 with stop below 110.80.
On the monthly chart, we have changed our preferred count that an impulsive wave is unfolding with major wave III with circle ended at 79.75, then followed by wave IV with circle and is labeled as a triangle with A: 147.64 (11 August, 1998), B: 101.25, C: 135.20, D: 101.67 and E leg ended at 124.14 to end the wave IV with circle. Hence, wave V with circle commenced from there and hit a record low of 75.31, however, the subsequent strong rebound signals this circle wave V has possibly ended there, hence gain to (indicated upside target at 122.00 and 125.00 had been met), the retreat from 125.86 suggests wave A of major correction has ended there and wave B correction back to 99.00, then 95.00 would be seen, however, reckon downside would be limited to 90.00, bring another rebound in wave C next year.
EUR/USD Candlesticks and Ichimoku Analysis
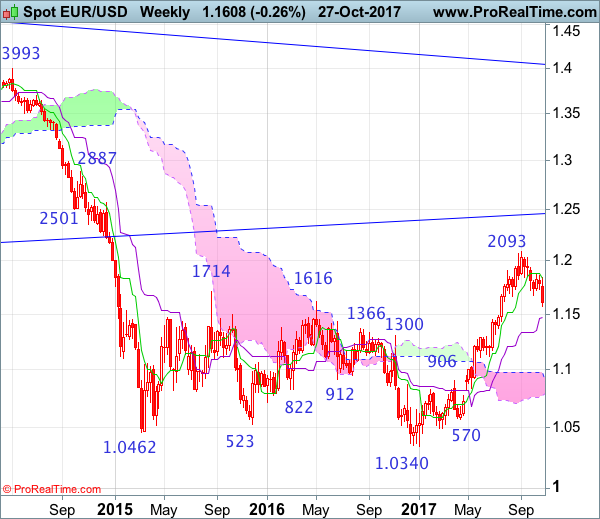
Weekly
• Last Candlesticks pattern: Shooting star
• Time of formation: 31 Jul 2017
• Trend bias: Near term up
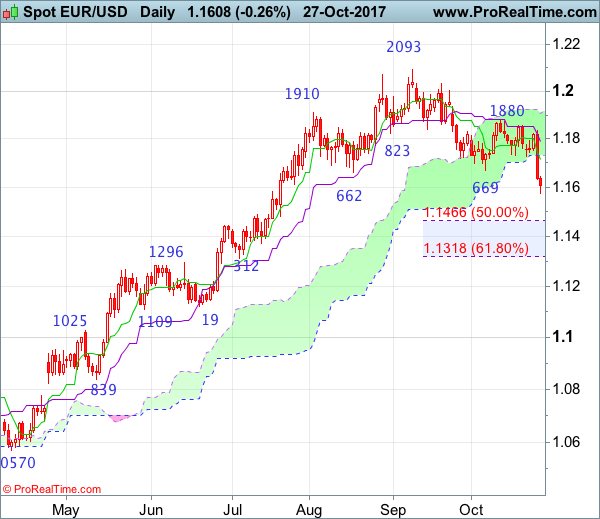
Daily
• Last Candlesticks pattern: Shooting star
• Time of formation: 2 Aug 2017
• Trend bias: Up
EUR/USD – 1.1613
Despite last week’s initial rebound, the single currency ran into renewed selling interest at 1.1837 and dropped below previous support at 1.1662 late last week, dampening our bullishness and signal early upmove has formed a top at 1.2093, hence consolidation with downside bias is seen for the erratic fall from there to bring retracement of recent upmove to 1.1550, then 1.1500, however, near term oversold condition should limit downside to 1.1465-66 (50% Fibonacci retracement of 1.0839-1.2093) and reckon 1.1370 support would hold and price should stay above 1.1312-18 (previous support and 61.8% Fibonacci retracement).
On the upside, whilst an initial recovery back to previous support at 1.1669 (now resistance) cannot be ruled out, reckon 1.1700 would hold and price should falter below 1.1725 (previous minor support) and bring another decline to aforesaid downside targets. Only above the Kijun-Sen (now at 1.1790) would defer and suggest low is possibly formed instead, risk test of resistance at 1.1837 but break there is needed to add credence to this view, bring another bounce to indicated previous resistance at 1.1880 first. Once this level is penetrated, this would signal the fall from 1.2093 has ended, bring test of the upper Kumo (now at 1.1907) first but resistance at 1.2005 should hold.
Recommendation: Sell at 1.1700 for 1.1500 with stop above 1.1800.
On the weekly chart, last week’s selloff formed a black candlestick and the breach of previous support at 1.1662-69 signals a temporary top has been formed at 1.2093, hence consolidation with downside bias is seen for retracement of recent rise to 1.1500, then 1.1466 (current level of the Kijun-Sen and 50% Fibonacci retracement of 1.0839-1.2093), however, reckon downside would be limited to 1.1400 and reckon 1.1312-18 (previous support and 61.8% Fibonacci retracement) would hold, price should stay above previous minor resistance at 1.1296, bring rebound later.
On the upside, expect recovery to be limited to 1.1662-69 (previous support) and renewed selling interest should emerge around (1.1700-10), bring another decline later. Above 1.1790-00 would risk test of said resistance at 1.1837 but only break of this last week’s high would abort and suggest low is formed instead, bring test of resistance at 1.1880 first. Only a break of 1.1880 would suggest the pullback from 1.2093 top has possibly ended and extend gain to 1.1935-40, then towards 1.2035-40. Having said that, break there is needed to provide confirmation, bring retest of 1.2093.
USD/JPY Candlesticks and Ichimoku Analysis
Weekly
• Last Candlesticks pattern: Dark cloud cover
• Time of formation: 10 Jul 2017
• Trend bias: Down
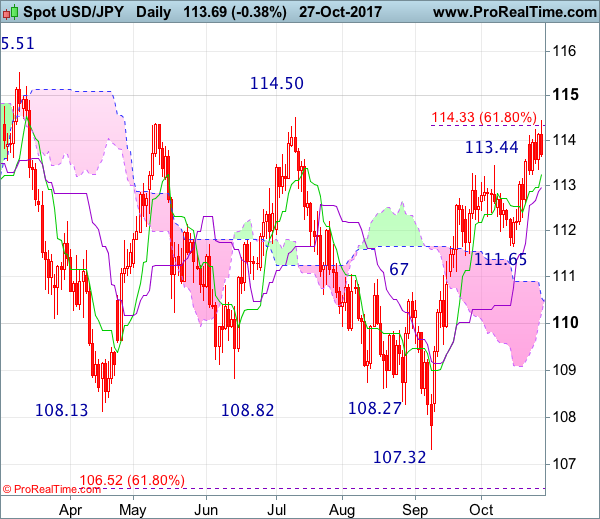
Daily
• Last Candlesticks pattern: Evening doji
• Time of formation: 7 Aug 2017
• Trend bias: Down
USD/JPY – 113.69
Although the greenback resumed recent rise and rose to as high as 114.45 late last week, the subsequent retreat after faltering below indicated previous resistance at 114.50 suggests a week of consolidation below this level would take place and test of the Tenkan-Sen (now at 113.24) is likely, however, a daily close below the Kijun-Sen (now at 112.96) is needed to signal a temporary top has been formed there, bring retracement of recent rise to 112.60, then 112.30 but reckon downside would be limited to 112.00 and previous support at 111.65 should remain intact, bring rebound later.
On the upside, expect recovery to be limited to 114.00 and said last week’s high at 114.45 should remain intact, bring another retreat. A break of said resistance at 114.45-50 would signal early fall from 118.66 has ended at 107.32 and the rise from 107.32 low may extend further gain to 115.50, then previous resistance at 115.51-62, however, loss of momentum should prevent sharp move beyond 116.00-10, risk from there is seen for another retreat later.
Recommendation : Stand aside for this week.
On the weekly chart, after forming a white candlestick the week before, dollar edged higher again last week to 114.45, however, indicated previous resistance at 114.50 continued to cap dollar’s upside and price has retreated, suggesting consolidation below this level would be seen and pullback to 113.00 cannot be ruled out, below there would bring retracement to 112.50-60, then 112.00, however, previous support at 111.65 should hold. Only a drop below this level would signal the rise from 107.32 low has ended there, bring deeper correction to 111.00 but reckon the Kijun-Sen (now at 110.91) would hold on first testing.
On the upside, above said resistance at 114.45-50 would signal the decline from 118.66 top has ended earlier at 107.32, bring further rise to psychological level at 115.00, then test of resistance at 115.51, break there would add credence to this view and encourage for headway to 116.50-60 first, having said that, near term overbought condition should limit upside to 117.00-10, risk from there is seen for another retreat later.