
Sample Category Title
Forex: Eurozone Interest Rates To Increase In 2019?
The Thursday meeting of the European Central Bank kept Eurozone interest rates at record low levels, but finally, announced the long-awaited reduction in quantitative easing. The ECB announced that it will halve its current bond purchase program from EUR 60bn to EUR 30bn a month beginning in January.
The markets were expecting such an announcement as recent data shows strong Eurozone growth in the second half of 2017. ECB President Draghi stated “Our program is flexible enough that we can adjust its size. We can carry through smoothly and that’s been the evidence we have given until now. It’s not going to stop suddenly. It’s never been our view that things should stop suddenly.” Draghi also commented that 0% interest rates could remain at current levels “well past” whenever the ECB decides to end its easing measure. With the tapering likely to be a slow and gradual process, the likelihood of Eurozone interest rates rising in 2018 appear highly unlikely. It is more likely that interest rates will not rise until well into 2019. Following the announcement, the markets sold EUR down to near 3-month lows with the selling momentum continuing overnight seeing EURUSD trade as low as 1.1624.
Data from the US Department of Labor on Thursday continued to indicate a strong and stable labor market. Initial Jobless Claims increased 10K to 233K for the week ended October 21st. Continuing claims fell to 233K in the prior week – the lowest level since March 1973. Data from the US was “less rosy” with the goods trade deficit widening in September and retail inventories falling. The Atlanta Federal Reserve’s GDPNow forecast for Q3 was subsequently reduced to 2.5% from 2.7%.
AUD came under selling pressure, as the Australian Government was in turmoil after it was announced that Deputy Prime Minister Barnaby Joyce was declared ineligible to sit in parliament because he was also a citizen of New Zealand when elected. With Joyce’s ineligibility, it means that Prime Minister Turnbull’s one-seat majority in the lower house has gone. Joyce will now have to re-contest his seat in a special election to be held in December. AUDUSD fell to as low as 0.7625 in early Friday trading.
EURUSD continued its downward trend overnight, currently trading around 1.1635.
USDJPY is 0.25% higher in early Friday trading at around 114.10.
GBPUSD is 0.2% lower overnight, currently trading around 1.3135.
Gold currently trades around $1,268.
WTI is 0.3% lower in early trading at around $52.70.
Major data releases for today:
At 08:15 BST, ECB executive board member Peter Praet is schedule to deliver the Keynote address at the 5th Frankfurt Conference on Financial Market Policy organized by Goethe University’s SAFE Policy Center in Frankfurt, Germany.
At 11:30 BST, the Central Bank of Russia is scheduled to announce its interest rate decision. The markets are forecasting a 0.25% reduction to 8.25% (from 8.50%). Regardless of the scale of the reduction, or if they decide to leave interest rates unchanged, the markets will be expecting volatility in RUB.
At 13:30 BST, the US Bureau of Economic Analysis will release Gross Domestic Product Annualized, along with the GDP Price Index, for Q3. The annualized rate is forecast to come in at 2.5% from the previous reading of 3.1%. GDP Price Index is forecast at 1.8% from 1.0%.
At 13:30, the US Department of Commerce will release Core Personal Consumption Expenditures (& PCE Prices) quarter-on-quarter for Q3. PCE Prices are forecast to come in at 1.2% an increase from the previous release of 0.3% and Core PCE is forecast to come in at 1.3% from the previous reading of 0.9%.
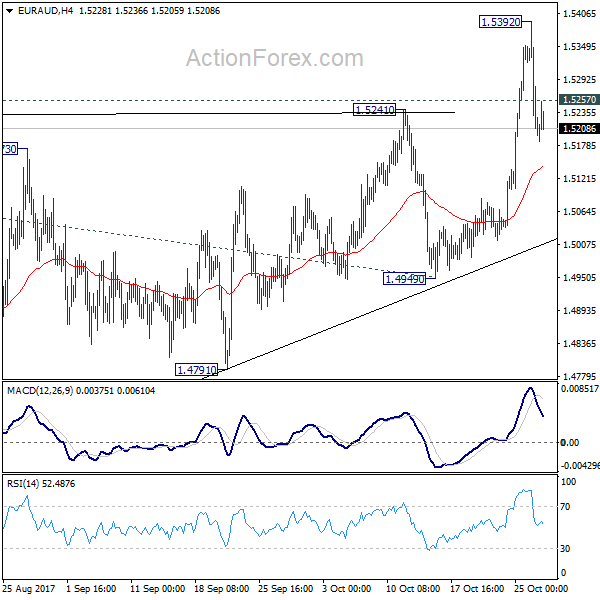
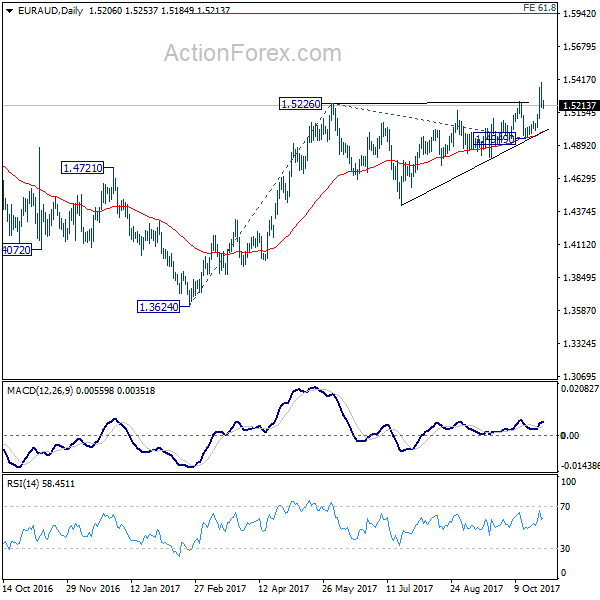
EUR/AUD Daily Outlook
Daily Pivots: (S1) 1.5137; (P) 1.5265; (R1) 1.5333; More....
Intraday bias in EUR/AUD remains neutral for consolidation below 1.5392 temporary top. Overall near term outlook remains bullish as long as 1.1494 support holds. Break of 1.5392 will resume medium term rise from 1.3624 and target 61.8% projection of 1.3624 to 1.5226 from 1.4949 at 1.5939 first.
In the bigger picture, we're holding on to the view that corrective decline from 1.6587 medium term top has completed at 1.3624. Rise from 1.3624 is expected to extend to retest 1.6587. The corrective structure of the price actions from 1.5226 is affirming this view. Sustained trading above 1.5226 will target a test on 1.6587 key resistance. However, break of 1.4421 support will dampen our view and would drag EUR/AUD lower to retest key support zone around 1.3624.
Trade Idea : USD/CHF – Buy at 0.9935
USD/CHF - 0.9991
Most recent candlesticks pattern : N/A
Trend : Up
Tenkan-Sen level : 0.9989
Kijun-Sen level : 0.9940
Ichimoku cloud top : 0.9896
Ichimoku cloud bottom : 0.9889
Original strategy :
Buy at 0.9900, Target: 1.0000, Stop: 0.9865
Position : -
Target : -
Stop : -
New strategy :
Buy at 0.9935, Target: 1.0035, Stop: 0.9900
Position : -
Target : -
Stop : -
As the greenback has continued heading north after breaking resistance at 0.9940, adding credence to our bullish view that recent rise from 0.9421 low is still in progress and may extend further gain to 1.0035-40, having said that, overbought condition should limit upside to 1.0075-80 and price should falter below 1.0100 resistance and bring retreat later.
In view of this, we are looking to buy dollar again on pullback as the Kijun-Sen (now at 0.9940, same level as previous resistance) should limit downside and bring another rise later. Below the Ichimoku cloud (now at 0.9889-96) would defer and suggest top is possibly formed, risk test of support at 0.9869.

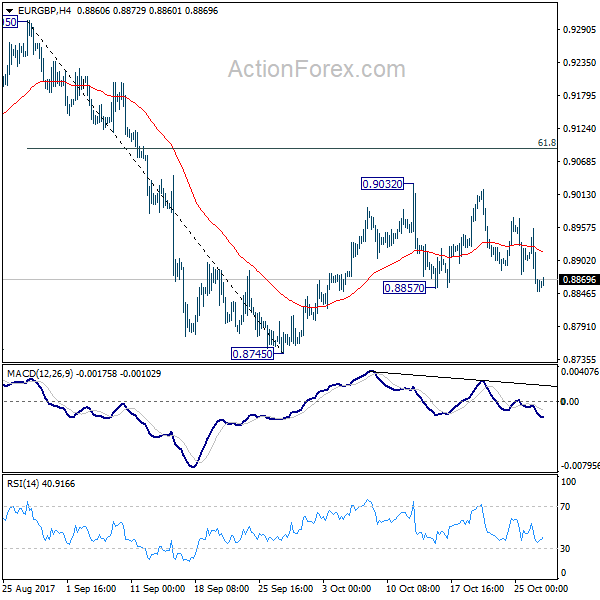
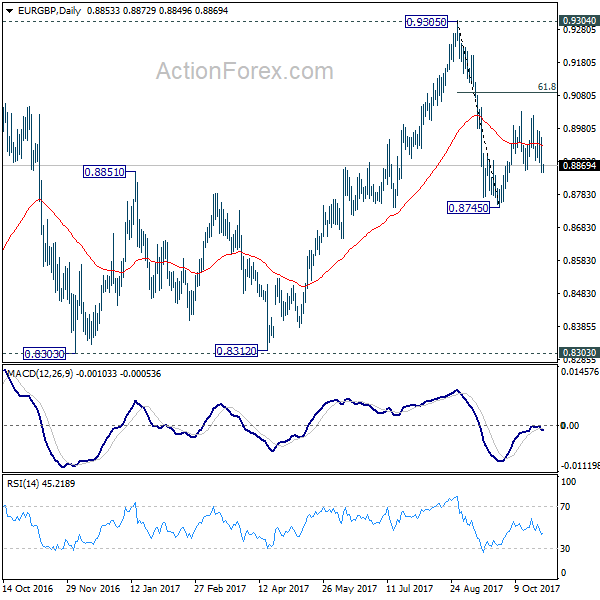
EUR/GBP Daily Outlook
Daily Pivots: (S1) 0.8816; (P) 0.8886; (R1) 0.8922; More...
EUR/GBP dips mildly today and breaches 0.8857 minor support. Intraday bias is turned to the downside for retesting 0.8745 support first. Firm break there will resume whole decline form 0.9305 and target 0.8303 key support level. On the upside, since price actions from 0.8745 is seen as a correction, in case of another rise, upside would be limited by 61.8% retracement of 0.9305 to 0.8745 at 0.9091.
In the bigger picture, there are various ways to interpret price actions from 0.9304 high. But after all, firm break of 0.9304/5 is needed to confirm up trend resumption. Otherwise, range trading will continue with risk of another fall. And in that case, EUR/GBP could have a retest on 0.8303. But we'd expect strong support from 0.8116 cluster support (50% retracement of 0.6935 to 0.9304 at 0.8120) to contain downside.
Currencies: EUR/USD Challenging 1.1662 Support. Will US GDP Force The Break?
Sunrise Market Commentary
- Rates: US yields cruise above key technical levels, final confirmation after GDP?
Attention turns to the US with the first reading of third quarter GDP. Risks are on the upside of expectations which is negative for US Treasuries and can result in a weekly close above key technical yield levels which is a strong signal, paving the way for a new up-leg. The Bund’s outperformance could continue short term after the dovish ECB meeting. - Currencies: EUR/USD challenging 1.1662 support. Will US GDP force the break?
Yesterday, a soft ECB decision broke recent euro resilience. EUR/USD dropped to test the 1.1662 support. Today, the focus turns to the US Q3 GDP report. A good report might be supportive for the US currency. Of late, the dollar often failed to profit from good news or from additional interest rate support. Will this pattern change?
The Sunrise Headlines
- US stock markets closed near opening levels. Most Asian stock markets are positively oriented overnight with Japan outperforming on yen weakness. Chinese industrial profits jumped by the most since 2011 (27.7% Y/Y).
- Republicans have cleared a hurdle in their efforts to overhaul the US tax code for the first time in a generation with a successful vote in Congress that opened the way for the introduction of reform legislation.
- Catalan president Puigdemont ruled out calling a snap regional election that could have de-escalated the political crisis in the region, paving the way for the Spanish state to begin imposing direct rule over Catalonia.
- Amazon jumped 7.7% post-market after reporting sales and profit that exceeded expectations. Alphabet hit an all-time high in late trading as a surge in Google ads eased concerns about rising costs. Microsoft's push into the cloud helped it beat estimates and even Twitter jumped after adding more monthly users.
- Japan's core CPI marked a ninth straight month of annual gains in September (0.7% Y/Y), but failed to accelerate from the previous month, underscoring the central bank's huge task as it struggles to meet an ever-elusive inflation target.
- Today’s eco calendar is thin with only Q3 US GDP and final University of Michigan consumer confidence
Currencies: EUR/USD Challenging 1.1662 Support. Will US GDP Force The Break?
EUR/USD tests 1.1670/62 support
Yesterday’s ECB decision to prolong APP by 9 months and half the amount of monthly purchases was on the soft side of expectations and so was the forward guidance. At first, the euro decline was modest but accelerated later in the session. Political chaos in Spain and overall USD strength accelerated the EUR/USD decline. EUR/USD closed the session at 1.1651 (from 1.1813). USD/JPY profited from a strong equity performance and finished the day at 113.98 (from 133.74).
Overnight, Asian equities mostly trade with decent gains, supported by strong earnings from several US bellwethers after the close on WS. USD/JPY makes some modest extra gain and trades in the 114.10 area. Japan September inflation was unchanged at 0.7% Y/Y; indicating that the BOJ should continue to ultra-loose monetary policy. EUR/USD continues trading with a slightly negative bias. Australian equities and the Aussie dollar are under pressure after a High Court decision erased the Turnbull government’s majority. AUD/USD dropped below 0.7650.
EMU area data are second tier today, but the first reading of US Q3 GDP is interesting. Markets expect 2.5% Q/Qa, slightly below Q2’s 3.1% Q/Qa. Given the damage of the hurricanes combined with good sentiment data recently, such an outcome should be considered encouraging. It keeps the way open for the Fed to raise rates in December. We see upside risks due to strong business investment but the composition will be less good than in Q2. Consumption will have slowed but this will be offset by stronger inventories, business investment and maybe a small positive contribution of net exports
The euro traded strong in the run-up to the ECB decision. At the same time, the dollar failed to gain against the single currency even as interest rate differentials have risen sharply since early September. This trading dynamics was broken after yesterday’s ECB decision. Policy divergence between the ECB and the Fed is again on the radar of (FX) markets, at least for now. Yesterday’s EUR/USD decline was mainly euro weakness, not USD strength. However, a good US Q3 GDP might trigger some further EUR/USD follow-through selling especially as the technical picture turned more negative for EUR/USD (see infra). A EUR/USD sell-on upticks bias is favoured. That said, any additional interest rate support for the dollar will probably modest after the recent widening. There is not that much room for Bund outperformance given current low yield levels. So, any further EUR/USD decline might develop in a gradual way.
From a technical point of view, EUR/USD dropped below the 1.1823/ 1.2070 consolidation pattern, but until yesterday there was no sustained follow-through price action. The pair currently tries to break below the 1.1670/62 support. If confirmed, it would be negative for the EUR/USD. EUR/USD 1.1423 (38% retracement of 2017 rise) is the next downside target on the charts. The USD/JPY momentum was positive in September. The pair regained 110.67/95 resistance, a short-term positive. The 114.49 correction top is the next resistance. Sentiment improved last week. The range top is within reach, but we don’t preposition for a sustained break higher.
EUR/USD tries to break below 1.1662 support. If confirmed, the ST picture would turn negative
EUR/GBP
EUR/GBP returns below 0.89on euro weakness
Sterling lost momentum yesterday as the positive impact from Wednesday’s better than expected UK Q3 GDP faded. There were again divergent views reported from the UK conservative party on how to address Brexit. This weighed on sterling. The CBI retail sales gauge dropped from +42 to -36, the lowest level since 2009. In the afternoon, sterling lost further ground against a broadly stronger dollar. Cable closed the session at 1.3161 (from 1.3262). EUR/GBP declined substantially in line with the overall setback of the euro after the ECB policy decision. EUR/GBP closed the session at 0.8854 (from 0.8909).
The UK eco calendar is empty today. So Brexit and the overall performance of the euro in the aftermath of the ECB decision might be the drivers for sterling trading. EUR/USD dropping below a first support might keep the single currency in the defensive short-term. This might weigh on EUR/GBP. Cable might cede further ground though in case of an improving USD sentiment. In this context, any further EUR/GBP losses might remain modest. We maintain a EUR/GBP buy-on-dip bias but are in no hurry to add exposure until we see signs that the post-ECB euro correction is slowing down.
EUR/GBP staged a strong uptrend from April till late August with a top at 0.9307. Rising UK inflation and the BoE preparing markets for a rate hike caused a sterling rebound, but it has run its course. EUR/GBP recently tried to regain the 0.89 area, but until now there were no follow-through gains. A drop below the 0.8855 area might open the way for a return to the supports at 0.8743 or maybe even 0.8652. However, we still consider this area as tough to break
EUR/GBP tests first minor support on the overall decline of the euro
GBP/JPY Daily Outlook
Daily Pivots: (S1) 149.55; (P) 150.22; (R1) 150.70; More
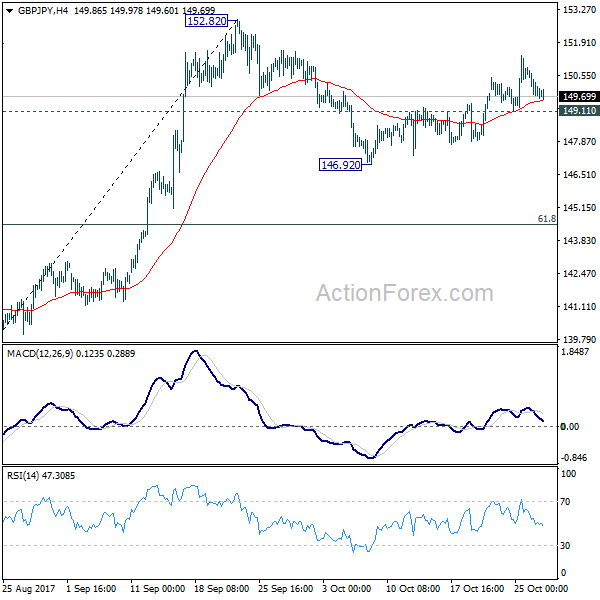
At this point, with 149.11 minor support intact, further rise is still mildly in favor in GBP/JPY for 152.82 resistance. Firm break there will confirm resumption of medium term rise from 122.36 and target 163.87 resistance next. On the downside, break of 149.11 minor support will turn bias to the downside and extend the correction from 152.82. In that case, we'd expect strong support from 61.8% retracement of 139.29 to 152.82 at 144.45 to bring rebound.
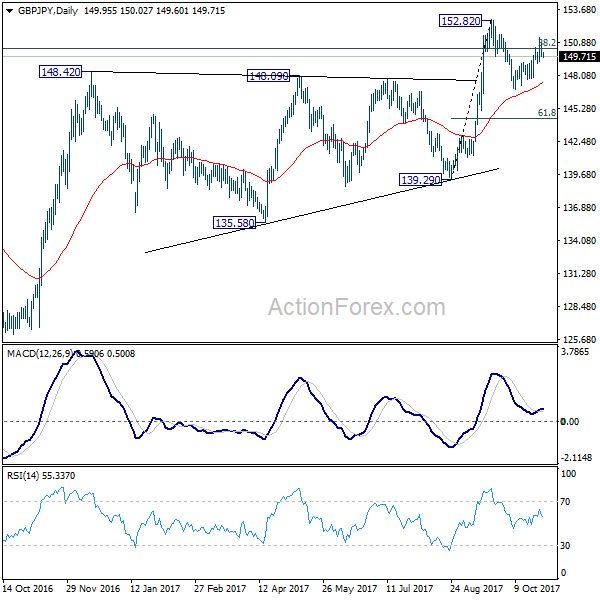
In the bigger picture, medium term rebound from 122.36 is still expected to resume after corrective pull back from 152.82 completes. Firm break of 38.2% retracement of 196.85 to 122.36 at 150.43 will carry long term bullish implications. In that case, GBP/JPY could target 61.8% retracement at 167.78. However, break of 139.29 will indicate rejection from 150.43 key fibonacci level. And the three wave corrective structure of rebound from 122.36 will argue that larger down trend is resuming for a new low below 122.26.
Trade Idea : EUR/USD – Sell at 1.1715
EUR/USD - 1.1631
Most recent candlesticks pattern : N/A
Trend : Sideways
Tenkan-Sen level : 1.1638
Kijun-Sen level : 1.1729
Ichimoku cloud top : 1.1805
Ichimoku cloud bottom : 1.1788
Original strategy :
Sell at 1.1755, Target: 1.1655, Stop: 1.1790
Position : -
Target : -
Stop : -
New strategy :
Sell at 1.1715, Target: 1.1615, Stop: 1.1750
Position : -
Target : -
Stop : -
Euro’s decline has gathered momentum after breaking below support at 1.1725 yesterday and previous low at 1.1669 was breached as well, adding credence to our view that the fall from 1.2093 top is still in progress and bearishness remains for this move to extend weakness to 1.1615-18 (61.8% projection of 1.2093-1.1669 measuring from 1.1880), then towards 1.1580-85, however, near term oversold condition should limit downside to 1.1550-55, bring rebound later.
In view of this, we are looking to sell euro on recovery but at a lower level as previous support at 1.1725 should turn into resistance and cap upside. Above 1.1750-55 would defer and suggest low is formed instead, risk rebound to 1.1775-80 first.

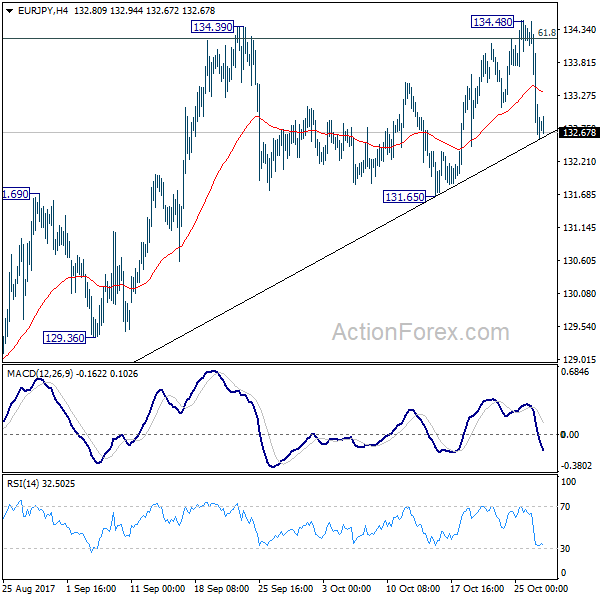
EUR/JPY Daily Outlook
Daily Pivots: (S1) 132.15; (P) 133.32; (R1) 133.98; More...
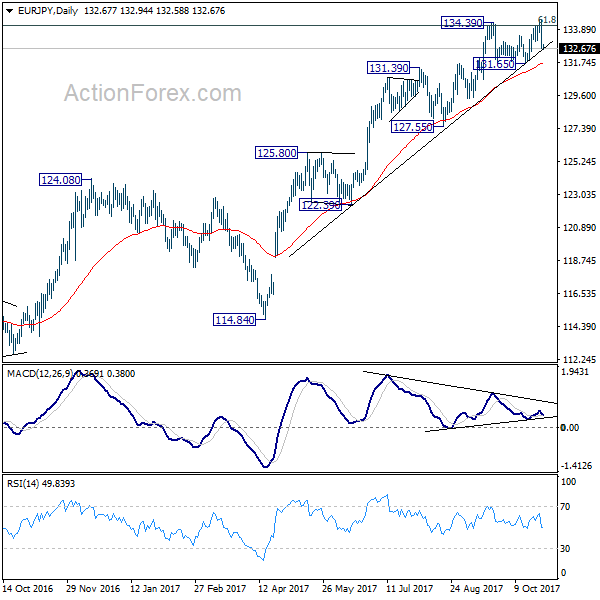
Intraday bias in EUR/JPY remains neutral first. Outlook remains bullish as long as 131.65 support holds and further rise is still in favor. Sustained break of 134.39 resistance will confirm up trend resumption and target 141.04 long term resistance. However, on the downside, firm break of 131.65 will suggest trend reversal and turn focus to 127.55 key support.
In the bigger picture, medium term rise from 109.03 (2016 low) is seen as at the same degree as the down trend from 149.76 (2014 high) to 109.03 (2016 low). 61.8% retracement of 149.76 to 109.03 at 134.20 is already met. Sustained break there will pave the way to key long term resistance zone at 141.04/149.76. However, break of 127.55 support will argue that the medium term trend has reversed and will turn outlook bearish for deeper fall.
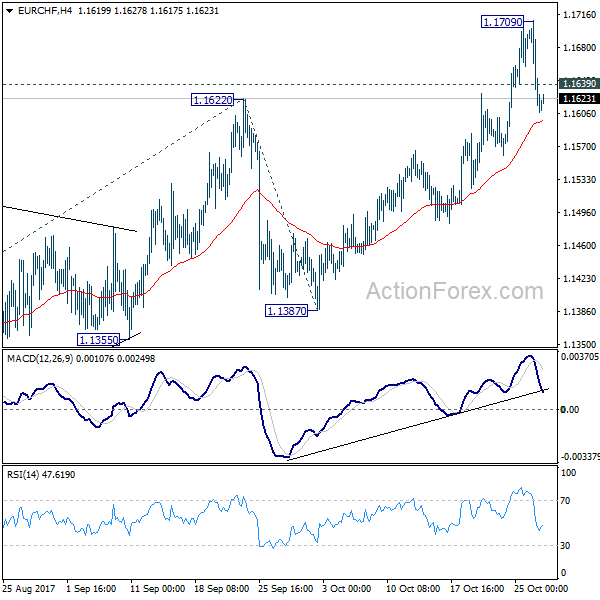
EUR/CHF Daily Outlook
Daily Pivots: (S1) 1.1591; (P) 1.1649; (R1) 1.1684; More...
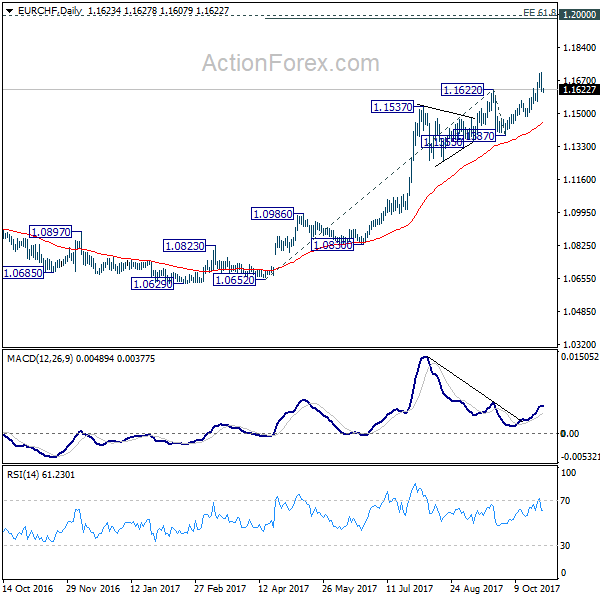
A temporary top is in place at 1.1709 in EUR/CHF and intraday bias is turned neutral first. Some consolidations could be seen first. But outlook remains bullish as long as 1.1387 support holds. Above 1.1709 will extend the medium term rise to 61.8% projection of 1.0652 to 1.1622 from 1.1387 at 1.1986, which is close to 1.2 key level.
In the bigger picture, long term rise from SNB spike low back in 2015 is still in progress. EUR/CHF should now be heading back to prior SNB imposed floor at 1.2000. For now, this will be the favored case as long as 1.1355 support holds.
Trade Idea : USD/JPY – Buy at 113.70
USD/JPY - 114.28
Most recent candlesticks pattern : N/A
Trend : Near term up
Tenkan-Sen level : 114.14
Kijun-Sen level : 113.83
Ichimoku cloud top : 113.75
Ichimoku cloud bottom : 113.69
New strategy :
Buy at 113.70, Target: 114.70, Stop: 113.35
Position : -
Target : -
Stop : -
Dollar found renewed buying interest at 113.34 yesterday and has resumed recent upmove, adding credence to our bullish view that the rise from 107.32 low is still in progress and may extend further gain to 114.75-80 (61.8% projection of 111.65-114.10 measuring from 113.24), however, overbought condition should limit upside to 115.00 and risk from there is seen for a retreat later.
In view of this, would not chase this rise here and would be prudent to buy dollar again on pullback as 113.70-75 should limit downside. Below said support at 113.34 would abort and signal top is formed instead, bring retracement of recent rise to 113.15 (previous resistance turned support).
