Sample Category Title
Euro-Zone’s Consumer Confidence Jumped To A More Than 16-Year High In October
For the 24 hours to 23:00 GMT, the EUR declined 0.14% against the USD and closed at 1.1750.
In economic news, data showed that the Euro-zone's flash consumer confidence index improved to a level of -1.0 in October, notching its highest level since April 2001, indicating that consumers continued to gain confidence as the region's economic recovery picks up further momentum. Markets had expected the index to advance to a level of -1.1, following a reading of -1.2 in the prior month.
Separately, the Bundesbank's monthly report indicated that German economic growth will maintain its strong momentum in the third quarter of 2017, driven by robust industrial orders and noted that industrial sector is likely to remain one of the bright spots for the economy. Further, it revealed that construction has probably made no further contribution to growth.
In the US, the Chicago Fed national activity index climbed to a level of 0.17 in September, compared to a revised reading of -0.37 in the previous month, while markets had anticipated for a rise to a level of -0.10.
In the Asian session, at GMT0300, the pair is trading at 1.1762, with the EUR trading 0.1% higher against the USD from yesterday's close.
The pair is expected to find support at 1.1732, and a fall through could take it to the next support level of 1.1703. The pair is expected to find its first resistance at 1.1784, and a rise through could take it to the next resistance level of 1.1807.
Trading trend in the Euro today is expected to be determined by the release of preliminary Markit manufacturing and services PMIs for October across the Euro-zone, slated in a few hours. Moreover, the US flash Markit manufacturing and services PMIs, due to release later in the day, will pique significant amount of market attention.
The currency pair is trading between its 20 Hr and 50 Hr moving averages.

Theresa May ‘Ambitious And Positive’ About Progress In Brexit Negotiations
For the 24 hours to 23:00 GMT, the GBP rose 0.07% against the USD and closed at 1.3203, after the British Prime Minister, Theresa May, remained optimistic over Brexit talks, stating that she is “ambitious and positive” about UK's future with the European Union and added that constructive progress had been made in Brexit negotiations.
Meanwhile, data revealed that UK's CBI industrial trends total orders surprisingly fell to a level of -2.0 in October, against market consensus for a rise to a level of 9.0 and hitting its the lowest since November 2016. The CBI industrial trends total orders had recorded a level of 7.0 in the previous month.
In the Asian session, at GMT0300, the pair is trading at 1.3218, with the GBP trading 0.11% higher against the USD from yesterday's close.
The pair is expected to find support at 1.3175, and a fall through could take it to the next support level of 1.3132. The pair is expected to find its first resistance at 1.3244, and a rise through could take it to the next resistance level of 1.3270.
In absence of any macroeconomic releases in the UK today, investor sentiment would be governed by global macroeconomic news.
The currency pair is trading above its 20 Hr and 50 Hr moving averages.

Trade Idea : USD/CHF – Buy at 0.9795
USD/CHF - 0.9854
Most recent candlesticks pattern : N/A
Trend : Up
Tenkan-Sen level : 0.9847
Kijun-Sen level : 0.9857
Ichimoku cloud top : 0.9841
Ichimoku cloud bottom : 0.9801
Original strategy :
Buy at 0.9795, Target: 0.9895, Stop: 0.9760
Position : -
Target : -
Stop : -
New strategy :
Buy at 0.9795, Target: 0.9895, Stop: 0.9760
Position : -
Target : -
Stop : -
As the greenback has retreated after rising to 0.9882 yesterday, suggesting consolidation below this level would be seen and pullback to 0.9815-20 cannot be ruled out, however, reckon support at 0.9796 would limit downside and bring another rise later, above said resistance at 0.9882 would add credence to our view that recent upmove from 0.9421 has resumed and bullishness remains for this move to extend headway to 0.9870 and possibly towards 0.9900, having said that, overbought condition should limit upside and price should falter below 0.9940-50, bring retreat later.
In view of this, we are looking to buy dollar again on pullback as support at 0.9796 should limit downside and bring another rise. Below 0.9765-70 would defer and suggest top is possibly formed, risk test of indicated support at 0.9730-37, however, break there is needed to provide confirmation, then further fall to previous support at 0.9705 would follow.

Japan’s Manufacturing Sector Growth Slowed In October
For the 24 hours to 23:00 GMT, the USD declined 0.36% against the JPY and closed at 113.40.
Macroeconomic data indicated that Japan's final leading economic index climbed to a level of 107.2 in August, revised higher from a level of 106.8 registered in the preliminary print. The index had recorded a reading of 105.2 in the previous month. Further, the nation's final coincident index rose more than initially estimated to a level of 117.7 in August, compared to a reading of 115.7 in the previous month, while the flash print had indicated an increase to a level of 117.6.
In the Asian session, at GMT0300, the pair is trading at 113.35, with the USD trading marginally lower against the JPY from yesterday's close.
Overnight data showed that Japan's flash Nikkei manufacturing PMI eased to a level of 52.5 in October, following a level of 52.9 in the previous month.
The pair is expected to find support at 113.08, and a fall through could take it to the next support level of 112.8. The pair is expected to find its first resistance at 113.8, and a rise through could take it to the next resistance level of 114.24.
The currency pair is trading below its 20 Hr and 50 Hr moving averages.

Trade Idea : GBP/USD – Sell at 1.3285
GBP/USD - 1.3215
Most recent candlesticks pattern : N/A
Trend : Near term down
Tenkan-Sen level : 1.3210
Kijun-Sen level : 1.3193
Ichimoku cloud top : 1.3165
Ichimoku cloud bottom : 1.3155
Original strategy :
Sell at 1.3285, Target: 1.3155, Stop: 1.3320
Position : -
Target : -
Stop : -
New strategy :
Sell at 1.3285, Target: 1.3155, Stop: 1.3320
Position : -
Target : -
Stop : -
As cable found renewed buying interest at 1.3158 yesterday and has risen again, adding credence to our view that a temporary low was formed at 1.3088 late last week, hence near term upside risk remains for this move to extend gain to 1.3240-45 (61.8% Fibonacci retracement of 1.3338-1.3088), however, price should falter below indicated resistance at 1.3287 and bring retreat later, below said support at 1.3158 would signal the rebound from 1.3088 has ended, brig weakness to 1.3125-30, break there would bring retest of said support at 1.3088, a drop below there would extend the fall from 1.3338 to 1.3050, then towards recent low at 1.3027.
In view of this, wee are looking to sell cable on further subsequent recovery as resistance at 1.3287 should limit upside and bring another decline later. Only above 1.3312 resistance would abort and extend further gain to said recent high at 1.3338 which is likely to hold from here.

Swiss Franc Trading Marginally Higher This Morning
For the 24 hours to 23:00 GMT, the USD slightly rose against the CHF and closed at 0.9850.
On the macro front, Switzerland’s total sight deposits inched up to a level of CHF578.6 billion in the week ended 20 October, from a level of CHF578.5 billion reported in the previous week.
In the Asian session, at GMT0300, the pair is trading at 0.9845, with the USD trading a tad lower against the CHF from yesterday’s close.
The pair is expected to find support at 0.9824, and a fall through could take it to the next support level of 0.9802. The pair is expected to find its first resistance at 0.9874, and a rise through could take it to the next resistance level of 0.9902.
The currency pair is trading below its 20 Hr moving average and showing convergence with its 50 Hr moving average.

Trade Idea : EUR/USD – Stand aside
EUR/USD - 1.1755
Most recent candlesticks pattern : N/A
Trend : Sideways
Tenkan-Sen level : 1.1758
Kijun-Sen level : 1.1751
Ichimoku cloud top : 1.1805
Ichimoku cloud bottom : 1.1778
New strategy :
Stand aside
Position : -
Target : -
Stop : -
Although the single currency broke below previous support at 1.1730, lac of follow through selling and the subsequent rebound from 1.1725 suggest further consolidation would take place and recovery to 1.1780-90 cannot be ruled out, however, still reckon upside would be limited to 1.1820-25 and price should falter well below resistance at 1.1858, bring further choppy trading later.
On the downside, below said support at 1.1725 would extend the fall from 1.1880 top to 1.1700 and possibly towards indicated previous support at 1.1669 but break of latter level is needed to retain bearishness and extend further subsequent decline to 1.1640-45 first. As near term outlook is still mixed, would be prudent to stand aside in the meantime.

Trade Idea : USD/JPY – Buy at 113.00
USD/JPY - 113.39
Most recent candlesticks pattern : N/A
Trend : Near term up
Tenkan-Sen level : 113.37
Kijun-Sen level : 113.61
Ichimoku cloud top : 113.68
Ichimoku cloud bottom : 113.20
Original strategy :
Buy at 113.20, Target: 114.20, Stop: 112.85
Position : -
Target : -
Stop : -
New strategy :
Buy at 113.00, Target: 114.00, Stop: 112.65
Position : -
Target : -
Stop : -
Although rose to 114.10 after opening higher yesterday, the subsequent retreat suggests consolidation below this level would be seen and pullback to 113.20 (50% Fibonacci retracement of 112.30-114.10) cannot be ruled out, however, reckon 112.95-00 (61.8% Fibonacci retracement) would hold and bring another rise later, above 113.80 would suggest the pullback from 114.10 has ended, bring retest of this resistance but break there is needed to confirm recent rise from 111.65 has resumed for headway to 114.40-50 but reckon 114.75-80 would hold from here.
In view of this, we are looking to buy dollar again on further pullback as 112.95-00 should limit downside and bring another rise. Below 112.65-70 would abort and signal top is formed instead, risk test of indicated support at 112.30 which is likely to hold from here.

Loonie Reverses Its Losses In The Asian Session
For the 24 hours to 23:00 GMT, the USD rose 0.13% against the CAD and closed at 1.2644.
In the Asian session, at GMT0300, the pair is trading at 1.2629, with the USD trading 0.12% lower against the CAD from yesterday’s close.
The pair is expected to find support at 1.2609, and a fall through could take it to the next support level of 1.2588. The pair is expected to find its first resistance at 1.2655, and a rise through could take it to the next resistance level of 1.2680.
With no macroeconomic releases in Canada today, investors will focus on global macroeconomic factors for further direction.
The currency pair is trading between its 20 Hr and 50 Hr moving averages.

GBP/USD Elliott Wave Analysis
GBP/USD – 1.3254
Although sterling found support at 1.3088 late last week and has recovered, suggesting consolidation would be seen, however, reckon upside would be limited to 1.3240-50 and bring another decline, a daily close below said support at 1.3088 would signal the rebound from 1.3027 low has ended and bring retest of this level. Looking ahead, a drop below this level would signal the fall from 1.3658 top has resumed for weakness to 1.3000, then towards 1.2950 but support at 1.2909 should limit downside and another previous support at 1.2852 would remain intact.
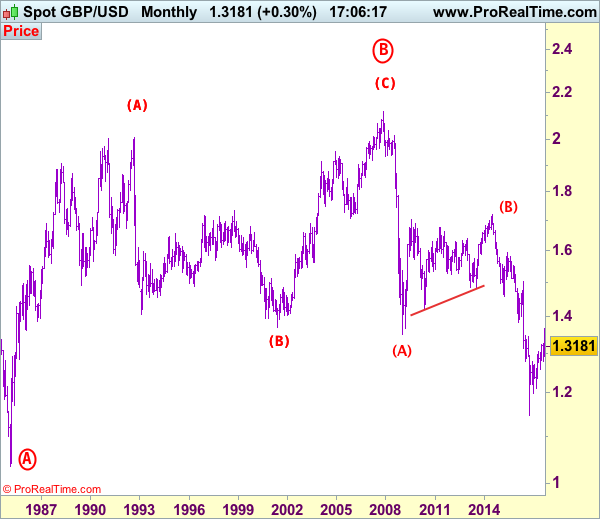
Our preferred count on the daily chart is that cable's rebound from 1.3500 (wave (A) trough) is unfolding as a wave (B) with A ended at 1.7043, followed by triangle wave B and wave C as well as wave (B) has possibly ended at 1.7192, below support at 1.4232 would add credence to this count, then further fall to 1.4000 level would follow but reckon downside would be limited to 1.3655 support and price should stay above previous support at 1.3500.
On the upside, expect recovery to be limited to 1.3240-50 and bring another decline. Above resistance at 1.3287 would defer and suggest the retreat from 1.3338 has ended at 1.3088 and risk a stronger rebound to 1.3300, then towards 1.3338-43 resistance level, break there would extend the rebound from 1.3027 low to 1.3400 and possibly towards resistance at 1.3455, however, if our view that top has been formed at 1.3658 is correct, upside would be limited and bring another decline later.
Recommendation: Hold short entered at 1.3300 for 1.3050 with stop lowered to 1.3250.

Longer term - Cable's rise from 1.0520 (Feb 1985) to 2.0100 (September 1992) is seen as [A], the decline to 1.3682 is labeled as (B) and (C) wave rally has ended at 2.1162 (9 Nov, 2007) which is also the top of larger degree wave B with circle. The selloff from there is a 5-waver with wave (A) ended at 1.3500 (23 Jan 2009), wave (B) itself is labeled as A: 1.6733, triangle wave B: 1.4813 and wave C as well as top of wave (B) ended at 1.7192 (2014), hence the selloff from there is an impulsive wave (C) with wave I : 1.4566, wave II 1.5930, an extended wave III is unfolding and already exceeded our downside target at 1.3500 and 1.3000, hence weakness to 1.2500 and possibly 1.2000 cannot be ruled out, however, price should stay well above psychological level at 1.0000.