Sample Category Title
China: Xi Gets Name In Constitution – Wang Qishan Steps Down
The Chinese leader Xi Jinping has had his name added to the Party Constitution with his ‘Xi Jinping Thoughts on Socialism with Chinese Characteristics in a new Era'.
It puts Xi alongside Mao and Deng Xiaoping whereas China's two previous leaders Hu Jintao and Jiang Zemin did not get their names in the Constitution. It underlines that Xi is the strongest Chinese President since Deng Xiaopeng and some believe since Mao.
The list of the new Central Committee of 205 members is also released and reveals that Wang Qishan is stepping down as he is not on the list. Wang Qishan has been the leader of the corruption campaign and generally believed to be the no. 2 in the Party after Xi Jinping. Wang Qishan is 69 and thus due to retire according to the informal rule of ‘7 up, 8 down' that says a member of the Standing Committee must retire if he is above 67. However, it had been speculated that Xi Jinping would keep him on and thus break the informal rule. However, it turns out Xi Jinping has decided to respect the line of the Party – a positive sign that despite being more powerful, he still respects the Party line.
The Central Committee will now have its first plenum and vote on the members of the Standing Committee. The members will be presented tomorrow. The SCMP revealed a list of likely members of the new Committee on Sunday. It suggests that it will continue to consist of seven members and that there will be representatives from different factions of the Party. This would be another sign that Xi Jinping is striking a balance in exercising his power. With his name in the constitution, it is clear he is a strong leader. At the same time, he would signal openness for cooperation across the factions of the Party by not just putting his ‘own people' in the Standing Committee. It is of course still not official who the members are and we will need to see this confirmed tomorrow. Below is the list named in the article.
What will be in focus tomorrow is also if a successor for Xi Jinping is designated when he is supposed to step down in 2022. If the list from the South China Morning Post holds true, none of the members will be young enough to be a successor and thus be able to serve one five-year term in the Standing Committee and then two five-year terms as President if the informal rule of ‘7 up, 8 down' is respected. This would require an age of 57 or younger when entering the Standing Committee. However, it is only an informal rule, so it is possible to deviate without the need for changes of any formal rules. If confirmed, however, it may increase speculation that Xi Jinping will aim to stay on after his second term expires in 2022. The two possible members young enough to be successors and that have been in the run-up are Chen Min'er (54) and Hu Chunhua (57). However, if the latest list of members is true, neither of them will make it to the Standing Committee.
Who’s The Next Fed Chair?
U.S. equity investors decided to pull out some profits on Monday, after Wall Street's major indices posted new intraday records at the opening. The S&P 500 ended 0.4% lower, while the NASDAQComposite Index and Dow Jones Industrial Average declined 0.6% and 0.2%, respectively. Although markets seem to be relatively quiet, the CBOE's Volatility Index (VIX) logged thelargest one-day gain in nearly seven weeks, closing above 11 -an indication that option premiums on the S&P 500 are rising, which could be an early sign that investors are protecting their portfolios from a possible pullback.
Earnings should continue to be the major driver this week, with more than a third of S&P 500 companies due to report their thirdquarter results. Many investors have joined the rally on tax reform hopes; this is evident in the small-cap Russell 2000, which has rallied more than 10% since mid-August. How much further the rally persists on such pro-growth policy hopes remains to be seen, especially since a considerable amount has been priced in since the beginning of the year.
Investors are also in wait and see mode, as President Trump may announce his nominee for the Fed Chair this week. In an interview yesterday, he said he would name the new chair "very shortly.” I think his decision will not be just based on who's the biggest dove, but of greater importance, is finding someone who iswilling to de-regulate the financial sector. So far, Jerome Powell seems to be the best fit, but in the Trump era, we should always be prepared for surprises.
Currency markets are moving in very tight ranges early Tuesday, with the Euro trading within a 27 pips range. Although we heard some voices saying that the crisis in Spain could lead to the break upof the EU, the reaction in the Euro and EU fixed income markets are not supporting this theory. The main risk event for the single currency remains to be Thursday's ECB meeting, and I don't expect significant moves until then.
On the data front, preliminary PMI's from Germany and France are expected to show continued strength in the manufacturing and service sectors, despite a slight pullback in German manufacturing. However, with only tier 2 economic data on the agenda, currency moves are likely to remain within tight ranges.
Abe Consolidates Power After Landslide Victory, Sustaining Monetary Policy Divergence
Once again securing a super majority (two-third of seats) in the snap election on October 22, Japan's LDP/ Komeito coalition would continue to lead the lower house, possibly until 2021. The landslide victory indicates that PM Shinzo Abe would likely be re-elected for a third presidential term in the LDP next year, allowing him to push forward his political and economic policies with a stronger mandate. There are several reasons for the rally in Nikkei and USDJPY after the election outcome. Just like the previous elections we have seen before, the stock market and currency of a country usually weaken amidst of political uncertainty. Re-election of the ruling party has removed of uncertainty at least in the near-term. This bodes well for the stock market and currency. Unlike other currencies which tend to rise on lessened uncertainty, Japanese yen fell on diminished demand for safe-haven asset. Another reason for the rise in Japanese stock market and yen was expectations of lengthy monetary easing by BOJ. Meanwhile, widening US-Japan yield spread would also continue to support USDJPY in the medium term.
Japan's Lower House Election Result
LDP won 284 seats at the snap election. Together with Komeito's 29 seats, the LDP/ Komeito coalition has secured the supermajority (2/3 of 465 seats) in the lower house. The popularities of LDP and Abe have been decreasing before the election. However, the miscalculations made by Yuriko Koike, the leader of the Party of Hopes have led to Abe's victory. Apart from the limited time for running an election campaign given the Party of Hopes was only formed a few weeks before the election day, Koike's decision to not running for the election as the party leader is a mistake. Her rejection to ally with the Democratic Party, the former largest opposition which was dissolved before the election, led to the formation of a Constitutional Democratic Party. This has not only affecter her popularity but also resulted in a split of votes amongst the oppositions. Indeed, we can see that the opposition landscape has been reshuffled, with the Constitutional Democratic Party and the Party of Hopes being the two largest parties.
Fiscal Policy
There would not be much difference in the fiscal and monetary policies before and after the election. Abe would push forward his consumption tax hike in October 2019, to 10% from the current 8%. He has pledged to allocate 2 trillion yen (out of 5 trillion yen) of the increased tax revenue to expand access to education and cut waiting times at child-care centers. A detailed plan of the package would be released before the end of the year. He also pledged to create an investment program designed to enhance productivity. The most controversial part of the budget should be the defence spending. We expect a significant increase in military spending in response to the North Korean threat.
Monetary Policy
The monetary policy would continue to be ultra- accommodative. The 2% inflation target, which was set when BOJ governor Haruhiko Kuroda took office in 2013, should remain intact. Although there is a long way to go to achieving this target, Abe noted in a Nikkei interview last month that he would stick with this target. We expect the aim was to send the market a signal that the monetary policy would remain loose for a long period of time. Meanwhile, at the BOJ press conference in September, Kuroda rejected the idea of adjusting the inflation target. He affirmed that the inflation target is based on a joint agreement between the BOJ and the government made in 2013. He added that the target is consistent with the Bank of Japan Act, which endorsed the BOJ's main objective of achieving price stability. Kuroda pledged to implement more easing in order to achieve the target.
The election result has cleared of uncertainty of Kuroda's successor as his term ends in April 2018. Indeed, we expect Abe would likely appoint him for another term. In any case, Abe would be appointing a candidate who is dovish, willing to adopt monetary easing policy and keep the 2% inflation target.
USDJPY, EURJPY
At the September press conference, Kuroda suggested the price situation between Japan and the US (and Europe) is very different, although all are staging economic recovery. He noted that inflation expectations in Japan had never anchored at around 2%. Meanwhile, he feels comfortable with the divergence of the monetary policies between BOJ and the Fed (and ECB). We believe US/Japan yield differential, as a result of policy divergence, would sustain yen's weakness against US dollar and the euro.
GBPUSD Bullish ABove 1.3200 Level
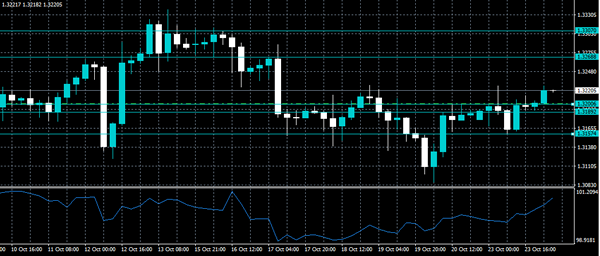
The British pound has moved higher against the U.S dollar, hitting 1.3228, as the U.S dollar index moves lower during early Tuesday trading. The GBPUSD pair currently trades around the 1.3220 level, as sterling traders await the upcoming release of third fiscal quarter Gross Domestic Product figures, from the United Kingdom economy.
The GBPUSD pair remains bullish while trading above the 1.3200 technical level, buyers will likely target the 1.3268 and 1.3307 levels while price-action trades above the 1.3200 level.
Should intraday sellers push the GBPUSD pair below the 1.3200 level, further declines can be expected towards the 1.3189 and 1.3157 technical support levels.
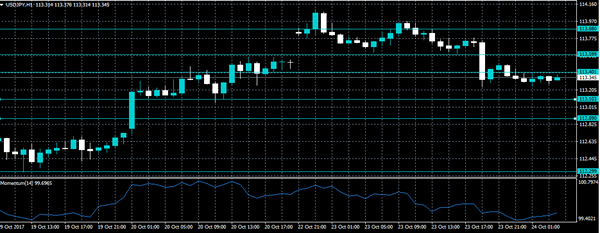
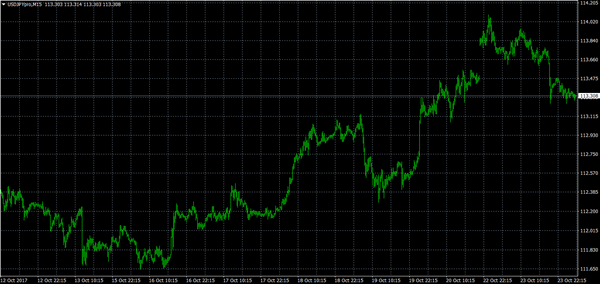
USDJPY Intraday Bearish Below 113.40
The U.S dollar has fallen sharply from the 114.10 level against the Japanese Yen during the Asian session, hitting 113.24, after buyers failed to hold onto the 114 level, and traders book intraday profits from elevated levels. The USDJPY pair is currently trading around the 113.30 level, as investors await the release of key U.S PMI Manufacturing and Services data later today.
The USDJPY pair is intraday bearish while trading below the key 113.40 technical level. Further declines can be seen towards 113.10 and 112.89 while price-action trades below the 113.40 level. Extended support is found at 112.29.
If price-action moves back above the 113.40 technical level, further USDJPY buying should be seen towards the 113.59 and 113.88 levels.
PMI Data Take The Spotlight
Tuesday is PMI day for the global financial markets, as IHS Markit reports on a bevy of surveys from Europe and the United States.
Markit will release PMI data for France, Germany, Eurozone and United States throughout the day. For each jurisdiction, the market research firm will provide services PMI, manufacturing PMI and composite PMI. The composite indicator combines the performances of both services and manufacturing industries.
The French PMI reports will be released at 07:00 GMT. Thirty minutes later, German and Eurozone PMIs will make headlines.
The Eurozone composite PMI is forecast to weaken to 56.5 in October from 56.7 the previous month. Germany’s composite index is also expected to weaken by 0.1 point to 57.6
At 13:45 GMT, Markit will release its US PMI results. Both services and manufacturing industries are forecast to strengthen.
Fifteen minutes later, the Federal Reserve Bank of Richmond will release its monthly manufacturing index for October. The report, which tracks factory output in the Richmond area, is expected to fall to 17 from 19.
Energy traders will be keeping a close eye on weekly inventory data courtesy of the American Petroleum Institute (API). The API report is a precursor to the official inventory data from the US Energy Information Administration (EIA). That report comes our way Wednesday morning New York time.
Earlier in the day, IHS Markit said Japan’s manufacturing PMI weakened unexpectedly this month. The flash Japan manufacturing PMI slipped to 52.5 in October from 52.9 the previous month, as business confidence softened to an 11-month low.
“Although still improving solidly, the Japanese manufacturing sector appeared to lose some momentum in October, as growth eased from September’s four-month high,” said Joe Hayes, the economist at IHS Markit.
USD/JPY
The Japanese yen declined on Monday in the wake of Prime Minister Shinzo Abe’s sweeping election victory. However, the currency has since recovered from three-month lows against the greenback. The USD/JPY is currently trading around 113.36, having traded as high as 114.06 at the start of Monday. The pair faces strong resistance at 114.00, with immediate support located on the lower end of 113.00.
EUR/USD
The euro gained momentum against the dollar Monday, but the rally stopped short of the all-important 1.1800 level. The EUR/USD could see heavy volatility later this week as the European Central Bank (ECB) unveils its policy decision. In the meantime, momentum and RSI indicators are both neutral.

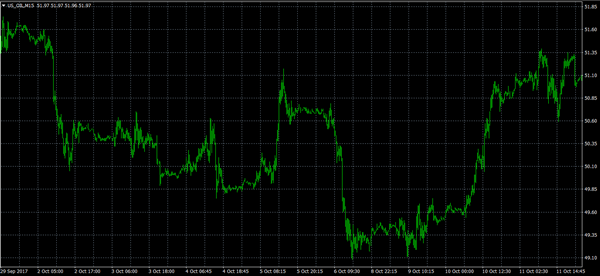
US OIL
US oil prices settled near $52 a barrel Monday on news of record OPEC deal compliance. A gradual reduction in crude supplies, coupled with improving demand, have helped oil prices stabilize north of $50 a barrel in recent months. US crude continues to trade near $52, with the short-term technical indicators signaling continued upside in store.
Aussie Dollar Poised For Further Losses Vs US Dollar
Key Highlights
- The Aussie Dollar made a short-term top near 0.7900 against the US Dollar and moved down.
- There was a break below an important bullish trend line at 0.7850 on the 4-hours chart of AUD/USD.
- Recently in the US, the Chicago Fed National Activity Index for Sep 2017 posted a rise from -0.37 (revised) to 0.17.
- Today, the US Manufacturing PMI for Oct 2017 (Prelim) will be released, which is forecasted to increase from 53.1 to 53.6.
AUDUSD Technical Analysis
The Aussie Dollar after a solid rise towards 0.7900 failed against the US Dollar. The AUD/USD pair started a new downtrend and is currently well below 0.7850.
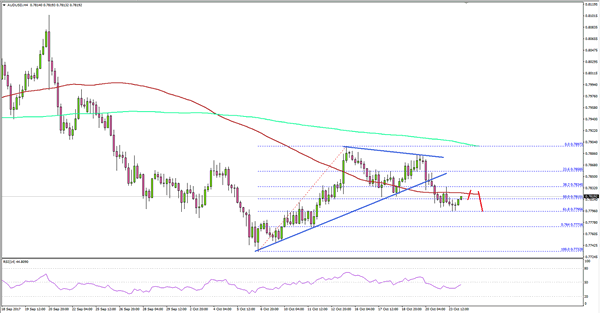
Looking at the 4-hours chart of AUD/USD, there was a break below an important bullish trend line at 0.7850. The pair also moved below the 50% Fib retracement level of the last wave from the 0.7732 low to 0.7897 high.
It seems like the recent trend line break at 0.7850 was crucial and will most likely ignite more losses in the near term. The next support on the downside is at 0.7780 followed by 0.7750. On the upside, resistances are at 0.7830, 0.7850 and 0.7880.
Chicago Fed National Activity Index
Recently in the US, the Chicago Fed National Activity Index (CFNAI) for Sep 2017 was released by Federal Reserve Bank of Chicago. The forecast was slated for a rise from the last reading of -0.31 to -0.10.
The actual result was better than the forecast, as there was a rise in the index to +0.17. On the other hand, the last reading was revised down to -0.37. However, the overall increase was way above the market forecast of 0.21.
The report stated:
All four broad categories of indicators that make up the index increased from August, and three of the four categories made positive contributions to the index in September. The index’s three-month moving average, CFNAI-MA3, was unchanged at –0.16 in September.
Overall, the AUD/USD pair remains at a risk of more declines as long as it is below 0.7840.
Economic Releases to Watch Today
Germany’s Manufacturing PMI for Oct 2017 (Preliminary) – Forecast 60.0, versus 60.6 previous.
Germany’s Services PMI for Oct 2017 (Preliminary) – Forecast 55.6, versus 55.6 previous.
Euro Zone Manufacturing PMI Oct 2017 (Preliminary) – Forecast 57.8, versus 58.1 previous.
Euro Zone Services PMI for Oct 2017 (Preliminary) – Forecast 55.7, versus 55.8 previous.
US Manufacturing PMI for Oct 2017 (Preliminary) – Forecast 53.6, versus 53.1 previous.
US Services PMI for Oct 2017 (Preliminary) – Forecast 55.6, versus 55.3 previous.
Forex: So, Who Will Be the Next Fed Chair?
The markets are turning their attention to who will become the next Chairperson of the Federal Reserve. President Trump recently commented that he is “very, very close” to deciding who will take the position after interviewing 5 candidates. The 5 shortlisted candidates are current Fed Chair Janet Yellen, who has held the position for the past 4 years, she holds a PhD in economics from Yale and has held numerous “Fed” roles, Kevin Warsh a Harvard Law graduate, financier and former governor of the Federal Reserve System, Fed Governor (since 2012) Jerome Powell, a lawyer and former investment banker, John Taylor, a Stanford University economist & Gary Cohn who is Trump’s chief economic advisor. The White House has stated that Trump will make his decision before he leaves for a trip to Asia in November.
With Japanese Prime Minister Shinzo Abe securing a decisive victory for his coalition party in the recent Japanese elections, the markets are looking for confirmation that his economic reforms will continue. With such ultra-easy monetary policy adopted by the Bank of Japan, the Yen has suffered from a degree of risk-off sentiment of late.
On Thursday, the ECB meets and President Mario Draghi is expected to announce the long-awaited start of tapering. The question the markets are posing is how the central bank will pare back a bond-buying program that started over 2 years ago? Currently, monthly bond purchases by the central bank totals some EUR60 Billion, with many analysts predicting that this will drop to between EUR20 to 30 Billion per month. At such a pace, it would make an increase in Eurozone interest rates highly unlikely until 2019. We can expect to see some extended volatility in EUR once the scale of tapering is announced.
EURUSD is slightly higher in early Tuesday trading. Currently, EURUSD is trading around 1.1765.
USDJPY is unchanged in early trading. Currently, USDJPY is trading around 113.35.
GBPUSD is 0.2% higher to currently trade around 1.3220.
Gold is unchanged overnight to currently trade around $1,282.75.
WTI is 0.2% higher in early trading. Currently, WTI is trading around $52.02.
Major data releases for today:
At 08:30 BST, Markit Economics will release German PMI (Composite, Services & Manufacturing) for October. Composite is forecast at 57.6 (from 57.7), Services is forecast to be unchanged at 55.6 and Manufacturing is forecast at 60.0 (from 60.6).
At 09:00 BST, Markit Economics will release Eurozone PMI (Composite, Services & Manufacturing) for October. Composite is forecast at 56.5 (from 56.7), Services is forecast at 55.7 (from 55.8) and Manufacturing is forecast at 57.8 (from 58.1).
At 14:45 BST, Markit Economics will release US PMI (Composite, Services & Manufacturing) for October. Composite previous was 54.8, Services is forecast at 55.2 (from 55.3) and Manufacturing is forecast at 53.5 (from 53.1).
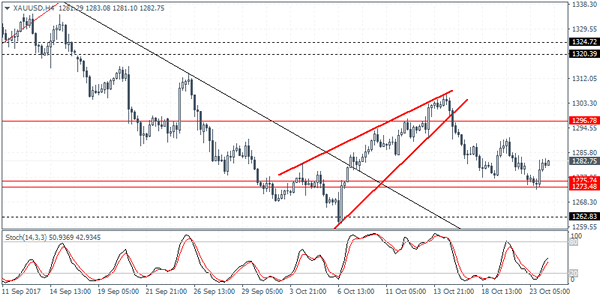
XAUUSD Intraday Analysis
XAUUSD (1282.75): Gold prices maintained the gains yesterday following the decline to the support level at 1275 - 1274 level. In the short term, gold prices might remain supported above this level as price attempts to test the upper resistance near the 1296.50 level. Further gains in gold can be expected on a convincing close above 1296.50 level. In this case, gold prices could be aiming for the 1320 - 1324 level where the next main resistance level resides. To the downside, a breakdown below 1275 - 1274 support will send gold prices lower towards the 1262 handle.
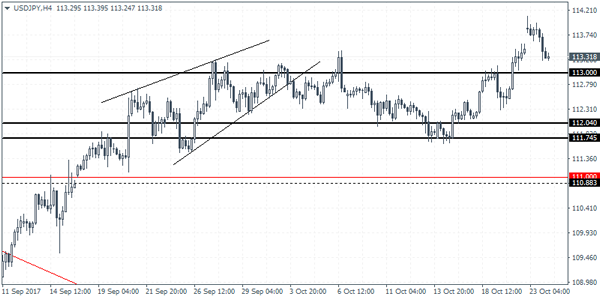
USDJPY Intraday Analysis
USDJPY (113.31): The USDJPY gapped higher yesterday, but price action was seen pushing lower. The bearish close yesterday suggests some downside momentum. Support in USDJPY is seen at 113.00 level which previously served as resistance. Establishing support at 113.00 level will suggest a near term bounce to the upside. However, USDJPY will need to breakout above the previous highs established near 114.00 to extend further gains. The risk of a close below 113.00 is possible. This could push USDJPY back into the range of 113.00 and 111.74.