
Sample Category Title
EUR/USD Daily Outlook
Daily Pivots: (S1) 1.1722; (P) 1.1750 (R1) 1.1775; More...
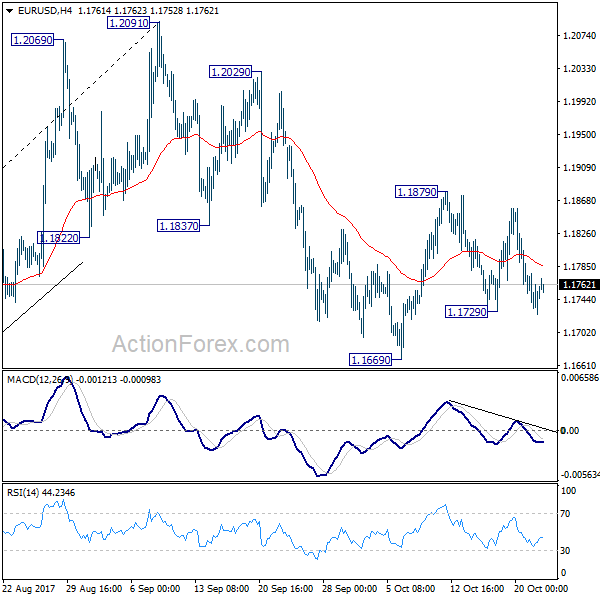
EUR/USD breached 1.1729 but quickly recovered. Intraday bias remains neutral first. On the downside, break of 1.1669 will resume the corrective fall from 1.2091 to 38.2% retracement of 1.0569 to 1.2091 at 1.1510. We'd expect strong support from there to complete the correction. On the upside, break of 1.1879 will revive the case that pull back from 1.2091 has already completed at 1.1669. In such case, intraday bias will be turned back to the upside for retesting 1.2091 high.
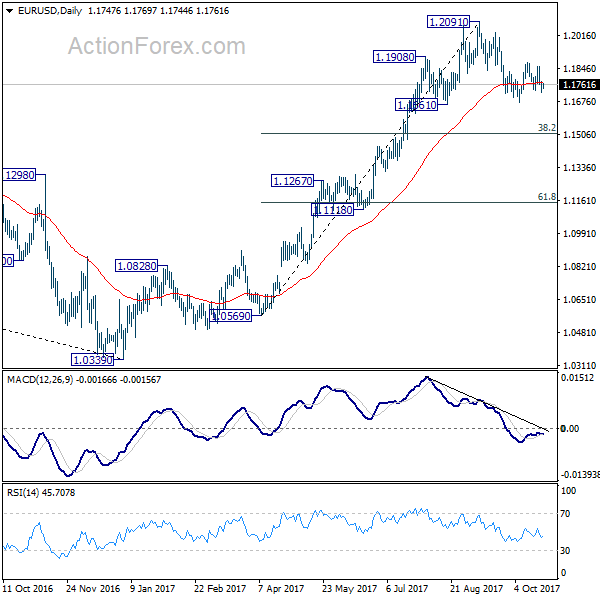
In the bigger picture, rise from medium term bottom at 1.0339 is not finished yet. It's expected to continue after pull back from 1.2091 completes. And, next target will be 38.2% retracement of 1.6039 (2008 high) to 1.0339 (2017 low) at 1.2516. However, it should be noted that there is no confirmation of trend reversal yet. That is, such rebound from 1.0399 could be a correction. And the long term fall from 1.6039 (2008 high) could resume. Hence, we'd be cautious on strong resistance from 1.2516 to limit upside.
GBP/USD Daily Outlook
Daily Pivots: (S1) 1.3160; (P) 1.3193; (R1) 1.3229; More....
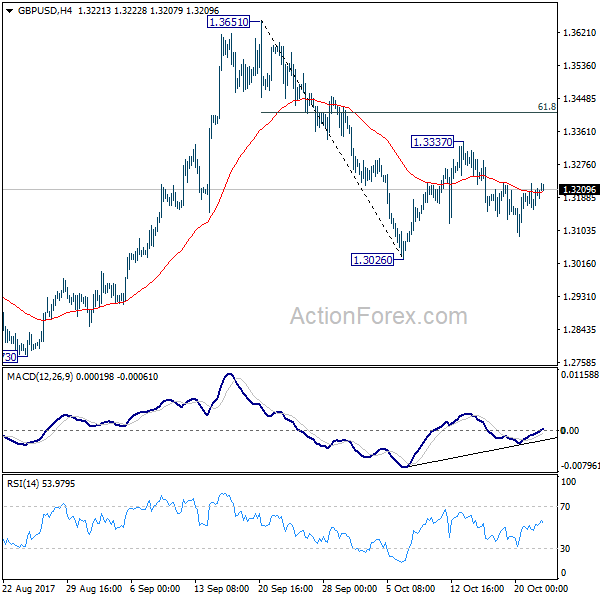
GBP/USD is still bounded in range of 1.3026/3337 and intraday bias remains neutral at this point. On the downside, break of 1.3026 will resume the decline from 1.3651 and target 1.2773 key support level. This will also revive the case of medium term reversal. Meanwhile, on the upside, break of 1.3337 will resume the rebound from 1.3026 to 61.8% retracement of 1.3651 to 1.3026 at 1.3412 and above.
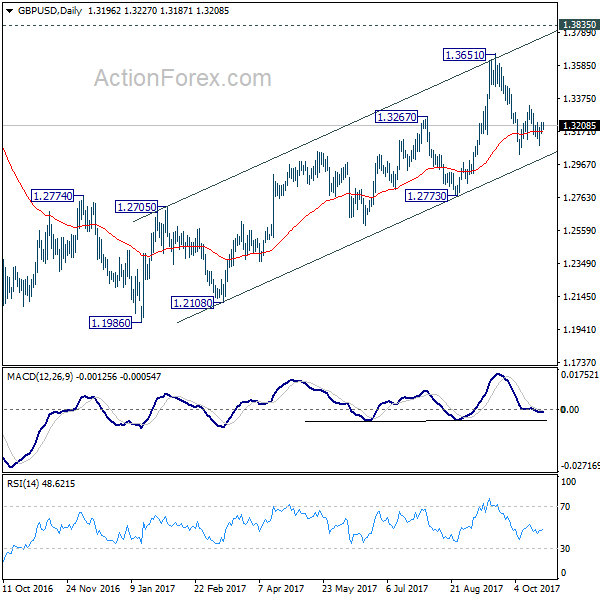
In the bigger picture, while the medium term rebound from 1.1946 was strong, GBP/USD hit strong resistance from the long term falling trend line. Outlook is turned a bit mixed and we'll stay neutral first. On the downside, decisive break of 1.2773 key support will argue that rebound from 1.1946 has completed. The corrective structure of rise from 1.1946 to 1.3651 will in turn suggest that long term down trend is now completed. Break of 1.1946 low should then be seen. On the upside, break of 1.3835 support turned resistance will revive the case of trend reversal and target 38.2% retracement of 2.1161 (2007 high) to 1.1946 (2016 low) at 1.5466.
ECB Ready To Outline Future Of APP
- APP: consensus about 9-month extension at €30 bn/month from January
- Markets too complacent about a more hawkish outcome, such as a shorter lifespan APP?
- Accelerating growth, strengthening jobs market, but tame inflation give ECB room for maneuver
- Curve steepening, but what about EUR/USD?
The ECB indicated that at last month's governing council policy meeting there were ‘very preliminary' discussions on various topics relating to the winding down and eventual exit from QE. These remained mostly confined to asking questions about the pros and cons of various scenarios entailing different extension lengths and purchase amounts that might be considered in the future. This week's ECB policy meeting is expected to deliver significant clarity about the future of the central bank's Asset Purchase Programme with the end-date looming on the horizon. The current forward guidance reads that “net asset purchases, at the current monthly pace of €60 billion, are intended to run until the end of December 2017, or beyond, if necessary, and in any case until the Governing Council sees a sustained adjustment in the path of inflation consistent with its inflation aim.”
APP: Extend and recalibrate
Ahead of the September meeting, we suggested that the ECB could use the playbook they've put together in December 2016. Ten months ago, the central bank was in a more or less similar situation as the APP guidance noted that purchases were intended to run until the end of March 2017, or beyond, if necessary. The ECB then decided to lengthen asset purchases, but also to “recalibrate” the monthly amount (from €80bn/month to €60bn/month) in order to adapt to the changing/improving economic reality
More specifically, we expected the ECB to extend purchases until the end of June 2018 or beyond if necessary with a reduction of asset purchases from €60bn/month to €30bn/month taking effect from the start of 2018.
Over the past week, several “rumours” and comments by ECB governors suggested that consensus has been building around a 9-month extension (until September 2018), while effectively recalibrating the monthly purchases amount to €30 bn. Other sources sounded more concerned about capping the total amount of purchases, around €2.5 tn. At the end of September 2017, total asset holdings amounted to €2.12 tn. Applying the consensus scenario would result in total purchases of €2.57 tn by the end of September 2018, suiting the needs of those worried about the total size of the package. Quite apart from determining what level of QE might be appropriate for the Euro area economy, a slower pace of purchases is becoming necessary for technical reasons as the ECB is running into issue(r) limits for several EMU countries.
The rumoured proposal strikes a balance between doves and hawks. Monetary doves will be pleased as a 9-month extension strengthens the ECB's forward guidance on rates (“we expect rates to remain at their present levels for an extended period of time, and well past the horizon of our net asset purchases”) and buys significant time to prepare for the final element in beginning the normalization process. It would probably prevent any significant rate hike speculation beginning at least until the summer of 2018. Already, the 3-month Euribor forward curve only turns positive by the end of 2019, which is entirely consistent with the rumoured dovish 9-month extension proposal. Another important side-effect of this stance is that it should keep the euro in check, especially in combination with the Fed's gradual rate hike cycle. At the September meeting, the ECB spent an unusually large amount of time discussing the causes and effects of euro strength.
Euribor 3m forward curve only turns positive in 2020, implying very dovish market expectations about ECB policy rates
If the ECB stance is still very dovish, the hawks on the governing council will take some comfort from a significant cut in the monthly purchases which implies that they can be completely ended in a next step and before the end of 2018. German ECB board member Lautenschlaeger for example said “I think it is time next year to gradually but completely roll back net purchases of bonds. For even if we allow our net purchases to come to an end, monetary policy will remain expansive”.
We think that markets are too complacent about the 9- month extension proposal, ignoring the risk of a somewhat less dovish compromise such as a shorter (additional) lifespan for APP. Even a 6-month extension would be a significant commitment from the ECB to keep policy extremely easy in a context of accelerating growth and a strengthening labour market. Extending APP by 9 months while holding on to the sequencing principle (first ending APP, next hiking rates) furthermore increases the risk of the ECB falling behind the curve.
Strong growth, but tame inflation
The mix of a strong EMU growth momentum and tame inflation readings both warrants and allows the ECB room for manoeuvre to implement a gradual and well signalled path for ending APP, rather than having to suddenly hit the brakes. EMU Q2 GDP growth remained above trend (0.6% Q/Q) while the EMU composite PMI has now recorded 55+ readings for nine months running. As a result, in September, the ECB revised up its GDP growth projection for this year from 1.9% to 2.2%, the strongest level since 2007. However, the central bank maintained its previous estimates of 1.8% in 2018 and 1.7% in 2019, implying the Euro area economy is on a glide path to slower but still strong growth in coming years.
There's less confidence on the inflation front. Headline CPI stabilized at 1.5% Y/Y in September, and although it has trended higher over the past year, core inflation remains lacklustre at 1.1% Y/Y. The appreciation of the single currency caused downward revisions of 0.1% in ECB September CPI forecasts for each of the next two years to leave inflation at 1.2% in 2018 and 1.5% in 2019. ECB Praet said recently that “deflationary risks have disappeared and some measures of underlying inflation have ticked up over recent months, but overall inflation developments, despite the solid growth, have remained subdued.” This, the ECB argues means that a very substantial degree of monetary accommodation is still needed.
EMU headline (black) and core (orange) inflation: subdued core inflation main reason for ECB's easy monetary stance
Curve steepening, but what about EUR?
The market reaction to this week's ECB decisions will probably be determined by how they relate to the current consensus expectation of a 9-month extension to the APP at a reduced rate of €30 bn/month from January. Current expectations imply the front end of European yield curves should remain cemented near rock-bottom levels. The longer end of the yield curve could decline in a first reaction because of the additional easing, but we hold our upward bias medium-to-long term. As markets contemplate an important buyer gradually leaving the scene next year and turn their attention to the implications of a very positive growth trend for long-term rates, we believe current rate bullishness will fade. We therefore hold our European steepening bias for the coming months. A global rising yield environment is negative for peripheral bonds, but we expect this impact to remain modest at this stage. Instead, country specific developments may be the main driver of volatility in spreads.
A strongly dovish signal from the ECB (such as a 9 month extension to the APP) should cap the euro. The short term yield differential with US will continue to develop in favour of the greenback in coming months. Historically, there's a strong correlation between currency movements and this differential. From this point of view, the euro correction has some way to go, even if we must admit that the single currency shows strong resilience up until now. We expect that any correction in EUR/USD could extend towards the 1.13-1.15 area
EU/US 2y spread differential (black, LHS) and EUR/USD (orange RHS): Spread will evolve further in favour of US
If the ECB surprises on the hawkish side of expectationssuch as announcing a shorter extension of APP, European yields and EUR/USD will surge higher in a first reaction. However, as long as the interest rate forward guidance remains unchanged, we don't think investors will be lured into strong early rate hike bets suggesting that any repositioning at the front end of the yield curve will remain limited after all. US/EU interest rate differentials will also in the scenario continue to play in favour of the dollar in the next couple of months.
USD/CHF Daily Outlook
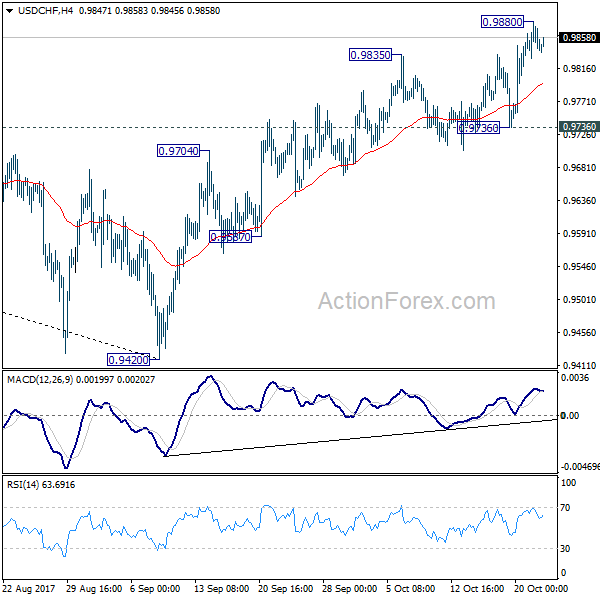
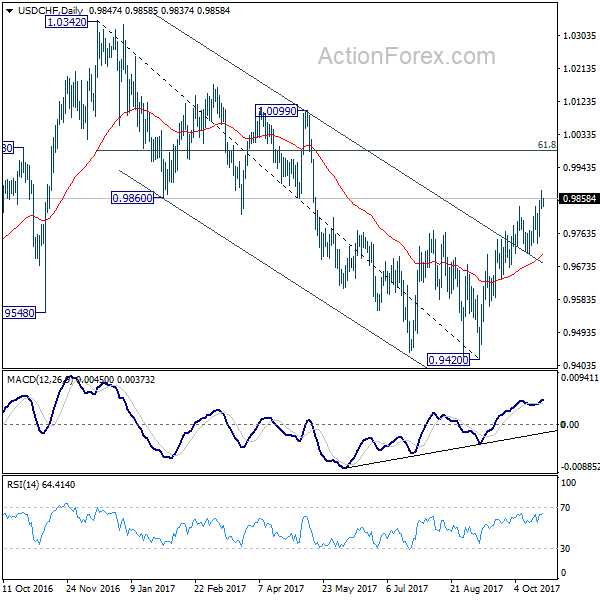
A temporary top is formed at 0.9880 in USD/CHF and intraday bias is turned neutral first. Near term outlook remains bullish as long as 0.9736 support holds. Medium term fall from 1.0342 should have completed at 0.9420 already. Above 0.9880 will target 61.8% retracement of 1.0342 to 0.9420 at 0.9990. Sustained break there will pave the way to retest 1.0342 high. However, break of 0.9736 support will mixed up the near term outlook and turn bias back to the downside for 0.9587 support instead.
Daily Pivots: (S1) 0.9826; (P) 0.9854; (R1) 0.9876; More....
A temporary top is formed at 0.9880 in USD/CHF and intraday bias is turned neutral first. Near term outlook remains bullish as long as 0.9736 support holds. Medium term fall from 1.0342 should have completed at 0.9420 already. Above 0.9880 will target 61.8% retracement of 1.0342 to 0.9420 at 0.9990. Sustained break there will pave the way to retest 1.0342 high. However, break of 0.9736 support will mixed up the near term outlook and turn bias back to the downside for 0.9587 support instead.
In the bigger picture, current development suggests that USD/CHF has defended 0.9443 (2016 low) key support level again. Rise from 0.9420 could develop into a medium term move and target a test on 1.0342 high. This represents the upper end of a long term range that started back in 2015. On the downside, break of 0.9587 support is now needed to indicate completion of the rise from 0.9420. Otherwise, further rally will remain in favor in medium term.
USD/JPY Daily Outlook
Daily Pivots: (S1) 113.08; (P) 113.59; (R1) 113.93; More...
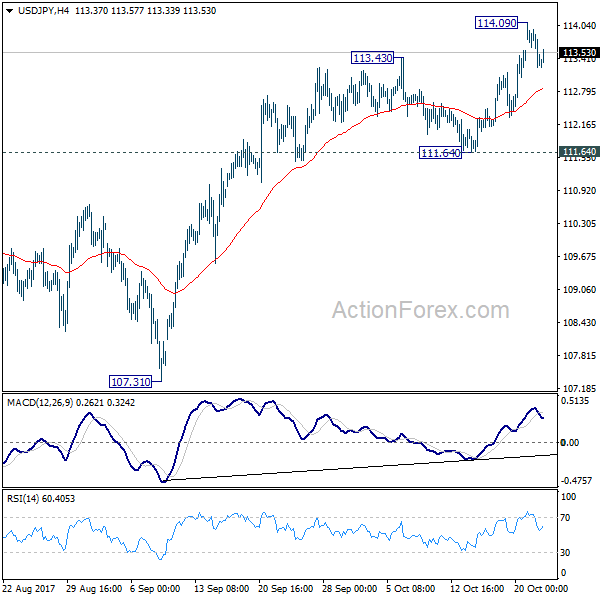
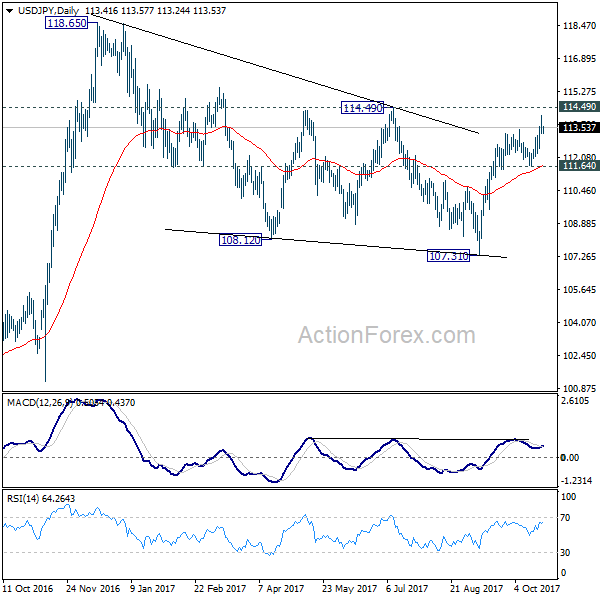
A temporary top is in place at 114.09 and intraday bias is turned neutral first. In any case, outlook will remain mildly bullish as long as 111.64 support holds. Above 114.09 will target 114.49 resistance next. Decisive break there will confirm that correction pattern from 118.65 has completed at 107.31 already. And USD/JPY should then target a test on 118.65.
In the bigger picture, medium term rise from 98.97 (2016 low) is not completed yet. It should resume after corrective fall from 118.65 completed. Break of 114.49 resistance will likely resume the rise to 61.8% projection of 98.97 to 118.65 from 107.31 at 119.47 first. Firm break there will pave the way to 100% projection at 126.99. This will be the key level to decide whether long term up trend is resuming.
Market Update – Asian Session: ECB Ready To Outline Future Of APP
Asia Summary
Following the negative leads out of the US, Asian equity markets opened mostly lower. The Nikkei 225 opened down by 0.1%, amid weakness in shares of Fast Retailing.
However, the index has since pared losses as it attempts to gain for the 16th straight session. Japanese ‘mega-banks’ have added on to their post-elections gains. Strength has also been seen among steel makers and trading companies. Japanese electronic parts makers are trading mostly higher, after it was reported that Q2 orders for the sector may have risen by 17%.
In the tech sector, Rakuten has declined by over 2% following a cautious broker note. South Korean chipmaker Hynix has declined by over 2%, after gaining over 4% in the prior session.
Banks in South Korea have rebounded on today’s session, following the weakness seen yesterday and rise in government bond yields. Korea’s 3-year bond yield has risen over 3bps on the session.
Energy companies in Australia are generally trading lower following yesterday’s decline in oil prices. Shares of Santos have declined by over 0.5%. Japara Healthcare has gained over 7% in Sydney, after Moelis Australia disclosed an ~10% stake.
The Hang Seng opened the session lower, as furniture products firm Man Wah Holdings has lost over 15%, after cutting its forecast, primarily due to the appreciation of the Chinese yuan. The index has since pared losses. The Property and Construction sub-index has risen by over 0.5% on the session.
In currencies, the Kiwi has moved between gains and losses, as the new Labour/NZ First coalition government outlined some of its priorities, which include a higher minimum wage, review of the RBNZ’s mandate and a ban on the purchase of existing homes by foreigners.
Looking, ahead the Aussie has traded slightly higher ahead of tomorrow’s release of Q3 CPI data. Japanese companies expected to report earnings today include Canon and Nidec. Out of China, companies including CNOOC, China CITIC Bank and China Shipbuilding Group may report earnings.
US companies expected to report today include 3M, AT&T, Biogen, Caterpillar, Chipotle, Corning, GM, Lockheed Martin and McDonald’s. Following Monday’s US equity close, Whirlpool declined by over 6%, after reporting weaker than expected quarterly results and reducing its FY outlook.
Key economic data
(JP) JAPAN OCT FLASH PMI MANUFACTURING: 52.5 V 52.9 FINAL
Speakers and Press
Japan
(JP) Japan Econ Min Motegi: To host next round of TPP talks Oct 30-Nov 1st
(JP) Japan Fin Min Aso: Markets support Govt's economic policies; Election results saw stocks go up
(JP) Japan Electronic Parts Makers Q2 Orders +17% y/y to ¥1.57T (quarterly record)- Japanese Press
Korea
(KR) South Korea, US and Japan start joint missile warning exercise
China/Hong Kong
(CN) Singapore SGX official: Seeing less China intervention in yuan market since 2016
(CN) China President Xi ideology to enter the constitution as "Xi Jiping Thought" and elevate him to the same level as Mao and Deng Xiaoping – press
(CN) China President Xi now included in draft version of amended China Communist Party constitution; Adds Xi Jing Ping thought into charter - Chinese press
(CN) The gap between China aggregate financing and M2 money supply rise will narrow - Chinese press
(HK) Hong Kong Monetary Authority (HKMA) said the discount between HKD Hibor and USD Libor is not of concern
Australia/New Zealand
(NZ) New Zealand Labour Leader Ardern signs coalition agreement with NZ First: You will see significant increase in minimum wage
Asian Equity Indices/Futures (00:00ET)
Nikkei +0.04%, Hang Seng +0.03%; Shanghai Composite +0.08%; ASX200 -0.0%, Kospi +0.2%
Equity Futures: S&P500 +0.1%; Nasdaq100 +0.1%, Dax +0.1%; FTSE100 +0.1%
FX ranges/Commodities/Fixed Income (00:00ET)
EUR 1.1770-1.1747; JPY 113.49-113.25; AUD 0.7825-0.7807;NZD 0.7004-0.6935
Dec Gold +0.2% at $1,283/oz; Dec Crude Oil +0.2% at $51.98/brl; Dec Copper +1.3% at $3.22/lb
USD/CNY *(CN) PBOC SETS YUAN REFERENCE RATE AT 6.6268 V 6.6205 PRIOR
(CN) PBoC OMO: Injects CNY250B in 7 and 14-day reverse repos v CNY200B injected prior; injects net CNY140B v CNY140B prior (6th consecutive injections, longest since July)
(TH) Thailand Central bank sells combined THB60B in 3-month and 6-month bonds
Equities notable movers
Australia/New Zealand
ESV.AU Completes ~£15.8M institutional component of entitlement offering; +21%
MML.AU Reports Q1 gold production 24.9K oz v 23.8K q/q at avg head grade of 6.59 g/t; ASIC $973/oz v $1,180 q/q; +15.6%
KGN.AU CEO Ruslan Kogan sells 3M shares at A$4.25/shr; -13%
China/Hong Kong
606.HK Announces intent to sell COFCO Biofuel and COFCO Biochemical for HK$8.58B; declares special dividend; +8.5%
1999.HK Issues profit warning; sees H1 -10% profit y/y – filing; -16.5%
Korea
005930.KR Said to consider plan to spend KRW20T on dividends and buybacks in 2017 - South Korean Press
Japan
2432.JP Strength attributed to Nintendo's announcement on Animal Crossing; +7%
6502.JP CEO: Considering measures if chip unit sale is not completed by the end of March; -0.6%
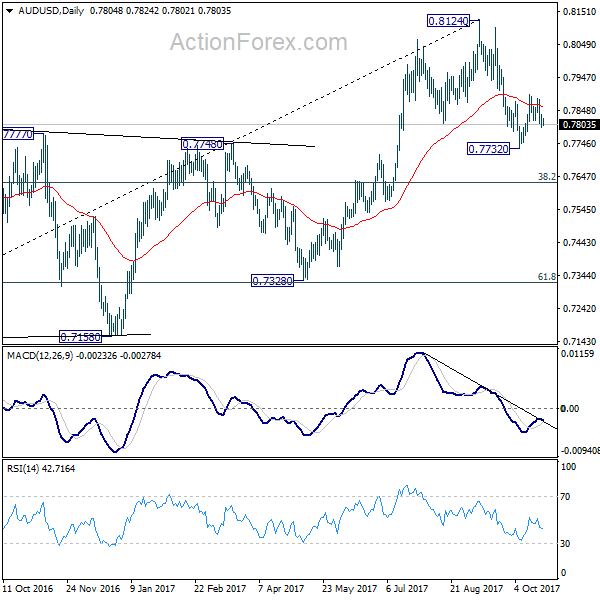
AUD/USD Daily Outlook
Daily Pivots: (S1) 0.7789; (P) 0.7812; (R1) 0.7827; More...
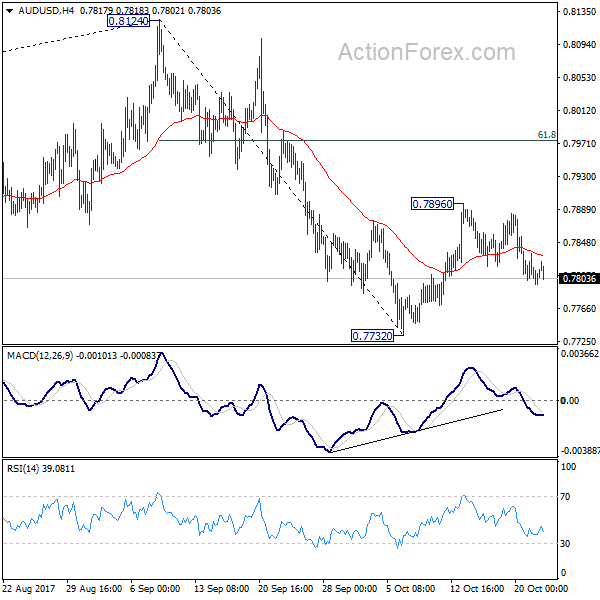
For the moment, intraday bias in AUD/USD stays neutral first. On the downside, break of 0.7732 will resume the decline from 0.8124 and target medium term fibonacci level at 0.7628 first. This will also affirm the case of medium term reversal. On the upside, however, break of 0.7896 will extend the rebound to 61.8% retracement of 0.8124 to 0.7732 at 0.7974 and possibly above.
In the bigger picture, rise from 0.6826 medium term bottom is seen as corrective pattern. Current development suggests that it might be completed with three waves up to 0.8124 already. Break of 38.2% retracement of 0.6826 to 0.8124 at 0.7628 will firm this bearish case. And, decisive break of 0.7328 key cluster support (61.8% retracement at 0.7322) will confirm and bring retest of 0.6826 low. In case rise from 0.6826 resumes and extends, strong resistance should be seen at 38.2% retracement of 1.1079 to 0.6826 at 0.8451 to limit upside.
Aussie Dollar Trading On A Stronger Footing This Morning
For the 24 hours to 23:00 GMT, the AUD declined 0.1% against the USD and closed at 0.7811.
LME Copper prices declined 0.7% or $49.5/MT to $6959.0/MT. Aluminium prices declined 1.2% or $25.5/MT to $2133.5/MT.
In the Asian session, at GMT0300, the pair is trading at 0.7820, with the AUD trading 0.12% higher against the USD from yesterday’s close.
The pair is expected to find support at 0.7799, and a fall through could take it to the next support level of 0.7778. The pair is expected to find its first resistance at 0.7838, and a rise through could take it to the next resistance level of 0.7856.
Moving ahead, investors will focus on Australia’s consumer price index for 3Q 2017, slated to release overnight.
The currency pair is trading above its 20 Hr moving average and showing convergence with its 50 Hr moving average.

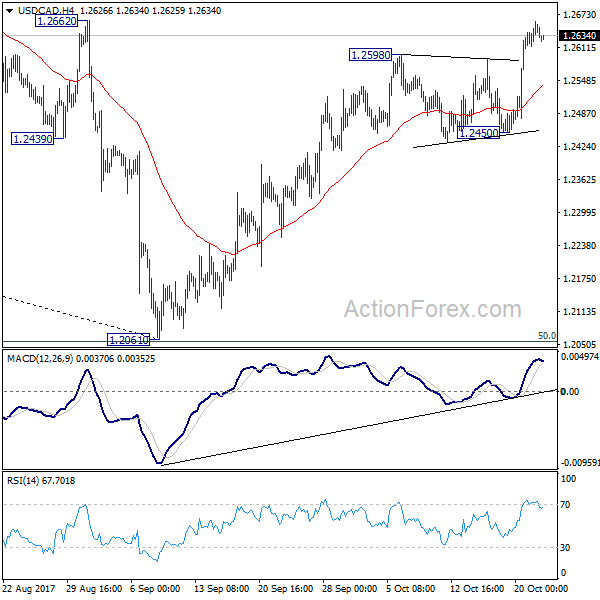
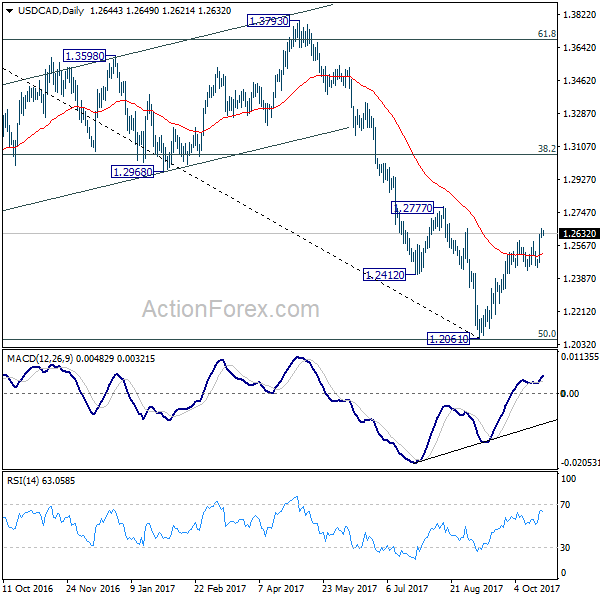
USD/CAD Daily Outlook
Daily Pivots: (S1) 1.2619; (P) 1.2639; (R1) 1.2665; More....
At this point, intraday bias remains on the upside for further rally. Current rebound from 1.2061 should extend to 1.2777 resistance first. Decisive break there will confirm medium term reversal and target 38.2% retracement of 1.4689 to 1.2061 at 1.3065 next. On the downside, break of 1.2450 support is needed to indicate completion of the rebound. Otherwise, outlook will remain mildly bullish in case of retreat.
In the bigger picture, USD/CAD should have defended 50% retracement of 0.9406 (2011 low) to 1.4869 (2016 high) at 1.2048. And with 1.2048 intact, we'd favor the case that fall from 1.4689 is a correction. Break of 1.2777 will further affirm this bullish case. That is, larger up trend from 0.9406 is not completed. And in that case, USD/CAD should target 1.3793 key resistance next. However, on the other hand, firm break of 1.2048 will indicate that fall from 1.4689 is at least a medium term down trend and should target 61.8% retracement at 1.1424 and below.
Dollar Paring Gains as Traders Speculate on Who’s the Next Fed Chair is
Dollar trades generally lower in quiet markets today. Economic data released this week so far are generally shrugged off by traders. The more important events are BoC and ECB meeting, as well as UK and US GDP. Waiting for the key events, traders seem to be spending their time on speculating who will US President Donald Trump nominate for the post of Fed chair. Current Fed chair Janet Yellen is still in the race and would provide status quo stability. But it's clear that Yellen is never a favorite of Trump. Fed Governor Jerome Powell is seen as the favorite by bookies, as he has knowledge of Fed and monetary policy. Stanford University economists John Taylor is so far the dark horse. Former Fed governor Kevin Warsh and White House economic advisor Gary Cohn are out of the race already.
Speculations of Nov BoE hike cooled mildly
In UK, speculations of a November rate hike cooled mildly since a string of weaker than expected data, and some dovish comments from MPC members. Markets are now pricing in 78% chance of a 25bps hike in November, down from near 90% at the beginning of this month. The dilemma for BoE is that inflation has surged to 3% due to depreciation of Pound's exchange wage. But that hasn't really transferred into wage growth. And recent data shows that retail sales are faltering. And in the background, the deadlock of Brexit negotiation is still unresolved, and that would tie businesses' hands in investing. But still, we'd like to point out that a 25bps hike will just bring the Bank Rate back to pre-Brexit referendum level. Thereafter, BoE will wait till there's some significant progress in Brexit talks before acting again. Hike or not, Sterling could face some pressure against Dollar afterwards.
Talking about Brexit, UK Prime Minister Theresa May said that "important progress" was made at last week's EU summit. And, she had a "degree of confidence" of achieving sufficient progress to move to to trade talks by December. It's reported by some German newspaper, and then UK press, that May was tired, exhausted, and begged for help in last week's summit. But European Commission Jean-Claude Juncker rubbished those reports. He said that "I had an excellent working dinner with Theresa May. She was in good shape, she was noted tired, she was fighting, as is her duty, so everything for me was OK."
Japan PMI manufacturing dropped
In Japan, Nikkei continues to push higher today, riding on Prime Minister Shinzo Abe's landslide victory in Sunday's snap election. At the time of writing, Nikkei is trading up 57pts, or 0.25%. Japan PMI manufacturing dropped to 52.5 in October, down from 52.9, and missed expectation of 53.1. Nonetheless, that's still the 14th straight months of expansionary reading. Markit noted that "although still improving solidly, the Japanese manufacturing sector appeared to lose some momentum in October, as growth eased from September's four-month high." And, "softer expansions were seen for both output and new orders." The output component dropped to 52.6, down from 53.2. New orders dropped to 52.4, down from 53.4. Expectation on output also dropped to 57.5, down from 61.2.
Looking ahead
PMI data will be the main focuses today with Eurozone PMIs featured in European session. US will also release PMIs later today.
USD/CAD Daily Outlook
Daily Pivots: (S1) 1.2619; (P) 1.2639; (R1) 1.2665; More....
At this point, intraday bias remains on the upside for further rally. Current rebound from 1.2061 should extend to 1.2777 resistance first. Decisive break there will confirm medium term reversal and target 38.2% retracement of 1.4689 to 1.2061 at 1.3065 next. On the downside, break of 1.2450 support is needed to indicate completion of the rebound. Otherwise, outlook will remain mildly bullish in case of retreat.
In the bigger picture, USD/CAD should have defended 50% retracement of 0.9406 (2011 low) to 1.4869 (2016 high) at 1.2048. And with 1.2048 intact, we'd favor the case that fall from 1.4689 is a correction. Break of 1.2777 will further affirm this bullish case. That is, larger up trend from 0.9406 is not completed. And in that case, USD/CAD should target 1.3793 key resistance next. However, on the other hand, firm break of 1.2048 will indicate that fall from 1.4689 is at least a medium term down trend and should target 61.8% retracement at 1.1424 and below.
Economic Indicators Update
| GMT | Ccy | Events | Actual | Forecast | Previous | Revised |
|---|---|---|---|---|---|---|
| 00:30 | JPY | PMI Manufacturing Oct P | 52.5 | 53.1 | 52.9 | |
| 07:00 | EUR | France Manufacturing PMI Oct P | 56 | 56.1 | ||
| 07:00 | EUR | France Services PMI Oct P | 56.9 | 57 | ||
| 07:30 | EUR | Germany Manufacturing PMI Oct P | 60 | 60.6 | ||
| 07:30 | EUR | Germany Services PMI Oct P | 55.5 | 55.6 | ||
| 08:00 | EUR | Eurozone Manufacturing PMI Oct P | 57.8 | 58.1 | ||
| 08:00 | EUR | Eurozone Services PMI Oct P | 55.6 | 55.8 | ||
| 13:45 | USD | US Manufacturing PMI Oct P | 53.2 | 53.1 | ||
| 13:45 | USD | US Services PMI Oct P | 55.1 | 55.3 |