Sample Category Title
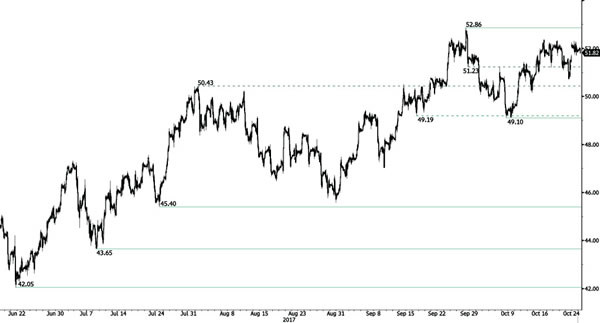
CRUDE OIL Testing Resistance Area
Crude oil bounced hard back within range defined by support at 50.43 and the strong resistance lies at 52.86 (28/09/2017). Expected to show continued increase within this range.
In the long-term, crude oil has recovered after its sharp decline last year. However, we consider that further weakness are very likely. For the time being the pair lies in an upside momentum. Strong support lies at 35.24 (05/04/2016) while resistance can now be found at 55.24 (03/01/2017 high).
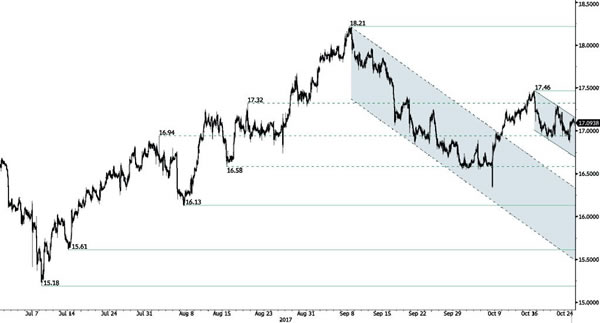
SILVER Volatility Within Downtrend Channel
Silver is again moving up and down. Hourly support can be founds at 16.88. Hourly resistance is given at 17.46 (13/10/2017 high). Additional support can be found at 16.13 (06/10/2017 low). Expected to show further weakness.
In the long-term, the trend is rater negative. Further downsides are very likely. Resistance is located at 25.11 (28/08/2013 high). Strong support can be found at 11.75 (20/04/2009).
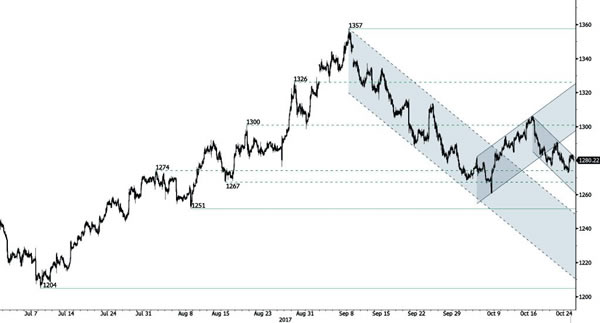
GOLD Bearish Momentum
Gold remains weak. The precious metal is located within a downtrend channel. The broken support at 1284 confirms an underlying bearish trend. Strong support lies at a distance at 1267 then 1204 (10/07/2017 high). Resistance is now located at 1288 (20/10/2017).
In the long-term, the technical structure suggests that there is a growing upside momentum. A break of 1392 (17/03/2014) is necessary ton confirm it, A major support can be found at 1045 (05/02/2010 low).
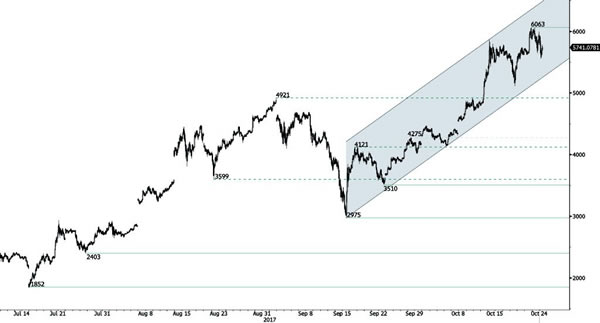
BITCOIN Continued Consolidation Near Highs
Bitcoin has bounced strongly suggesting a near term test of 5866 (all-time high). Strong support stands very far at 2975 (22/08/2017 low). Bitcoin si ready to set up new all-time high. The road is wide open for further increase. In the short-term, the digital currency should monitor $6000.
In the long-term, the digital currency has had an exponential growth. There are decent likelihood that the asset will reach $10'000.
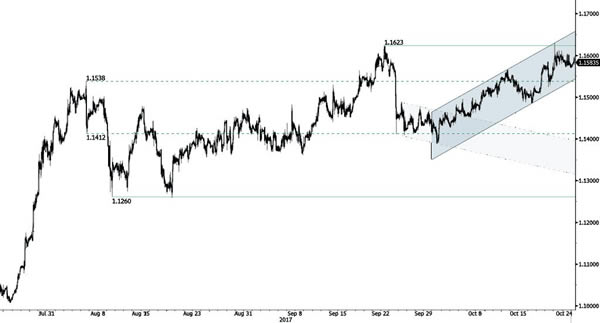
EUR/CHF Ready To Monitor Once More Resistance At 1.1623
EUR/CHF recovery bounce continues testing 1.1623 (15/09/2017 high). Support is given at 1.1388 (02/09/2017 low). Rising channel suggest further bullish momentum.
In the longer term, the technical structure has reversed. Strong resistance is given at 1.20 (level before the unpeg). Yet, the ECB's QE programme is likely to cause persistent selling pressures on the euro, which should weigh on EUR/CHF. Supports can be found at 1.0184 (28/01/2015 low) and 1.0082 (27/01/2015 low).
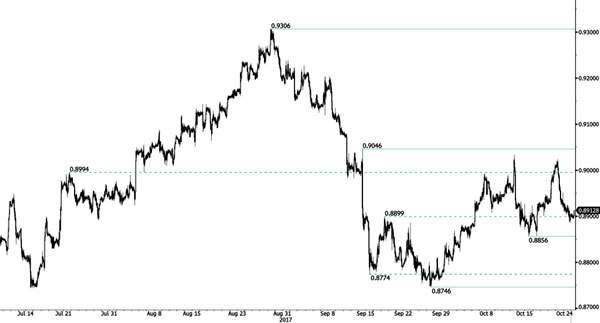
EUR/GBP Consolidating Above 0.89
EUR/GBP continues to bounce higher yet not important resistances have been broken (quick test). The pair is back below former resistance at 0.8899 (19/09/2017 low). Hourly support is given at a distance at 0.8746 (27/09/2017 low).
In the long-term, the pair has largely recovered from recent lows in 2015. The technical structure suggests a growing upside momentum. The pair is trading above from its 200 DMA. Strong resistance can be found at 0.9500 (psychological level).
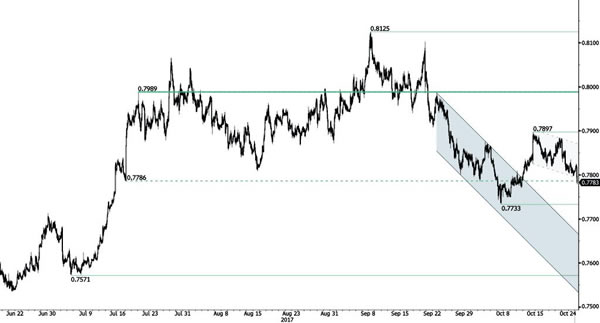
AUD/USD Bearish Breakout
AUD/USD broke out short-term downtrend momentum. Hourly resistance is given at 0.7897 (13/10/2017 high). Key support lies at at 0.7733 (06/10/2017 low). Expected to show continued decline.
In the long-term, the trend is turning positive. Key supports stands at 0.6009 (31/10/2008 low) . A break of the key resistance at 0.8164 (14/05/2015 high) is needed to invalidate our long-term bearish view.
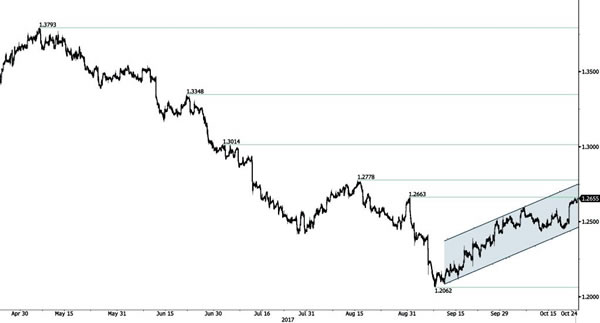
USD/CAD Challenging Resistance At 1.2663
USD/CAD bullish drive suggests a challenge to 1.2663 horizontal resistance. Hourly support lies at 1.2331 (26/09/2017 high). Expected to show continued short-term bullish pressures within uptrend channel.
In the longer term, the pair has broken longterm support that can be found at 1.2461 (16/03/2015 low). Strong resistance is given at 1.4690 (22/01/2016 high). The pair is likely to head further lower.
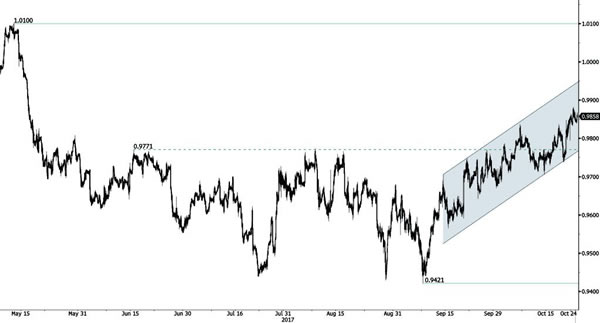
USD/CHF Riding Bullish Momentum
USD/CHF is pushing higher. The technical structure suggests an improving short-term buying interest. Expected to show continued bullish pressures within uptrend channel. Hourly support stands at 0.9712 (12/10/2017 low).
In the long-term, the pair is still trading in range since 2011 despite some turmoil when the SNB unpegged the CHF. Key support can be found 0.8986 (30/01/2015 low). The technical structure favours nonetheless a long term bullish bias since the unpeg in January 2015.
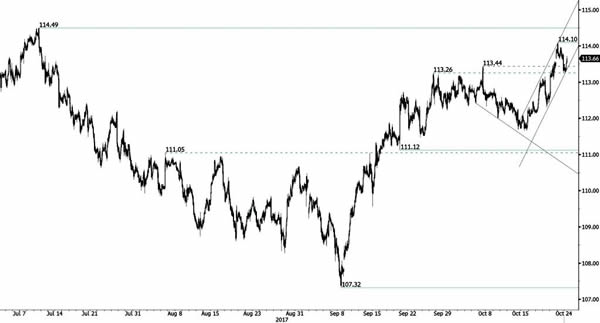
USD/JPY Bearish Consolidation Within Short-Term Uptrend
USD/JPY has bounced back after setting a new hourly resistance at 114.10 (23/10/2017 high). Next key resistance can be found at 114.49 (11/07/2017 high). Support is located at 111.12 (20/09/2017 low).
We favor a long-term bearish bias. Support is now given at 99.02 (10/08/2013 low). A gradual rise towards the major resistance at 125.86 (05/06/2015 high) seems unlikely. Expected to decline further support at 93.79 (13/06/2013 low).