
Sample Category Title
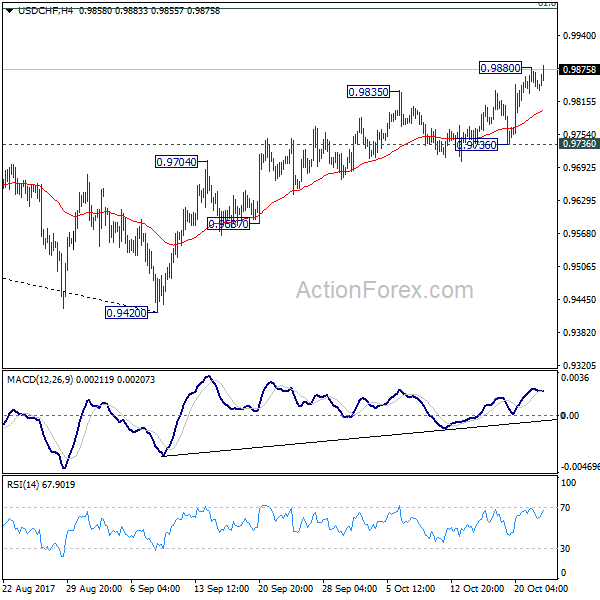
USD/CHF Mid-Day Outlook
Daily Pivots: (S1) 0.9826; (P) 0.9854; (R1) 0.9876; More....
Breach of 0.9880 suggests that USD/CHF's rally is resuming. Intraday bias is back on the upside. As noted before, medium term fall from 1.0342 should have completed at 0.9420 already. Current rally should target 61.8% retracement of 1.0342 to 0.9420 at 0.9990. Sustained break there will pave the way to retest 1.0342 high. In any case, outlook will remain bullish as long as 0.9736 support holds.
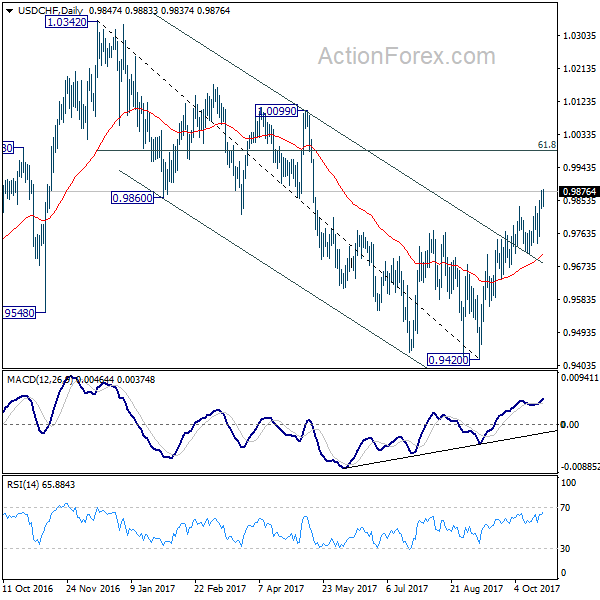
In the bigger picture, current development suggests that USD/CHF has defended 0.9443 (2016 low) key support level again. Rise from 0.9420 could develop into a medium term move and target a test on 1.0342 high. This represents the upper end of a long term range that started back in 2015. On the downside, break of 0.9587 support is now needed to indicate completion of the rise from 0.9420. Otherwise, further rally will remain in favor in medium term.
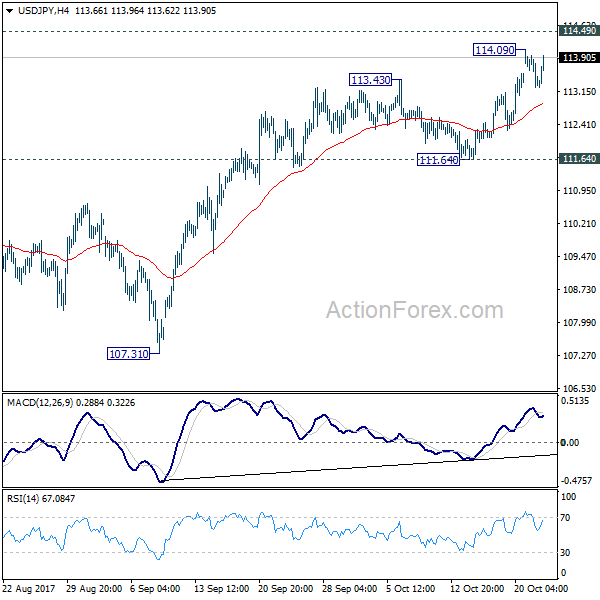
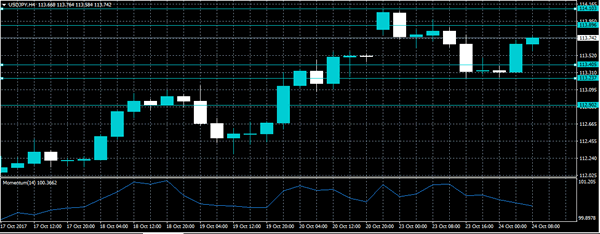
USD/JPY Mid-Day Outlook
Daily Pivots: (S1) 113.08; (P) 113.59; (R1) 113.93; More...
Intraday bias in USD/JPY remains neutral for the moment. Some more consolidation could be seen below 114.09 temporary top. But in any case, will remain mildly bullish as long as 111.64 support holds. Above 114.09 will target 114.49 resistance next. Decisive break there will confirm that correction pattern from 118.65 has completed at 107.31 already. And USD/JPY should then target a test on 118.65.
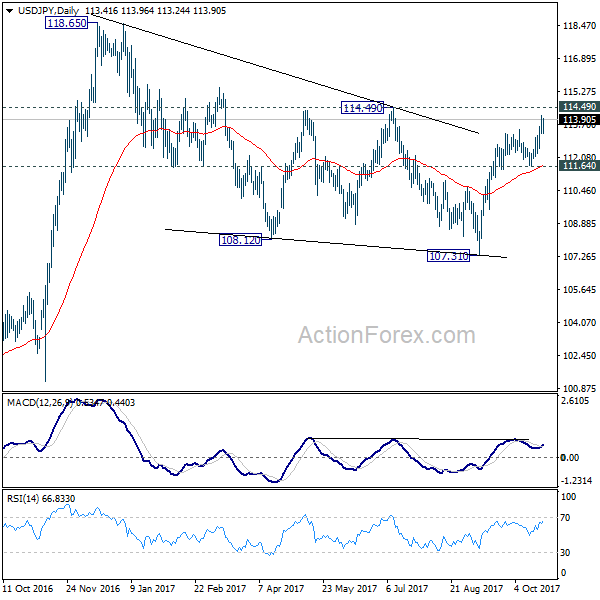
In the bigger picture, medium term rise from 98.97 (2016 low) is not completed yet. It should resume after corrective fall from 118.65 completed. Break of 114.49 resistance will likely resume the rise to 61.8% projection of 98.97 to 118.65 from 107.31 at 119.47 first. Firm break there will pave the way to 100% projection at 126.99. This will be the key level to decide whether long term up trend is resuming.
Dollar Stays Firm on Tax Cut Hope, Euro Supported by Solid PMIs
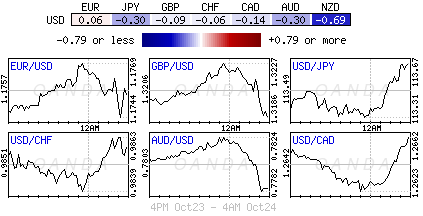
Dollar and Euro are both trading firm today. The greenback is supported by hope of passing Republican's tax plan by the end of the year. US President Donald Trump will visit Senate Republicans for lunch today for talks on tax cut. Meanwhile, Solid PMI data fro Eurozone supports that case for ECB to announce tapering later this week. New Zealand Dollar trades broadly lower as markets react negatively to the labor led coalition's policies. Yen and Aussie follows closely and as the second and third weakest.
Eurozone PMIs solid, support ECB tapering
Eurozone PMI manufacturing rose to 58.4 in October, up from 58.1, beat expectation of 57.8. Eurozone PMI services, however, dropped to 54.9, down from 55.8, below expectation of 55.6. Germany PMI manufacturing dropped to 60.5, down from 60.6, but beat expectation of 60.0. Germany PMI services dropped to 55.2, down from 55.6, below expectation of 55.5. France PMI manufacturing rose to 56.7, up from 56.1, beat expectation of 56.0. France PMI services rose to 57.4, up from 57.0, beat expectation of 56.9.
Markit noted that "firms don't appear to have been unduly affected by recent euro strength, with growth of new export orders accelerating in October." And, "healthy demand in export markets appears to be outweighing any negative currency impacts." The solid set of PMI data shouldn't alter ECB's plan to announce tapering of asset purchases later in the week.
BoE Deputy Cunliffe: Economy has "clearly slowed"
BoE Deputy Governor Jon Cunliffe warned that the economy has "clearly slowed" this year. That's due to "the squeeze we have seen on real incomes and imported inflation from the depreciation [sterling] that has come in. And pay has remained relatively subdued." He pointed out that interest rates "will not need to go up by as far and as fast as they did before the crisis". Still, "over the forecast period of three years rates will need to rise". However, he emphasized that the exact timing of rate hike is "a more open question".
Japan PMI manufacturing dropped
In Japan, Nikkei continues to push higher today, riding on Prime Minister Shinzo Abe's landslide victory in Sunday's snap election. At the time of writing, Nikkei is trading up 57pts, or 0.25%. Japan PMI manufacturing dropped to 52.5 in October, down from 52.9, and missed expectation of 53.1. Nonetheless, that's still the 14th straight months of expansionary reading. Markit noted that "although still improving solidly, the Japanese manufacturing sector appeared to lose some momentum in October, as growth eased from September's four-month high." And, "softer expansions were seen for both output and new orders." The output component dropped to 52.6, down from 53.2. New orders dropped to 52.4, down from 53.4. Expectation on output also dropped to 57.5, down from 61.2.
BoJ to lower inflation forecasts again
Bloomberg reports today, quoting unnamed source, that BoJ is considering to lower its inflation projection again in the quarterly report to be released next week. From latest forecast, BoJ estimate core CPI to rise 1.1% for the fiscal year ending in March 2018. Downgrading the inflation forecast will reinforce the view that BoJ would continue with the ultra-loose monetary policy. That will also come just after Prime Minister Shinzo Abe got fresh mandate for his Abenomics.
USD/JPY Mid-Day Outlook
Daily Pivots: (S1) 113.08; (P) 113.59; (R1) 113.93; More...
Intraday bias in USD/JPY remains neutral for the moment. Some more consolidation could be seen below 114.09 temporary top. But in any case, will remain mildly bullish as long as 111.64 support holds. Above 114.09 will target 114.49 resistance next. Decisive break there will confirm that correction pattern from 118.65 has completed at 107.31 already. And USD/JPY should then target a test on 118.65.
In the bigger picture, medium term rise from 98.97 (2016 low) is not completed yet. It should resume after corrective fall from 118.65 completed. Break of 114.49 resistance will likely resume the rise to 61.8% projection of 98.97 to 118.65 from 107.31 at 119.47 first. Firm break there will pave the way to 100% projection at 126.99. This will be the key level to decide whether long term up trend is resuming.
Economic Indicators Update
| GMT | Ccy | Events | Actual | Forecast | Previous | Revised |
|---|---|---|---|---|---|---|
| 00:30 | JPY | PMI Manufacturing Oct P | 52.5 | 53.1 | 52.9 | |
| 07:00 | EUR | France Manufacturing PMI Oct P | 56.7 | 56 | 56.1 | |
| 07:00 | EUR | France Services PMI Oct P | 57.4 | 56.9 | 57 | |
| 07:30 | EUR | Germany Manufacturing PMI Oct P | 60.5 | 60 | 60.6 | |
| 07:30 | EUR | Germany Services PMI Oct P | 55.2 | 55.5 | 55.6 | |
| 08:00 | EUR | Eurozone Manufacturing PMI Oct P | 58.4 | 57.8 | 58.1 | |
| 08:00 | EUR | Eurozone Services PMI Oct P | 54.9 | 55.6 | 55.8 | |
| 13:45 | USD | US Manufacturing PMI Oct P | 53.2 | 53.1 | ||
| 13:45 | USD | US Services PMI Oct P | 55.1 | 55.3 |
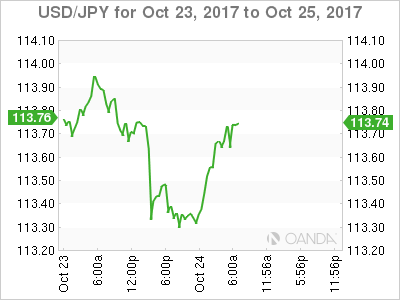
USDJPY Turns Bullish Above 113.40
The U.S dollar has moved higher against the Japanese Yen during the European trading session, hitting 113.77, as intraday sellers failed to contain price below the key 113.40 level. The pair currently sits around the price-highs of the day, as traders await the release of United States Manufacturing and Service PMI data for the month of October.
The USDJPY pair is increasingly bullish while trading above the key 113.40 technical level. Further bullish advancement towards 113.89 and 114.10 remains likely. Extended weekly resistance is found at the 114.43 and 115.00 levels.
Should intraday sellers push price-action below the key 113.40 level for a sustained basis, a deeper decline towards the 113.23 and 112.89 should follow.
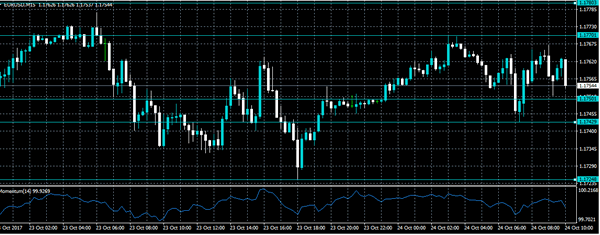
EURUSD Still Bearish Below 1.1770
The euro continues to consolidate at lower levels against the U.S dollar, as traders remain cautious ahead of a number of key risk events this week. The EURUSD pair currently trades around the 1.1750 level, despite the Eurozone manufacturing PMI earlier beating expectations, with a solid 58.6 reading. Traders now await the release of U.S PMI Manufacturing and Services data, during the upcoming U.S session.
The EURUSD pair remains intraday bearish while trading below the key 1.1770 technical level. Further intraday declines remain likely towards the 1.1742 and 1.1724 levels. Extended intraday support for the euro is found at 1.1713 and 1.1685.
Should price-action move above the 1.1770 level, EURUSD buyers will likely target towards the 1.1780 and 1.1800 levels.
Canadian Dollar Slips After Weak Wholesales Sales, BoC Rate Decision Looms
The Canadian dollar is unchanged in the Tuesday session. Currently, USD/CAD is trading at 1.2655, up 0.06% on the day. On the release front, there are no Canadian events. The US will release the Richmond Manufacturing Index, which is expected to edge lower to 17 points. On Wednesday, the Bank of Canada will set the benchmark rate. The US will release Core Durable Goods Orders and New Home Sales.
The Canadian dollar continues to struggle. The currency lost 1.3% last week against the greenback, and is currently at its lowest level since mid-August. There was no relief from Canadian data on Monday, as Wholesale Sales slowed to 0.5% in August, well off the forecast of 1.1%. Investors are keeping a close eye on the BoC, which will release a rate statement and its quarterly monetary policy report.
Canadian numbers disappointed on Friday, weighing on the Canadian dollar. Core Retail Sales slumped with a decline of 0.7% in August. This marked the indicator's steepest decline since June 2016. Inflation remains weak, as CPI inched up to 0.2%, shy of the estimate of 0.3%. These numbers have bolstered the likelihood that the Bank of Canada will keep interest rates steady at 1.00%. The Bank surprised the markets with a 25-basis point hike in September, in response to a Canadian economy that performed will in the first half of the year. This helped push the Canadian dollar higher, but the currency has since given up these gains.
Will Janet Yellen bid adieu to the Federal Reserve? Yellen's 3-year term concludes in February 2018, and President Trump has said he will nominate a new Fed in the next few days. The front runners are economist John Taylor and Federal Reserve Governor Jerome Powell. Taylor advocates a rule in which rates which be as high as 3 percent, given current economic conditions. Powell is more closely aligned to Fed Chair Janet Yellen's monetary stance which advocates an incremental increase in rates. With the two candidates representing sharply differing views on interest rate levels, Trump's choice for the new Fed chair could have a significant effect on monetary policy and the strength of the US dollar.
Ranges On Lockdown Ahead Of 3 Events
A trio of pairs are waiting near key levels in anticipation of big news this week. The yen was the top performer Monday while the euro lagged. In mid-day EU trading, the euro is the best performer and the NZD at the opposite end. We trun to today's PMI figures from the US after a series of neutral to better than expected PMI reports from the Eurozone. A Premium trade that has long been awaited was finally opened yesterday, bringing the number of open trades to 6.

The election excitement in USD/JPY faded Monday and the opening gap closed. The pair touched as high as 114.10 but sagged back to 113.43 late in the day as risk aversion picked up. The reversal highlights resistance near 114.50. In the bigger picture it highlights a market that's waiting for clarity on the Fed choice before making a move. For confirmation, watch 2.40% in 10-year yields, which is a level we are hearing about frequently.
Elsewhere, it's a similar story. The euro remains stuck in the 1.17 to 1.19 range as the hours tick towards Thursday's ECB decision. As we highlighted earlier, the market is holding a large net-long euro position that's vulnerable to a dovish surprise. Expectations for ECB tapering range from € 20 bn to € 40 bn, with an extension in the program ranging from 6 to 12 months.
A position that's most uneasy may be CAD because of Poloz's recent unpredictability. USD/CAD touched 1.2660 Monday but couldn't break the Aug 31 high or the 100-day moving average. The market is divided on whether or not the Bank of Canada will hike again this year and the pair could easily swing 5 cents in either direction once there is more clarity. Wednesday's outlook announcement from the BoC will be key.
Expect the market to tip-toe until some of those questions are answered.
DAX Ticks Higher, German Mfg. PMIs Beat Expectations
The DAX has posted small gains in the Tuesday session, as the index remains close to the symbolic 13,000 level. In the Tuesday session, the DAX is at 13,026.50, up 0.16% on the day. On the release front, German and European Manufacturing PMIs were sharp. German Flash Manufacturing PMI ticked lower to 60.5, beating the estimate of 60.1 points. Eurozone Manufacturing PMI improved to 58.6, easily beating the estimate of 57.9 points. Service sector numbers did not keep pace, as German and Eurozone Services PMIs both missed their estimates. On Wednesday, Germany releases Ifo Business Climate.
The Catalan crisis continues, and with the central and Catalan governments entrenched in their positions, the worst may be yet to come. On Saturday, the central government said it was imposing direct rule, invoking Article 155 of the Spanish Constitution. However, there is plenty of uncertainty, as this clause has never been used. Madrid has said it will depose Catalan President Carles Puigemont, take over the media and hold new elections for the region. Unsurprisingly, the Catalan government has condemned this latest salvo and has called for “massive civil disobdience”. Developments are unfolding daily, and investors are nervously watching the trouble in Spain, the eurozone’s fourth largest economy. The European Union has refused to intervene, calling the crisis an internal matter. So far, the woes in Catalonia has not affected the euro.
The eurozone economy has been performing well, with much of the credit going to a robust manufacturing sector in Germany and the eurozone. This was underscored on Tuesday, as manufacturing PMIs were strong and continue to point to expansion. The manufacturing sector remains solid, as global demand for European exports remains strong and consumer spending has been steady. German and European Services PMIs both missed their estimates, but still indicated expansion in the services sector.
Investors Look For Guidance
The EUR (€1.1764) continues to be trading somewhat unaffected by political uncertainty in Catalonia. Instead, all investor eyes are on the prospect of the European Central Bank (ECB) announcing plans to scale back its bond-buying program on Thursday.
The negative effect of events in Spain are muted, despite the rising tensions ahead of the potential vote in Senate on Friday on constitutional powers such as removing Catalan President Puigdemont.
The EUR's downside remains shallow ahead of the ECB meet. Central bank officials are expected to outline their asset purchase reduction plan. Market guesstimates expect the ECB to begin to taper its current €60B monthly asset purchases in January 2018 with consecutive €10B monthly reductions. This means the ECB would cease balance sheet expansion by the end of Q2 2018.
Elsewhere, investors are waiting for more news on the Fed leadership succession and the U.S budget.
This week will also see rate decisions from the Bank of Canada (Wednesday 10 am EDT), Norges Bank and Riksbank (Oct 26).
1. Stocks mixed results
In Japan, the Nikkei share average extended its record-winning streak to 16-days overnight, supported by buying of large-cap stocks. The index, which was down part of the day, rose +0.5 %, while the broader Topix index rose +0.7%.
Down-under, Australia's S&P ASX 200 benchmark ended fractionally higher, rallying +0.1%.
In Hong Kong, stocks fell amid signs of tighter liquidity. The Hang Seng index fell -0.5%, while the China Enterprises Index lost -0.7%.
In China, blue-chip stocks reached a 26-month high, led by infrastructure and property shares, as investors cheered robust earnings growth and felt comfortable with economic policy as the Communist Party's congress concluded. The blue-chip CSI300 index rose +0.7%, while the Shanghai Composite Index added +0.2%.
In Europe, regional indices trade little changed in a lackluster session, despite stronger than expected manufacturing PMI's readings out of Germany and France.
U.S stocks are set to open unchanged.
Indices: Stoxx600 -0.1% at 390.4, FTSE flat at 7521, DAX +0.2% at 13027, CAC-40 +0.2% at 5395, IBEX-35 +0.2% at 10184, FTSE MIB +0.4% at 22456, SMI -0.3% at 9222, S&P 500 Futures flat
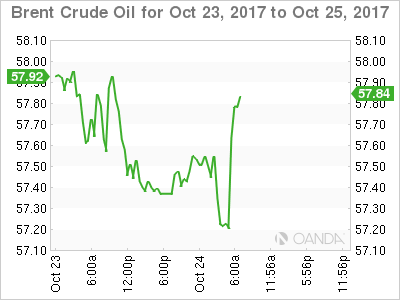
2. Oil prices inch up, support from drop in Iraq exports, gold unchanged
Oil prices have inched higher, finding support from a decline in oil exports from OPEC's second-biggest producer Iraq and a projected extended fall in U.S commercial oil stocks.
Brent crude for December delivery is up +10c at +$57.47 a barrel, while U.S light crude (WTI) is up +6c at +$51.96.
Iraqi oil exports have fallen more than 200,000 barrels per day (bpd) so far this month, as shipments from both the north and the south of the country declined.
The drop in supplies comes as OPEC, Russia and other producers are cutting output by about -1.8m bpd until March 2018 in an effort to drain a glut and support prices.
Investors will take their cues from this week's API and EIA industry data.
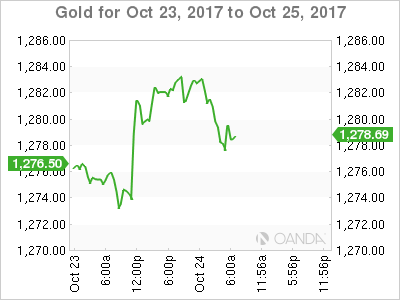
Gold is trading sideways ahead of the U.S open, with investors bracing for the possibility of an early announcement on the next U.S Fed Chief. Spot gold has slipped -0.1% to +$1,280.80 an ounce.
3. Yields – wait and see
The European Central Bank (ECB) meeting Thursday is giving investors a strong reason to sit back and wait. The absence of significant data to alter perceptions about the strength of the U.S economy and uncertainty about the details of President's Trumps tax overhaul plan are also encouraging ‘little movement' in the bond market.
Investors are also looking for clarity about whom President Donald Trump will nominate to lead the Federal Reserve. Potential nominees John Taylor, a Stanford economics professor, and Kevin Warsh, a former Fed governor, are seen by investors as likely to favour raising interest rates at a faster pace than the central bank has suggested it will take. While current Fed Chairwoman Janet Yellen and central bank Governor Jerome Powell are seen as more likely to maintain the status quo, in which the Fed projected three rate increases in 2018.
Note: President Trump has said he would like to name his pick before his Nov. 3 trip to Asia.
The yield on 10-year Treasuries have climbed +2 bps to +2.38%. In Germany, the 10-year Bund yield has advanced +2 bps to +0.45%, while in the U.K, 10-year Gilt yield has gained +1 bps to +1.321%.
4. Dollar little changed
The FX markets remain subdued in quiet trading ahead of a plethora of central bank meetings this week. Even this morning's various European PMI's and confidence data (see below) failed to inspire any volatility.
The ECB would likely be keen to make sure its potential QE tapering announcement Thursday does not cause another market tantrum.
Note: In 2015 after the ECB announced QE, Bund yields rallied aggressively from +0% to almost +1% in just seven-weeks.
EUR/USD is a tad higher, trading just above €1.1765, the pound is at £1.3185, while yen is a tad weaker trading atop of ¥113.67.
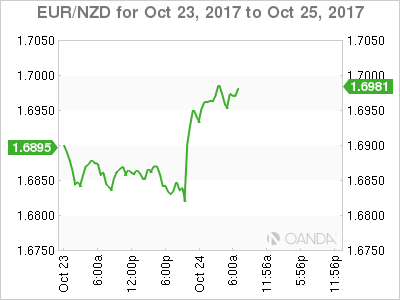
Elsewhere, weighing on the NZD (N$0.6929) overnight was news that the new Labour/NZ First coalition government outlined some of its priorities, which include a higher minimum wage, review of the Reserve Bank of New Zealand's (RBNZ) mandate and a ban on the purchase of existing homes by foreigners
5. Eurozone economy appear to slow
Data this morning indicates that the eurozone economy appears to have slowed slightly as it enters Q4 of what has been a strong year.
IHS Markit data this morning said its composite PMI for the eurozone fell to 55.9 in October from 56.7 in September.
Digging deeper, the decline was driven by services companies, which rely more heavily on domestic demand than their manufacturing counterparts.
On the plus side, the survey recorded the fastest growth in employment in over a decade, which keeps alive hopes that regional wages will accelerate and help generate the sustained pickup in inflation sought by the ECB.
Also, the measure of activity in the eurozone's factories rallied to its highest level in six-and-a-half years, an indication that the EUR's appreciation year-o-date has yet to weaken exports.
WTI Bullish SHS Pattern Suggest More Upside
The lower U.S. rig count number on oil drilling, the OPEC compliance to the output reduction, and the geopolitical tensions in northern Iraq along with discussions of Iran sanctions have helped Oil prices higher. Technically we can see two big inverted head and shoulder patterns pushing the price upward and continuation is expected as both technical and fundamental views are aligned. POC zone 51.65-95 should spike the price more to the upside towards 52.25 and if we see the break of the pattern neckline (52.28) we might see 52.70, 52.98 and 53.48. Currently big momentum candle is forming on 4h and watch for a possible marubozu candle close.
W L3 - Weekly Camarilla Pivot (Weekly Interim Support)
W H3 - Weekly Camarilla Pivot (Weekly Interim Resistance)
W H4 - Weekly Camarilla Pivot (Strong Weekly Resistance)
M H4 - Monthly Camarilla Pivot (Very Strong Monthly Resistance)
M L3 – Monthly Camarilla Pivot (Monthly Support)
M L4 – Monthly H4 Camarilla (Very Strong Monthly Support)
POC - Point Of Confluence (The zone where we expect price to react aka entry zone)
