Sample Category Title
Market Update – European Session: Major European PMI Manufacturing Data Exceeds Expectations
Notes/Observations
Oct Manufacturing PMI and Confidence data improving for Europe (France, Germany and Euro Zone PMI beat expectations)
ECB chief Draghi likely to provide "strong forward guidance" on Thursday to avoid any taper tantrum
Overnight
Asia:
Japan Oct Preliminary PMI Manufacturing: 52.5 v 52.9 prior
New Zealand Labour Leader Ardern (Incoming PM) signed coalition agreement with NZ First. To review and reform Reserve Bank Act; review to include employment and price stability. Has agreement on banning purchase of existing homes from foreign buyers.
Europe:
ECB's Nouy (SSM chief): Reiterates view that there's not much time left for UK banks to secure EU market access after the Brexit
Americas:
President Trump reiterated that he was 'very, very close' to making Fed chair decision
Economic Data
(FI) Finland Sept PPI M/M: 0.5% v 0.1% prior; Y/Y: 4.0% v 3.8% prior
(FI) Finland Sept Unemployment Rate: 8.0% v 7.5% prior
(FR) France Oct Business Confidence: 109 v 109e; Manufacturing Confidence: 111 v 110e
(FR) France Oct Business Survey Overall Demand: 18 v 15 prior
(FR) France Oct Preliminary Manufacturing PMI: 56.7 v 56.0e (13th month of expansion and highest since Apr 2011), Services PMI: 57.4 v 56.9e, Composite PMI: 57.5 v 57.0e
(CZ) Czech Oct Business Confidence: 16.9 v 16.5 prior; Consumer Confidence: 6.3 v 6.8 prior
(ZA) South Africa Aug Leading Indicator: 97.2 v 97.3 prior
(DE) Germany Oct Preliminary Manufacturing PMI: 60.5 v 60.0e (35th month of expansion); Services PMI: 55.2 v 55.5e, Composite PMI: 56.9 v 57.5e
(EU) Euro Zone Oct Preliminary Manufacturing PMI: 58.6 v 57.8e (50th month of expansion), Services PMI: 54.9 v 55.6e, Composite PMI: 55.9 v 56.5e
(PL) Poland Sept Unemployment Rate: 6.8% v 6.9%e
Fixed Income Issuance:
(ID) Indonesia sold total IDR7.0T in 6-month Bills & 2-year,4-year,7-year and 15-Year Project-based Sukuk (PBS)
SPEAKERS/FIXED INCOME/FX/COMMODITIES/ERRATUM
Equities
Indices [Stoxx600 % at XXX, FTSE % at XXX, DAX % at XXX, CAC-40 % at XXX, IBEX-35 % at XXX, FTSE MIB % at XXX, SMI % at Indices [Stoxx600 -0.1% at 390.4, FTSE flat at 7521, DAX +0.2% at 13027, CAC-40 +0.2% at 5395, IBEX-35 +0.2% at 10184, FTSE MIB +0.4% at 22456, SMI -0.3% at 9222, S&P 500 Futures flat]
Market Focal Points/Key Themes: European Indices trade little changed in a lackluster session, despite higher then expected Manufacturing PMI readings out of Germany and France. On the corporate front Dax heavyweight BASF trades slightly lower after reporting results which beat estimates, while Novartis drags on the Swiss SMI despite beating on the top and bottom line. Covestro outperforms after a strong beat, with other notable earnings related risers include AMS, Luxottica, Essilor and SAAB. Elsewhere GFT trades sharply lower after cutting their outlook with Randstad also a heavy faller after missing estimates. Looking ahead notable earners include DOW components McDonalds, Caterpillar, 3M, United Technologies as well General Motors, Fiat and Lockheed Martin.
Equities
Consumer discretionary [Whitbread [WTB.UK] -4.3% (Earnings), Luxotica [LUX.IT] +3.3% (Earnings), Puma [PUM.DE] -2.3% (Earnings)]
Industrials: [Basf [BAS.DE] -0.9% (Earnings), Saab [SAABB.SE] +4.5% (Earnings)]
Financials: [ Commerzbank [CBK.DE] +2.5% (Hire advisers on potential M&A), Randstad [RAND.NL] -5.4% (Earnings)]
Technology: [Basler [BSL.DE] -3% (raises outlook), AMS [AMS.CH] +17% (Earnings)]
Healthcare: [Novartis [NOVN.CH] -1.3% (Earnings), Covestro [1COV.DE] +5.7% (Earnings), Morphosys [MOR>DE] +7.5% (Receives FDA breakthrough therapy designation for its antibody MOR208 in relapsed/refractory DLBCL)]
Speakers
ECB Lending Survey: Banks saw broad-based pickup in loan demand during Q3. Credit standards for mortgages, consumer loans eased in quarter. Banks expected net demand for housing loans to increase in Q4
EU Chief Negotiator Barnier: There is a possible way to negotiate Brexit; work will start on draft treaty on the UK's exit from EU
EU's Juncker: Want a Brexit agreement; not negotiating in a hostile mood
EU's Tusk: EU27 was united in Brexit negotiations; up to London how talks ended
Spain PM Rajoy said to be planning on setting up a Catalonia ministry
Spain Justice Min: Catalonia crisis cannot be solved by just holding regional elections
Austria People Party (OVP) leader Kurz (likely PM-designate): Targeting a new govt before Christmas
Russia Fin Min Siluanov said to seek to tighten currency regulations during crises (**Note: In the past Russian govt officials stated that it was not considering capital controls)
India Finance Ministry said to be prepared to announce steps to counter the slowdown in economic growth
Bank of Japan (BoJ) said to consider again cutting its inflation outlook for FY17/18 (current fiscal year) from 1.1% to 1.0%. (**Next BOJ decision is on Oct 31st)
Japan Finance Ministry (MOF) raised its assessment of regional economies and noted the country was experiencing an economic recovery (prior view was moderate recovery)
Russia Energy Min Novak: To discuss OPEC cooperation and possible oil extension agreement with Saudi Oil Min Falih on Thursday, Nov 2nd. Reiterated view that was too early to take decision on production cut extension
Qatar Oil Min Al Sada (OPEC President):: OPEC to review current production agreement at its Nov meeting; would support any extension of cuts
Saudi Arabia Energy Min Al-Falih: All decisions on table for production cuts
OPEC reportedly will also work on an exit strategy alongside cuts extension at its Nov 30th meeting
Currencies
FX markets subdued in quiet trading ahead of the ECB rate decision on Thursday. Various European PMI and confidence data failed to inspire volatility. Dealers noted that ECB would likely be keen to make sure its potential QE tapering announcement Thursday doesn't cause another market tantrum (**Reminder: In 2015 after the ECB announced QE Bund yields rose from just over 0% in mid-April to almost 1% in late June. EUR/USD fractionally higher just above 1.1765 ahead of the NY morning.
Other major pairs little changed with USD/JPY at 113.62 and GBP/USD at 1.3201
Fixed Income
Bund futures trade at 161.22 down 44 ticks as markets remain choppy. Support lies at 161.00, followed by 160.38. Resistance stands initially at 162.75, followed by 163.51.
Gilt futures trade at 124.32 down 13 ticks following the drop in bund futures. Continued downside eyeing 123.26. Upside targets 124.90 then 125.24.
Tuesday's liquidity report showed Monday's excess liquidity rose to €1.794T from €1.791T and use of the marginal lending facility climbed to €417M from €315M.
Corporate issuance saw $14.2B come to market via 8 issuers, headlined by Citigroup's $4.0B in 5 and 11-year debt.
Looking Ahead
05.30 (UK) Weekly John Lewis LFL sales data
05:30 (EU) ECB allotment in 7-day Main Financing Tender (MRO) tender
05:30 (HU) Hungary Debt Agency (AKK) to sell in 3-month Bills
05:30 (UK) DMO to sell 0.625% 2042 I/L Gilts
06:00 (TR) Turkey to sell 2019, 2024 and 2027 bonds
06:30 (UK) Chancellor of Exchequer Hammond (Fin Min) in Parliament
06:45 (US) Daily Libor Fixing
07:45 (US) Weekly Goldman Economist Chain Store Sales
08:00 (CL) Chile Sept PPI M/M: No est v 2.2% prior
08:00 (HU) Hungary Central Bank (NBH) Interest Rate Decision: Expected to leave the Base Rate unchanged at 0.90%
08:05 (UK) Baltic Dry Bulk Index
08:55 (US) Weekly Redbook Sales
09:00 (BE) Belgium Oct Business Confidence: -3.0e v -3.5 prior
09:00 (EU) Weekly ECB Forex Reserves
09:00 (MX) Mexico Aug IGAE Economic Activity (Monthly GDP) Y/Y: 1.7%e v 1.0% prior
09:00 (RU) Russia announces weekly OFZ bond auction
09:00 (HU) Hungary Central Bank Gov Matolcsy post rate decision statement
09:45 (US) Oct Preliminary Markit Manufacturing PMI: 53.5e v 53.1 prior, Services PMI: 55.2e v 55.3 prior, Composite PMI: No est v 54.8 prior
10:00 (US) Oct Richmond Fed Manufacturing Index: 17e v 19 prior
10:00 (FI) ECB's Liikanen (Finalnd)
11:30 (US) Treasury to sell 4-Week Bills
12:00 (FR) France Sept Net Change in Jobseekers: No est v 22.3K prior; Total Jobseekers; no est v 3.540M prior
13:00 (US) Treasury to sell 2-Year Notes
15:00 (AR) Argentina Aug Economic Activity Index (Monthly GDP) M/M: No est v 0.7% prior; Y/Y: 4.0%e v 4.9% prior
15:00 (AR) Argentina Sept Trade Balance: -$0.9Be v -$1.1B prior
16:30 (US) Weekly API Oil Inventories
German And Euro Mfg. PMIs Beat Expectations, Euro Unchanged
The euro is unchanged in the Tuesday session, after starting the week with losses. Currently, EUR/USD is trading at 1.1760, up 0.09% on the day. On the release front, German and European Manufacturing PMIs were sharp. German Flash Manufacturing PMI ticked lower to 60.5, beating the estimate of 60.1 points. Eurozone Manufacturing PMI improved to 58.6, easily beating the estimate of 57.9 points. There are no major US events on the schedule. On Wednesday, Germany releases Ifo Business Climate, and the US will publish US Core Durable Goods Orders.
The crisis in Catalonia has entered its third week, and with the central and Catalan governments entrenched in their positions, the worst may be yet to come. On Saturday, the central government said it would imposing direct rule, invoking Article 155 of the Spanish Constitution. However, there is plenty of uncertainty, as this clause has never been used. Madrid has said it will remove Catalan President Carles Puigemont from power, take over the media and hold new elections for the region. Unsurprisingly, the Catalan government has condemned this latest salvo and has called for “massive civil disobdience”. Developments are unfolding daily, and investors are nervously watching the trouble in Spain, the eurozone’s fourth largest economy. The European Union has refused to intervene, calling the crisis an internal matter. So far, the woes in Catalonia have not affected the euro.
The eurozone economy has been performing well, with much of the credit going to a robust manufacturing sector in Germany and the eurozone. This was underscored on Tuesday, as manufacturing PMIs were strong and continue to point to expansion. The manufacturing sector remains solid, as global demand for European exports remains strong and consumer spending has been steady. German and European Services PMIs both missed their estimates, but still indicated expansion in the services sector.
The Brexit clock is ticking, with Britain leaving the European Union in March 2019. However, negotiations between the parties have foundered, as the sides remain far apart on a number of key issues, including the size of Britain’s bill when it says goodbye to the club. Prime Minister May addressed the 27 EU leaders last week in Brussels, imploring the European to show some flexibility. This didn’t prevent the EU leaders from stating that trade negotiations with Britain would not commence until more progress is made on non-trade matters. Prime Minister May has a razor-thin majority in parliament, and adding to the mix, there are sharp divisions in her cabinet regarding Brexit, with some senior ministers in favor of taking a hard stance and leaving the EU without an agreement if the Europeans fail to soften their position.
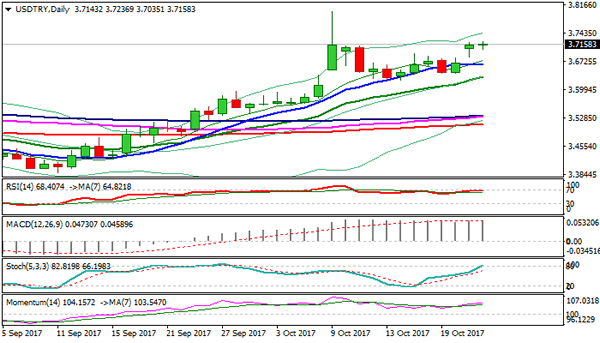
Technical Outlook: USDTRY – Bulls Eye Fibo Barrier At 3.7301 For Extension Towards 3.7994, Oct 9 Spike High
The pair maintains positive tone and hit marginally higher high at 3.7236 on Tuesday following Monday’s gap-higher opening, which further accelerated recovery rally from 3.6251 (13 Oct low).
Bulls are looking for renewed attempt through 3.7301 (Fibo 61.8% of larger 3.9414/3.3883 descend) which was dented on Oct 9 short-lived spike to 3.7994.
Close above 3.7301 pivot would generate bullish signal for extension towards lower tops at 3.7482 (07 Apr) and 3.7853 (09 Mar) and possible extension towards 3.7994 spike high.
Bulls are expected to remain fully in play while Monday’s gap stays intact. Gap’s lower boundary is reinforced by sideways-moving10SMA at 3.6651 and only sustained break here would sideline near-term bulls.
Res: 3.7236, 3.7301, 3.7452, 3.7853
Sup: 3.7035, 3.6838, 3.6651, 3.6410
US Index Losses May Prove Short-Lived
- US earnings key on Tuesday;
- EUR edges higher on strong PMI data;
- EUR gains appear capped ahead of ECB decision.
A rare negative session on Monday in US equity markets could be quickly reversed on Tuesday, with futures pointing to a more positive open on Wall Street.
While there is always the potential for market pullbacks or even corrections, I don’t think we can read too much into Monday’s declines, especially given the long and gradual rally that preceded it and the size of the losses registered. I think what we saw Monday was simply some profit taking and now we’ll see just how bullish investors are at the moment by how quickly and aggressively the dips are seized on. Index futures suggest we won’t have to wait very long at all.
As will remain the case for much of the week, the main driver for equity market sentiment will be company earnings today with 42 S&P 500 companies scheduled to report on the third quarter. This includes the likes of Caterpillar, 3M, United Technologies and McDonald’s, all of which are also components of the Dow and three of which will report before the open, which could drive sentiment early in the session. We’ll also get flash services and manufacturing PMI surveys from the US shortly after the open which could help guide sentiment.
The eurozone recovery is gathering momentum according to surveys released this morning, with employment being a particular highlight from the manufacturing and services PMI reports. While the services PMI eased slightly from last month to 54.9 – which still indicates a strong growth outlook – the manufacturing survey was extremely encouraging and was driven by strong export demand.
While a stronger euro may represent a potential headwind for manufacturing going forward, the ECB is managing the transition very carefully and has repeatedly acted to prevent a damaging appreciation. The ECB is due to meet on Thursday, after which an update should lay out plans for bond buying beyond the end of this year when the current program will expire. While a reduction appears all-but guaranteed, the manner of the scaling down of QE is still apparently being decided on, with an initial €30 billion reduction until next September the most heavily speculation option.
The ECB will likely avoid to committing to anything beyond September – making this tapering process different to that carried out by the Federal Reserve – instead giving the impression that the decision will be made closer to the time, even if the process has already largely been agreed on. With this in mind, it’s hard to envisage a scenario in which the ECB intentionally delivers above what markets are expecting, which could weigh on the euro driven by either profit taking or the usual dovish accompanying commentary.
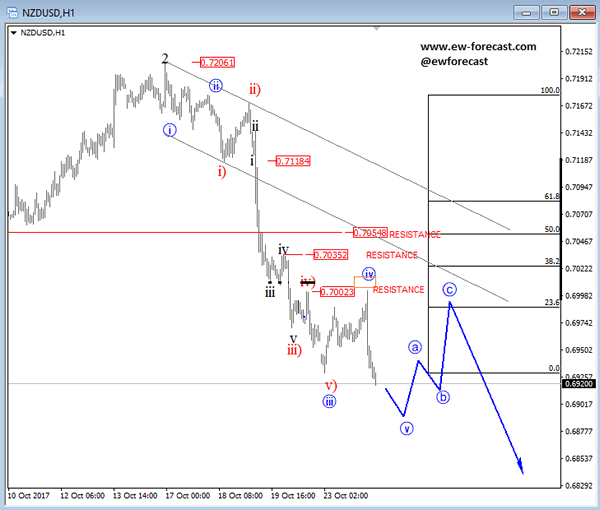
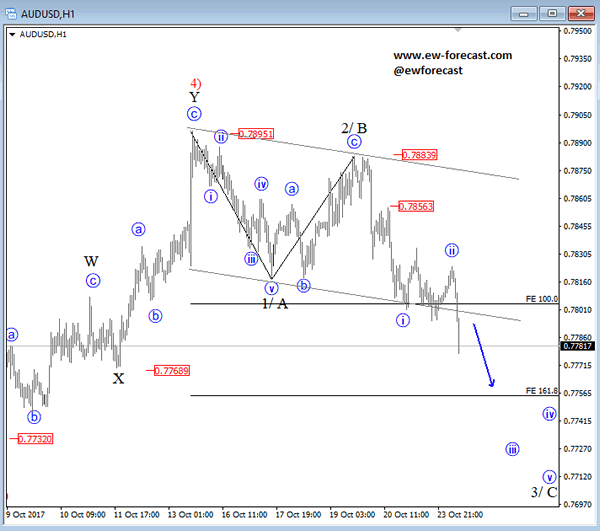
Elliott Wave Analysis: NZDUSD And AUDUSD
Elliott Wave Analysis: NZDUSD And AUDUSD
NZDUSD broke to the downside which has been expected as we identified a correction within strong ongoing downtrend. It was a nice a-b-c rally up in wave four. We see pair at a new low now, so it can be wave five which means a new a-b-c may occur by the end of the week. But bearish momentum is very strong so we have to be prepared on extended waves, especially now when Aussie might have finally joined the downtrend. It's interesting to see a new leg down on Aussie despite some corrective rally on gold, so new breakdown on metals could cause a lot of trouble to Australian currency that has room now for 0.7744/69.
NZDUSD, 1H
AUDUSD, 1H
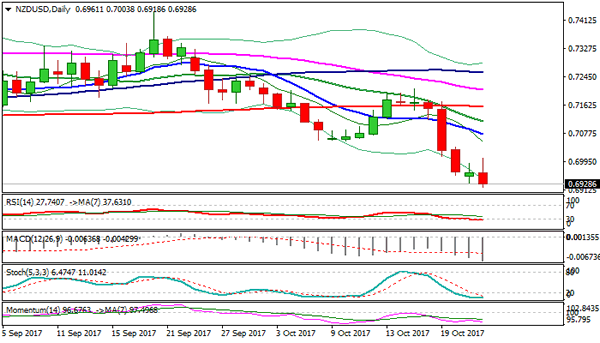
Technical Outlook: NZDUSD – Bears Are Looking To Resume After Limited Consolidation
The Kiwi dollar returns to red on Tuesday and hit new five-month low on persisting pressure from political uncertainty on policy steer from country's incoming government.
Brief consolidation of broader descend on Monday was capped by broken psychological 0.7000 support. Bearish techs favor further downside, as current wave C (part of five-wave pattern from 0.7558) approaches its FE123.6% at 0.6907 and could extend to 0.6844 (FE 138.2%).
Caution on strongly oversold slow stochastic on daily chart which suggests correction in coming sessions.
Above 0.7000, next barrier lies at 0.7055 (10 Oct former low), followed by descending 10SMA (0.7075) which is expected to cap extended corrective upticks.
Res: 0.7000, 0.7055, 0.7075, 0.7112
Sup: 0.6907, 0.6854, 0.6844, 0.6817
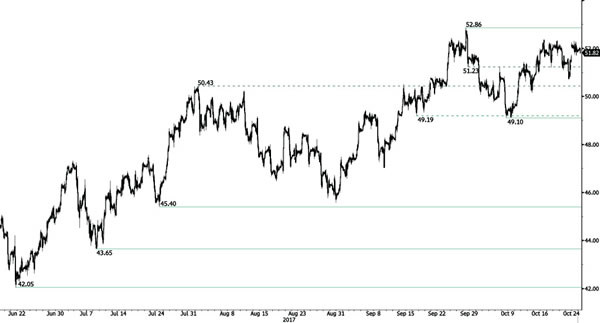
CRUDE OIL Testing Resistance Area
Crude oil bounced hard back within range defined by support at 50.43 and the strong resistance lies at 52.86 (28/09/2017). Expected to show continued increase within this range.
In the long-term, crude oil has recovered after its sharp decline last year. However, we consider that further weakness are very likely. For the time being the pair lies in an upside momentum. Strong support lies at 35.24 (05/04/2016) while resistance can now be found at 55.24 (03/01/2017 high).
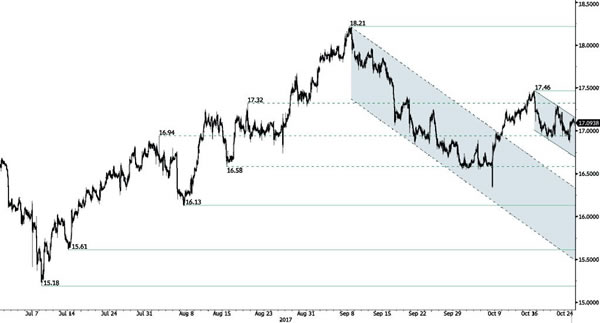
SILVER Volatility Within Downtrend Channel
Silver is again moving up and down. Hourly support can be founds at 16.88. Hourly resistance is given at 17.46 (13/10/2017 high). Additional support can be found at 16.13 (06/10/2017 low). Expected to show further weakness.
In the long-term, the trend is rater negative. Further downsides are very likely. Resistance is located at 25.11 (28/08/2013 high). Strong support can be found at 11.75 (20/04/2009).
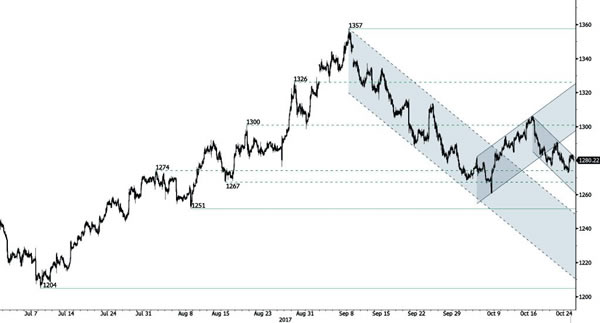
GOLD Bearish Momentum
Gold remains weak. The precious metal is located within a downtrend channel. The broken support at 1284 confirms an underlying bearish trend. Strong support lies at a distance at 1267 then 1204 (10/07/2017 high). Resistance is now located at 1288 (20/10/2017).
In the long-term, the technical structure suggests that there is a growing upside momentum. A break of 1392 (17/03/2014) is necessary ton confirm it, A major support can be found at 1045 (05/02/2010 low).
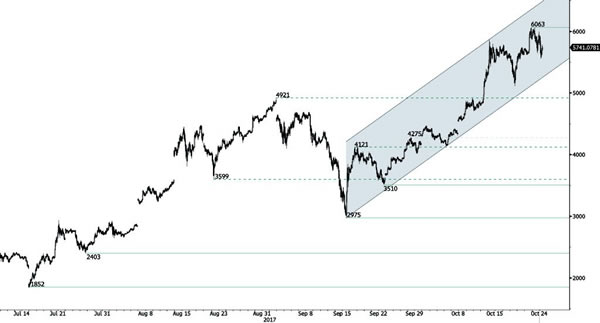
BITCOIN Continued Consolidation Near Highs
Bitcoin has bounced strongly suggesting a near term test of 5866 (all-time high). Strong support stands very far at 2975 (22/08/2017 low). Bitcoin si ready to set up new all-time high. The road is wide open for further increase. In the short-term, the digital currency should monitor $6000.
In the long-term, the digital currency has had an exponential growth. There are decent likelihood that the asset will reach $10'000.