Sample Category Title
Copper – Recovery Extends to One-Week High, But So Far Unable to Hold Gains
Copper future contract for December delivery extended recovery on Tuesday and spiked to one-week high at $3.2355, signaling higher low formation. Pullback from fresh over three-year high at $3.2580, posted last week, was contained by ascending Tenkan-sen at $3.1375, with formation of reversal pattern and subsequent bounce, signaling that corrective phase might be over. Today's recovery extension spiked above Fibo 76.4% of $3.2580/$3.1375 pullback, but was so far unable to hold gains. Fresh near-term bulls off 3.1375 low need close above $3.2120 (Fibo 61.8%) for bullish signal and to re-focus $3.2580 peak. Conversely, failure to hold today's gains and return below rising Tenkan-sen (currently at $3.1703) would increase downside risk on revisiting correction low at $3.1375. Overall picture remains bullish as investors are optimistic about prospects for global economic growth, although remain cautious on existing risk of slowdown, especially in China, metal's top consumer.
Res: 3.2000; 3.2120; 3.2355; 3.2415
Sup: 3.1810; 3.1703; 3.1510; 3.1375
CAC Gains Ground as French Manufacturing PMI Beats Expectations
The CAC index has posted gains in the Tuesday session. Currently, the CAC is trading at 5,397.00, up 0.19% on the day. Earlier on Tuesday, the index punched above the 5400 level for the first time since mid-May. On the release front, French Manufacturing PMI improved to 56.7, beating the estimate of 56.2 points. French Services PMI also accelerated to 57.4, above the forecast of 57.0 points. This marked a 5-month high. There was more positive news, as Eurozone Services and Manufacturing PMIs both beat their estimates and pointed to expansion.
Investors are in a positive mood on Tuesday, ahead of the ECB policy meeting on Thursday. ECB President Mario Draghi will have to maneuver carefully, as the ECB decides whether to start unwinding its asset purchases program, which is currently pegged at EUR 60 billion/month. Back in the summer, the ECB said it would trim the program in the "autumn", but didn't make any moves at the September meeting. A reduction in stimulus could have a significant effect on the euro. With the French economy enjoying the economic rebound in the eurozone, French stock markets have responded with gains, and the CAC has gained an impressive 5.3% since September 1. President Macron's plans to reform the economy have been well-received by investors, and the government seems intent on overhauling labor laws and making France much more competitive, which should continue to boost French stock markets.
The crisis in Catalonia has entered its third week, and with the central and Catalan governments entrenched in their positions, the worst may be yet to come. On Saturday, the central government said it was imposing direct rule, invoking Article 155 of the Spanish Constitution. However, there is plenty of uncertainty, as this clause has never been used. Madrid has said it will remove Catalan President Carles Puigemont from power, take over the media and hold new elections for the region. Unsurprisingly, the Catalan government has condemned this latest salvo and has called for "massive civil disobdience". Developments are unfolding daily, and investors are nervously watching the trouble in Spain, the eurozone's fourth largest economy. The European Union has refused to intervene, calling the crisis an internal matter. So far, the woes in Catalonia has not affected the euro.
Trade Idea Update: USD/CHF – Buy at 0.9795
USD/CHF - 0.9880
Original strategy :
Buy at 0.9795, Target: 0.9895, Stop: 0.9760
Position : -
Target : -
Stop : -
New strategy :
Buy at 0.9795, Target: 0.9895, Stop: 0.9760
Position : -
Target : -
Stop : -
As the greenback has retreated after rising to 0.9882 yesterday, suggesting consolidation below this level would be seen and pullback to 0.9815-20 cannot be ruled out, however, reckon support at 0.9796 would limit downside and bring another rise later, above said resistance at 0.9882 would add credence to our view that recent upmove from 0.9421 has resumed and bullishness remains for this move to extend headway to 0.9870 and possibly towards 0.9900, having said that, overbought condition should limit upside and price should falter below 0.9940-50, bring retreat later.
In view of this, we are looking to buy dollar again on pullback as support at 0.9796 should limit downside and bring another rise. Below 0.9765-70 would defer and suggest top is possibly formed, risk test of indicated support at 0.9730-37, however, break there is needed to provide confirmation, then further fall to previous support at 0.9705 would follow.

Trade Idea Update: GBP/USD – Sell at 1.3285
GBP/USD - 1.3166
Original strategy :
Sell at 1.3285, Target: 1.3155, Stop: 1.3320
Position : -
Target : -
Stop : -
New strategy :
Sell at 1.3285, Target: 1.3155, Stop: 1.3320
Position : -
Target : -
Stop : -
As cable found renewed buying interest at 1.3158 yesterday and has risen again, adding credence to our view that a temporary low was formed at 1.3088 late last week, hence near term upside risk remains for this move to extend gain to 1.3240-45 (61.8% Fibonacci retracement of 1.3338-1.3088), however, price should falter below indicated resistance at 1.3287 and bring retreat later, below said support at 1.3158 would signal the rebound from 1.3088 has ended, bring weakness to 1.3125-30, break there would bring retest of said support at 1.3088, a drop below there would extend the fall from 1.3338 to 1.3050, then towards recent low at 1.3027.
In view of this, wee are looking to sell cable on further subsequent recovery as resistance at 1.3287 should limit upside and bring another decline later. Only above 1.3312 resistance would abort and extend further gain to said recent high at 1.3338 which is likely to hold from here.

Trade Idea Update: EUR/USD – Stand aside
EUR/USD - 1.1761
New strategy :
Stand aside
Position : -
Target : -
Stop : -
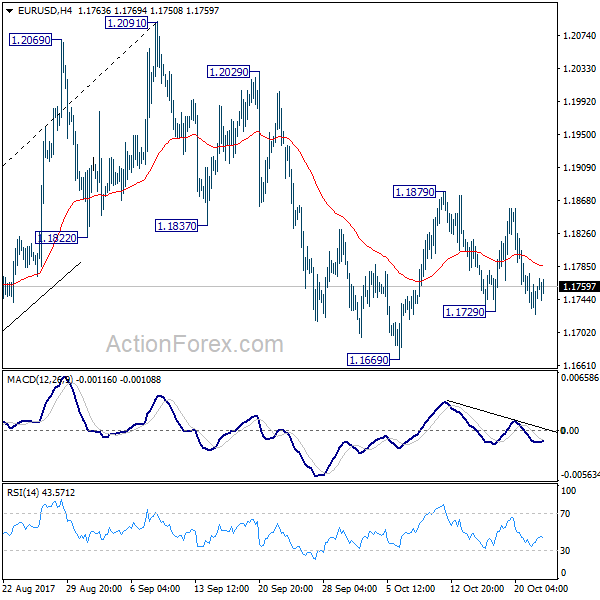
Although the single currency broke below previous support at 1.1730, lac of follow through selling and the subsequent rebound from 1.1725 suggest further consolidation would take place and recovery to 1.1780-90 cannot be ruled out, however, still reckon upside would be limited to 1.1820-25 and price should falter well below resistance at 1.1858, bring further choppy trading later.
On the downside, below said support at 1.1725 would extend the fall from 1.1880 top to 1.1700 and possibly towards indicated previous support at 1.1669 but break of latter level is needed to retain bearishness and extend further subsequent decline to 1.1640-45 first. As near term outlook is still mixed, would be prudent to stand aside in the meantime.

Trade Idea Update: USD/JPY – Buy at 113.00
USD/JPY - 113.88
Original strategy :
Buy at 113.00, Target: 114.00, Stop: 112.65
Position : -
Target : -
Stop : -
New strategy :
Buy at 113.00, Target: 114.00, Stop: 112.65
Position : -
Target : -
Stop : -
Although rose to 114.10 after opening higher yesterday, the subsequent retreat suggests consolidation below this level would be seen and pullback to 113.20 (50% Fibonacci retracement of 112.30-114.10) cannot be ruled out, however, reckon 112.95-00 (61.8% Fibonacci retracement) would hold and bring another rise later, above 113.80 would suggest the pullback from 114.10 has ended, bring retest of this resistance but break there is needed to confirm recent rise from 111.65 has resumed for headway to 114.40-50 but reckon 114.75-80 would hold from here.
In view of this, we are looking to buy dollar again on further pullback as 112.95-00 should limit downside and bring another rise. Below 112.65-70 would abort and signal top is formed instead, risk test of indicated support at 112.30 which is likely to hold from here.

Financial Markets Quiet, Bitcoin in Focus
Financial markets appeared relatively quiet on Tuesday, as investors positioned themselves ahead of a multitude of key risk events later in the week.
In Asia, stocks concluded mostly higher, while European shares struggled for direction amid the heightened political drama in Spain. With Mario Draghi in the spotlight on Thursday, and a vote in Spain's national Senate on Catalonia's takeover this Friday, we could see some serious fireworks. Attention should also be directed towards U.S President Donald Trump, who may be announcing his nominee for the Fed chair this week. Any surprises from Trump on selecting the new Fed chair, could create shockwaves across the board.
Currency spotlight - GBPUSD
Sterling was weak and wobbly against the Dollar on Tuesday, amid uncertainty over whether the Bank of England will raise U.K. interest rates at November's policy meeting. The myriad of hurdles facing Brexit negotiations are also playing a leading role in Sterling's woes, with prices currently trading around 1.3160 as of writing. Investors will direct their attention towards the preliminary U.K. GDP data on Wednesday, which is expected to show that the economy grew by 0.3% in the third quarter of 2017. A reading below market estimates is likely to punish Sterling further. From a technical standpoint, the GBPUSD remains under pressure on the daily charts. A breakdown and daily close below 1.3150, should encourage a further depreciation towards 1.3050.
Bitcoin dips below $5600
Bitcoin bulls were nowhere to be found on Tuesday, as the cryptocurrency dipped below $5600 during early trading.
With yet another alternative version of Bitcoin, branded as Bitcoin Gold, jumping into the arena, the bulls could be feeling threatened. It should be kept in mind that this is the second time Bitcoin is forking and as such, if it becomes a frequent occurrence, it could start to test the patience of investors. Taking a look at the technical picture, Bitcoin still fulfills the prerequisites of a bullish trend on the daily charts, as there have been consistently higher and higher lows. Bulls need to break back above $6000 for prices to trade towards $6200. In an alternative scenario, sustained weakness under $5400 may encourage a decline towards $5200.
US Crude Oil – Bulls Show Scope for Eventual Break above $52.35 Pivot
WTI Oil regained traction on Tuesday and retested key near-term barrier at $52.35 (top of near-term congestion / recent multiple upside rejections).
Near-term structure remains overall bullish and tracked by ascending 10SMA (currently at $51.66).
Bulls are also underpinned by 10/20 and 55/200 SMA bull-crosses, favoring eventual break above $52.35 pivot and attack at key s/t barrier at $52.84 (28 Sep high), break of which would signal resumption of larger uptrend from $42.04 (2017 low, posted on 21 June).
Fundamentals remain supportive as strong signs of global oil market rebalancing and comments from Saudi Energy Minister about possibilities of reaching agreement between oil producers on extending current output reduction deal, seen as positive signals.
Markets are focusing crude inventories reports (API report is due late today and EIA crude stocks report tomorrow), expecting another draw in crude stocks to further boost oil prices.
Res: 52.35; 52.84; 53.73; 54.27
Sup: 51.96; 51.66; 51.14; 50.86
EUR/USD Mid-Day Outlook
Daily Pivots: (S1) 1.1722; (P) 1.1750 (R1) 1.1775; More...
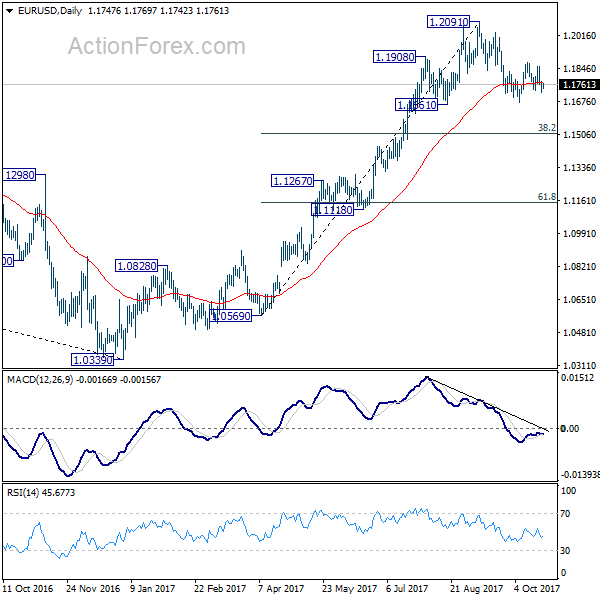
Intraday bias in EUR/USD remains neutral for the moment. On the downside, break of 1.1669 will resume the corrective fall from 1.2091 to 38.2% retracement of 1.0569 to 1.2091 at 1.1510. We'd expect strong support from there to complete the correction. On the upside, break of 1.1879 will revive the case that pull back from 1.2091 has already completed at 1.1669. In such case, intraday bias will be turned back to the upside for retesting 1.2091 high.
In the bigger picture, rise from medium term bottom at 1.0339 is not finished yet. It's expected to continue after pull back from 1.2091 completes. And, next target will be 38.2% retracement of 1.6039 (2008 high) to 1.0339 (2017 low) at 1.2516. However, it should be noted that there is no confirmation of trend reversal yet. That is, such rebound from 1.0399 could be a correction. And the long term fall from 1.6039 (2008 high) could resume. Hence, we'd be cautious on strong resistance from 1.2516 to limit upside.
GBP/USD Mid-Day Outlook
Daily Pivots: (S1) 1.3160; (P) 1.3193; (R1) 1.3229; More....
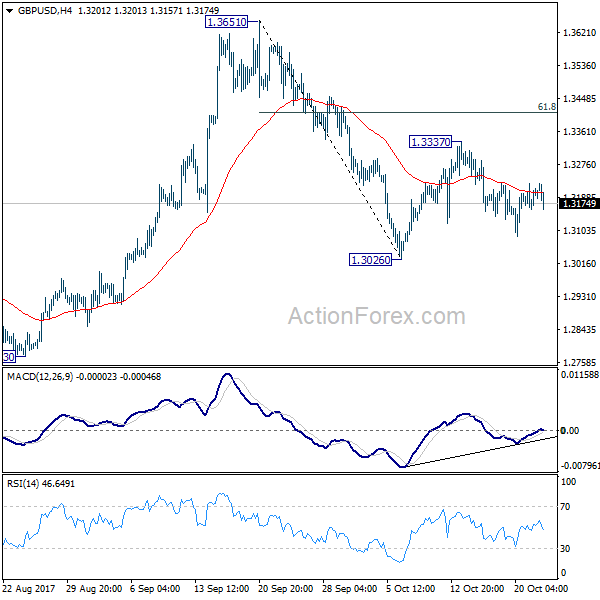
GBP/USD is still bounded in range of 1.3026/3337 and intraday bias remains neutral at this point. On the downside, break of 1.3026 will resume the decline from 1.3651 and target 1.2773 key support level. This will also revive the case of medium term reversal. Meanwhile, on the upside, break of 1.3337 will resume the rebound from 1.3026 to 61.8% retracement of 1.3651 to 1.3026 at 1.3412 and above.
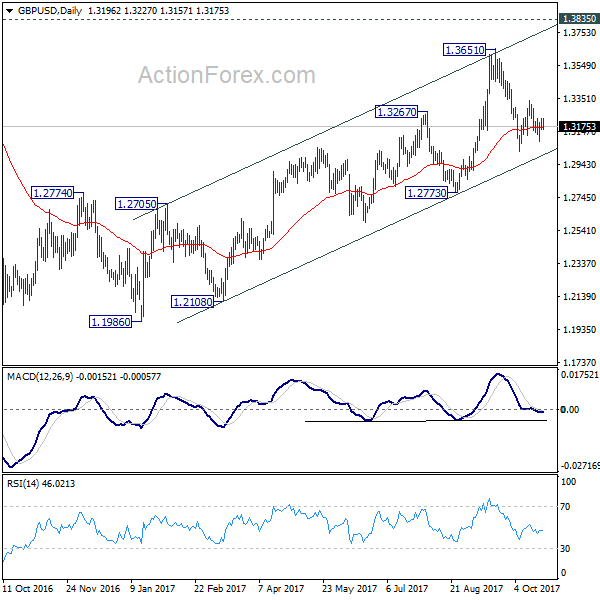
In the bigger picture, while the medium term rebound from 1.1946 was strong, GBP/USD hit strong resistance from the long term falling trend line. Outlook is turned a bit mixed and we'll stay neutral first. On the downside, decisive break of 1.2773 key support will argue that rebound from 1.1946 has completed. The corrective structure of rise from 1.1946 to 1.3651 will in turn suggest that long term down trend is now completed. Break of 1.1946 low should then be seen. On the upside, break of 1.3835 support turned resistance will revive the case of trend reversal and target 38.2% retracement of 2.1161 (2007 high) to 1.1946 (2016 low) at 1.5466.