Sample Category Title
Trade Idea : USD/JPY – Buy at 113.40
USD/JPY - 113.78
Most recent candlesticks pattern : N/A
Trend : Near term up
Tenkan-Sen level : 113.86
Kijun-Sen level : 113.67
Ichimoku cloud top : 113.55
Ichimoku cloud bottom : 113.39
Original strategy :
Buy at 113.40, Target: 114.40, Stop: 113.05
Position : -
Target : -
Stop : -
New strategy :
Buy at 113.40, Target: 114.40, Stop: 113.05
Position : -
Target : -
Stop : -
Dollar’s rebound after finding renewed buying interest at 113.24 adds credence to our view that the pullback from 114.10 has ended and break of this level would confirm recent rise from 111.65 has resumed for headway to 114.45-50 (50% projection of 111.65-114.10 measuring from 113.24) but reckon upside would be limited to 114.75-80 (61.8% projection) and 115.00 would hold from here.
In view of this, we are looking to buy dollar again on pullback as 113.30-40 should hold, bring another rise. Below 113.20-24 (50% Fibonacci retracement of 112.30-114.10 and said support) would defer and bring correction to 112.95-00 (61.8% Fibonacci retracement) but reckon 112.60-70 and bring another rise later.

AUD/JPY Candlesticks and Ichimoku Analysis
Weekly
• Last Candlesticks pattern: Shooting star
• Time of formation: 13 Mar 2017
• Trend bias: Down
Daily
• Last Candlesticks pattern: Bearish engulfing pattern
• Time of formation: 16 Feb 2017
• Trend bias: Near term down
AUD/JPY - 88.65
As aussie found support at 87.25 earlier this month and has rebounded, suggesting consolidation above this level would be seen, however, as long as 89.10-20 holds, mild downside bias remains for another retreat, below 87.75-80 would suggest the rebound from 87.25 has ended, bring retest of this level, break there would signal another leg of decline from 90.30 top is underway for weakness towards support at 86.60. Looking ahead, a break below there is needed to add credence to our bearish view, bring retracement of early upmove to 86.30-35 and possibly towards 86.00, having said that, support at 85.70 should remain intact, bring rebound later.
On the upside, whilst initial recovery cannot be ruled out, as long as 89.10-20 holds, prospect of another decline remains. Above said resistance would abort and suggest the first leg of decline from 90.30 top has ended, risk a stronger recovery to 89.65-70 but price should falter below said resistance at 90.30, bring another leg of corrective decline later.
Recommendation: Hold short entered at 88.20 for 86.20 with stop above 89.20

On the weekly chart, aussie found support at 87.25 and has rebounded, however, reckon upside would be limited to 89.10-20 and 89.65-70 should hold, bring another retreat later. Below said support at 87.25 would suggest a temporary top has possibly been formed at 90.30 and consolidation with mild downside bias would be seen for weakness to 86.70-75 and possibly towards support at 85.70, however, only a drop below support at 85.45 would add credence to this view, bring retracement of recent upmove to 84.95-00, then test of 83.75 (previous support level) which is likely to hold and price should stay above support at 82.55-60, bring rebound later.
On the upside, although initial recovery 89.00-10 cannot be ruled out, reckon upside would be limited and 89.65-70 should hold, bring another retreat later. A break above 89.65-70 would signal the pullback from 90.30 has ended, bring retest of this level first. Only a break of this resistance at 90.30 would extend recent upmove to previous resistance at 90.70 and possibly towards 91.50-60 but price should falter below another previous chart resistance at 92.70, bring correction later.

FOMC Preview: No New Signals, While Trump Is Set To Announce New Fed Chair Soon
We expect the Fed to maintain the Fed funds target range at 1.00-1.25% at the upcoming meeting, in line with consensus and market pricing. As it is one of the small meetings, all eyes will be on the statement, as there will be no updated projections and no press conference.
We do not think there will be major changes to the FOMC statement and we think the Fed will reiterate that it is monitoring inflation 'closely'. We think it is likely to mention the fall in employment in September. However, the Fed has already made it clear that it will see through the key figures affected by the hurricanes. The view that the weak labour market numbers are a product of the hurricanes and hence temporary is supported by initial jobless claims, which have come back to their trend level after soaring in September (see chart on the right). A hawkish move would be to mention the surprisingly strong wage growth in September. While this fits with the Fed's conviction that a tighter labour market will eventually lead to wage and hence price growth, the Fed may not want to overemphasise one month of strong wage growth, which could be partly reflective of compositional effects in employment following the hurricanes (mostly low paid workers being laid off without being paid).
Despite low inflation, we still expect the Fed to hike in December (in line with market pricing), as Fed Chair Janet Yellen recently reiterated her faith in the Phillips curve mechanism working its way through to inflation. Therefore, overall, we do not expect any new signals from the Fed at this meeting.
In general, the Fed's willingness to move on with a December hike should continue to support USD crosses near term but we maintain our view that the ECB's willingness to take tapering to the next level should ensure that EUR/USD bottoms out around the current level. For more, see FX Strategy: EUR/USD close to a bottom as ECB smells 'exit' ahead, 10 October.
We currently expect two hikes next year. However, uncertainty about monetary policy next year is particularly high, as the Fed will undergo big changes in terms of voting FOMC members. In particular, it is possible that Yellen will be replaced by either Jerome Powell (currently the most probable successor), John Taylor (less likely than Powell) or Kevin Warsh (least likely) – see table overleaf. Furthermore, Donald Trump has mentioned the possibility of choosing both Powell and Taylor as Fed Chair and Vice Chair combined. Note, though, that it is very hard to say anything conclusive about who Trump is most likely to appoint, as, in our view, he does not seem very interested in monetary policy and has expressed mutually contradictory views about his desired direction of monetary policy. If Powell is elected, he would be likely to maintain the Fed's existing tightening strategy by continuing the gradual hiking cycle. As markets have priced in a more hawkish Fed next year, he would be interpreted as a dovish pick, while Taylor would be interpreted more hawkishly. We do not know when this uncertainty will be resolved. Trump continues to say that he will make an announcement on the next Fed Chair 'very, very soon', while his advisers say a decision in November is more likely.
AUD/USD Candlesticks and Ichimoku Analysis
Weekly
• Last Candlesticks pattern: Long white candlestick
• Time of formation: 10 Jul 2017
• Trend bias: Up
Daily
• Last Candlesticks pattern: Long white candlestick
• Time of formation: 18 Jul 2017
• Trend bias: Up
Aussie met renewed selling interest at 0.7884 late last week and has dropped again since, retaining our bearish view that the rebound from 0.7733 has possibly ended at 0.7897 earlier this month and downside bias remains for a retest of this support, however, break there is needed to confirm the fall from 0.8125 top has resumed for retracement of early upmove to previous resistance at 0.7712, break there would extend weakness to 0.7660-70 and then 0.7620-30 but support at 0.7535-40 should remain intact due to oversold condition.
On the upside, expect recovery to be limited to 0.7810-15 and price should falter below the Tenkan-Sen (now at 0.7834), bring another decline later. Above said resistance at 0.7884 would risk another test of 0.7897 but only break there would signal a temporary low has been formed at 0.7733, bring retracement of the fall from 0.8125 to 0.7970-75, however, still reckon upside would be limited to 0.8000 and price should falter below resistance at 0.8103, bring another decline later.
Recommendation: Hold short entered at 0.7880 for 0.7680 with stop above 0.7850

On the weekly chart, last week’s retreat after meeting resistance at 0.7884 formed a black candlestick, retaining our bearish view that the rebound from 0.7733 has possibly ended at 0.7897, hence consolidation with downside bias remains for weakness to this support, break there would add credence to our view that top has been formed at 0.8125 and extend weakness to 0.7675-80, then possibly to 0.7630-35 (61.8% Fibonacci retracement of 0.7329-0.8125) but reckon support at 0.7535 would hold from here.
On the upside, although recovery to 0.7810-15 cannot be ruled out, reckon 0.7835 (this week’s high) would cap upside and bring another decline to aforesaid downside targets. Only break of said resistance at 0.7897 would risk a stronger rebound to the Tenkan-Sen (now at 0.7929), a weekly close above there would defer and bring further gain to 0.8020-30, however, price should falter below resistance at 0.8103 and bring another decline later. A break of 0.8103 resistance would signal the retreat from 0.8125 top has ended instead, bring retest of this level. Looking ahead, only above there would extend the erratic rise from 0.6827 low to previous resistance at 0.8163, then 0.8200 but loss of upward momentum should limit upside to previous resistance at 0.8295.

Elliott Wave View: FTSE Intra Day
FTSE Elliott Wave view suggests that Primary wave ((4)) ended with the decline to 7199.5. Up from there, rally is unfolding as an impulse Elliott Wave structure where Minor wave 1 ended at 7327.5 and Minor wave 2 ended at 7289.75. Rally to 7494.34 ended Minor wave 3, and pullback to 7473.12 ended Minor wave 4. The last leg Minor wave 5 ended at 7565.11 and this also ended Intermediate wave (A) of a zigzag Elliott Wave structure from 9/15 low (7199.5).
Intermediate wave (B) is currently in progress as a double three Elliott Wave structure. From 7565.11 high, Minor wave W ended at 7485.42 and Minor wave X bounce ended at 7560.04. Near term, while bounces stay below 7565.11, expect the Index to turn lower towards 7431 – 7481 area to complete Intermediate wave (B). Afterwards, Index should resume the rally to new high or at least bounce in 3 waves. We don’t like selling the proposed pullback.
FTSE 1 Hour Elliott Wave Analysis
Trade Idea: GBP/USD – Sell at 1.3175
GBP/USD – 1.3135
New strategy :
Sell at 1.3175, Target: 1.3005, Stop: 1.3235
Position: -
Target: -
Stop:-
As sterling met resistance at 1.3228 yesterday and has retreated quite sharply, suggesting the rebound from 1.3088 has ended and test of this level is likely, break there would extend weakness to recent low at 1.3027 but break there is needed to retain bearishness and confirm recent decline has resumed for test of psychological level at 1.3000 and later towards 1.2950-60 which is likely to hold from here due to near term oversold condition.
In view of this, we are looking to sell cable on recovery as 1.3170-75 should limit upside and bring another decline. Above said resistance at 1.3228 would abort and prolong consolidation, then the rebound from 1.3088 may extend gain to 1.3270-75 but as outlook remains consolidative, reckon upside would be limited to 1.3287 and price should falter well below resistance at 1.3338. Our preferred count is that (pls see the attached chart) the wave IV is unfolding as a complex double three (ABC-X-ABC) correction with 2nd wave B ended at 1.2774, hence 2nd wave C could have ended at 1.3658.
Our preferred count on the daily chart is that cable's rebound from 1.3500 (wave (A) trough) is unfolding as a wave (B) with A ended at 1.7043, followed by triangle wave B and wave C as well as wave (B) has ended at 1.7192, the subsequent selloff is the larger degree wave (C) which is still unfolding with minor wave (III) of larger degree wave 3 ended at 1.1986, hence wave (IV) correction is in progress which could either be a triangle wave (IV) of a complex formation but upside should be limited to 1.3500 and price should falter well below 1.4000, bring another decline in wave (V) of 3 for weakness to 1.1500, then 1.1200.

Trade Idea: GBP/JPY – Hold long entered at 149.50
GBP/JPY - 149.40
Original strategy:
Bought at 149.50, Target: 151.50, Stop: 148.90
Position: - Long at 149.50
Target: - 151.50
Stop: - 148.90
New strategy :
Hold long entered at 149.50, Target: 151.50, Stop: 148.90
Position: - Long at 149.50
Target: - 151.50
Stop:- 148.90
Although sterling fell to as low as 149.15 yesterday, as the pound found support there and has rebounded, retaining our bullishness and gain to 150.10 is likely, however, break of resistance at 150.50 is needed to signal the erratic rise from 146.95 has resumed for a retracement of the fall from 152.85 towards 151.00 but still reckon upside would be limited to towards resistance at 151.60 which is likely to hold from here, bring retreat later.
In view of this, we are holding on to our long position entered at 149.50. Below 148.90-00 would defer and risk weakness to 148.55-60, break there would signal top is formed instead, then weakness to indicated support at 147.80 would follow. Once this level is penetrated, this would signal the rebound from 146.95 has ended, bring weakness to another previous support at 147.30, below would confirm the fall from 152.85 has resumed for retest of 146.95. Looking ahead, below there would extend the fall from 152.85 top for retracement of recent upmove to 146.60-65 and then 146.00 but previous support at 145.25 should remain intact.
Our preferred count is that larger degree wave V with circle is unfolding from 251.12 with wave (I) 219.34, (II): 241.38 and wave (III) is subdivided into 1: 192.60, 2: 215.89 (23 Jul 2008) and wave 3 ended at 118.87 earlier in 2009. The correction from there to 162.60 is wave 4 which itself is a double three and is labeled as first a-b-c ended at 151.53, followed by wave x at 139.03, 2nd a ended at 162.60, 2nd b at 146.75 and 2nd c leg of wave 4 ended at 163.00. Therefore, the decline from 163.00 to 116.85 is now treated as wave 5 which also marked the end of larger degree wave (III), hence wave (IV) major correction has commenced for retracement of the wave (III) from 241.38 and upside target at 183.95-00 (50% Fibonacci retracement of the wave (II) from 241.38) had been met, a drop below 160.00 would suggest wave (IV) has ended at 195.85, bring decline in wave (V) for initial weakness to 130 (already met) and 120.

Trade Idea: EUR/JPY – Hold long entered at 133.20
EUR/JPY - 133.83
Original strategy:
Bought at 133.20, Target: 135.20, Stop: 132.60
Position: - Long at 133.20
Target: - 135.20
Stop: - 132.60
New strategy :
Hold long entered at 133.20, Target: 135.20, Stop: 133.10
Position: - Long at 133.20
Target: - 135.20
Stop:- 133.10
As the single currency found support at 133.10 and has rebounded again, retaining our bullishness and upside bias remains for a retest of recent high at 134.41, however, above this resistance is needed to confirm early upmove has resumed and extend headway to 135.00-10 and later towards 135.50-60 which is likely to hold from here due to overbought condition.
In view of this, we are holding on to our long position entered at 133.20. Below said support at 133.10 would defer an risk correction to 132.70-75 but only break of indicated support at 132.47 would abort and prolong choppy trading, risk weakness to 132.00, having said that, strong support at 131.66 should remain intact, bring another rebound later.
Our latest preferred count is that wave (ii) is ABC-X-ABC which ended at 123.33 and wave (iii) is unfolding with wave iii ended at 100.77, followed by wave iv at 111.57 and wave v as well as the wave (iii) has ended at 97.04, followed by wave (iv) at 111.43 and wave (v) has ended at 94.12 which is also the end of the larger degree v, this also implied the major wave (C) has also ended there, hence major correction has commenced from there with (A) leg unfolding in its lower degree wave c which has possibly ended at 145.69. Under this count, A-B-C wave (B) has commenced with A leg ended at 136.23, wave B at 143.79 and wave C has possibly ended at 149.79.
Our larger degree count is that the decline from 139.26 is wave (C) and is sub-divided into a diagonal triangle i-ii-iii-iv-v with wave i - 105.44, wave ii- 123.33, wave iii - 97.03, wave iv - 111.43, followed by the final wave v as well as the end of wave (C) at 94.12, this also mark the bottom of larger degree wave B. Under this count, major rise in wave C has commenced as an impulsive wave with minor wave III ended at 145.69, wave V is still in progress for further gain to 150.00. Having said that, this so-called wave V could well be the first leg of larger degree 5-waver wave C and this wave C should bring at least a retest of wave A top at 169.97 (July 2008).

Trade Idea: AUD/USD – Hold short entered at 0.7875
AUD/USD – 0.7721
Original strategy:
Sold at 0.7875, Target: 0.7700, Stop: 0.7860
Position: - Short at 0.7875
Target: - 0.7700
Stop:- 0.7860
New strategy :
Hold short entered at 0.7875, Target: 0.7700, Stop: 0.7800
Position: - Short at 0.7875
Target: - 0.7700
Stop:- 0.7800
Aussie has dropped today and broke below previous support at 0.7733adding credence to our view that the decline from 0.8125 top has resumed, hence bearishness remains for this move to extend weakness to 0.7700 and later towards 0.7660-65, however, near term oversold condition should limit downside and reckon 0.7600 would hold from here.
In view of this, we are holding on to our short position entered at 0.7875. Above 0.7795-00 would defer and risk a stronger rebound to 0.7820-25 but Only break of latter level would defer and suggest a temporary low is formed instead, risk rebound to 0.7855-60 first, however, price should falter well below resistance at 0.7897.
On the 4-hour chart, recent upmove from 0.7329 is unfolding as an impulsive rise with wave 3 as well as smaller degree wave (iii) extending, only minor wave v of (iii) has ended at 0.8125, hence bullishness remains for this move to extend headway to 0.8200, then towards 0.8300, however, reckon upside would be limited to 0.8400 and the final wave 5 should falter below 0.8500, bring correction later.

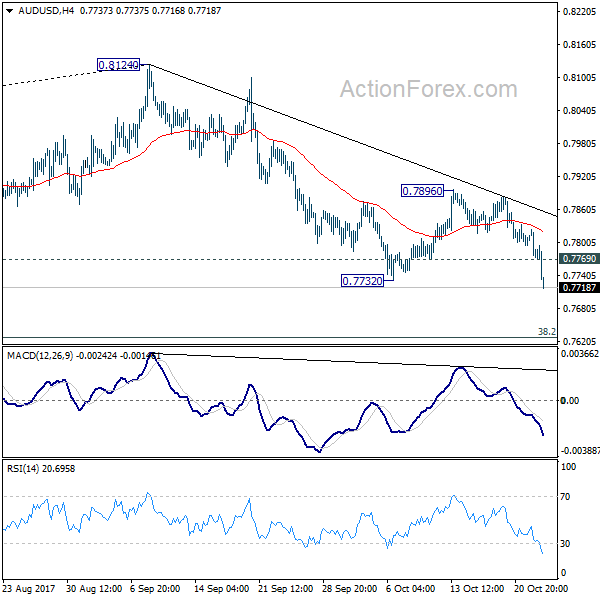
AUD/USD Daily Outlook
Daily Pivots: (S1) 0.7755; (P) 0.7790; (R1) 0.7809; More...
AUD/USD drops to as low as 0.7783 so far today. Break of 0.7732 support confirms resumption of decline from 0.8124. Intraday bias is back on the downside for medium term fibonacci level at 0.7628 first. Current development affirms the case of medium term reversal. Firm break of 0.7628 will pave the way to 0.7328 key support next. On the upside, above 0.7769 minor resistance will turn intraday bias neutral first. But outlook will remain cautiously bearish as long as 0.7896 resistance holds.
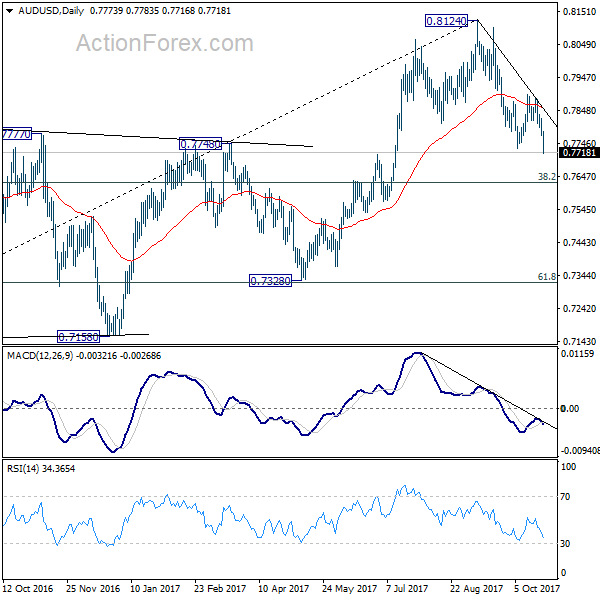
In the bigger picture, rise from 0.6826 medium term bottom is seen as corrective pattern. Current development suggests that it might be completed with three waves up to 0.8124 already. Break of 38.2% retracement of 0.6826 to 0.8124 at 0.7628 will affirm this bearish case. And, decisive break of 0.7328 key cluster support (61.8% retracement at 0.7322) will confirm and bring retest of 0.6826 low. In case rise from 0.6826 resumes and extends, strong resistance should be seen at 38.2% retracement of 1.1079 to 0.6826 at 0.8451 to limit upside.