
Sample Category Title
EUR/USD Daily Outlook
Daily Pivots: (S1) 1.1737; (P) 1.1764 (R1) 1.1787; More...
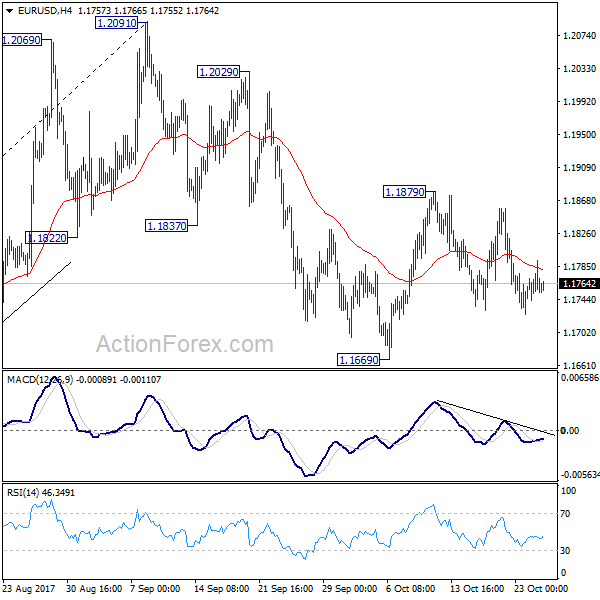
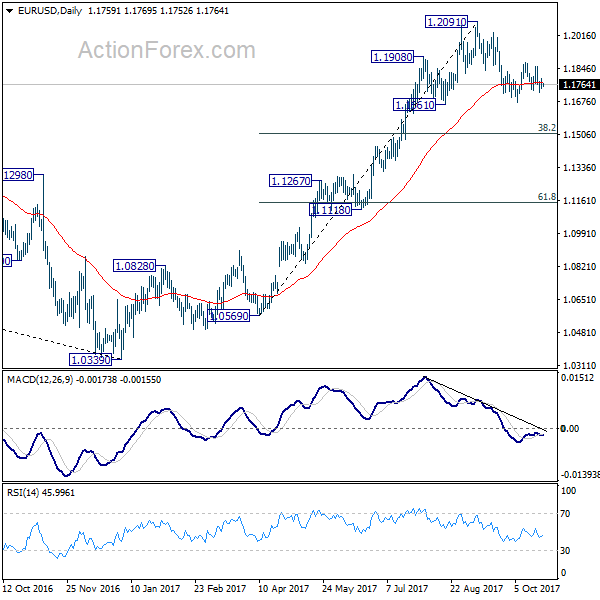
Intraday bias in EUR/USD remains neutral for the moment. On the downside, break of 1.1669 will resume the corrective fall from 1.2091 to 38.2% retracement of 1.0569 to 1.2091 at 1.1510. We'd expect strong support from there to complete the correction. On the upside, break of 1.1879 will revive the case that pull back from 1.2091 has already completed at 1.1669. In such case, intraday bias will be turned back to the upside for retesting 1.2091 high.
In the bigger picture, rise from medium term bottom at 1.0339 is not finished yet. It's expected to continue after pull back from 1.2091 completes. And, next target will be 38.2% retracement of 1.6039 (2008 high) to 1.0339 (2017 low) at 1.2516. However, it should be noted that there is no confirmation of trend reversal yet. That is, such rebound from 1.0399 could be a correction. And the long term fall from 1.6039 (2008 high) could resume. Hence, we'd be cautious on strong resistance from 1.2516 to limit upside.
Will UK GDP Breathe Life Into The Pound?
Sterling tumbled against the Dollar on Tuesday, after cautious comments from Bank of England Deputy Governor,Jon Cunliffe, rattled market expectations of an interest rate hike next month.
Speaking to the Western Mail, Cunliffe stated that a rate hike in November was an “open question”, and declared that “the economy clearly slowed this year”. The fact the British Pound found itself exposed to downside losses following his statements, continues to highlight how the currency remains extremely sensitive to monetary policy speculation.
Today’s main risk event for the Pound will be the preliminary U.K. GDP report this morning, which is expected to show that the economy expanded 0.3% in the third quarter of 2017. With November’s BoE policy meeting around the corner, a positive GDP figure that meets or exceeds market expectations, is likely to give the thumbs up to the central bank to raise rates.
Overall, October is shaping up to be a painful trading month for Sterling, especially in light of deteriorating economic fundamentals and slow progress on Brexit talks weighing heavily on the currency. Inflation in the U.K. has jumped to a five-and-a-half year high at 3%, while wage growth remains subdued. With households feeling the squeeze as wage growth continues to fall behind inflation, concerns remain elevated over the sustainability of the U.K.’s consumer-driven economic growth.
While markets are still widely expecting that the Bank of England will proceed with raising rates by +25 basis points in November to tame inflation, there is a suspicion that this may be a dovish hike. With the unsavory cocktail of soft economic fundamentals and Brexit uncertainty still weighing on sentiment, the future path for interest rates beyond November is open to question.
From a technical standpoint, the GBPUSD is turning increasingly bearish on the daily charts. Prices are currently trading below the 50 Simple Moving Average (SMA), while the MACD has also crossed to the downside. Previous support at 1.3150 may transform into a dynamic resistance, that encourages a further decline towards 1.3050. In an alternative scenario, a breakout back above 1.3230 may inspire bulls to target 1.3300.
Commodity spotlight – Gold
Gold bears were offered ample support in the form of a firmer Dollar on Wednesday morning, as the yellow metal dipped towards $1271.50.
It seems that investor appetite for riskier assets revived after optimism was renewed over President Trump’s proposed tax reforms, and this continues to reduce the metals safe-haven appeal. With speculation in the air over John Taylor, who is seen as a hawk that will potentially become the next Fed Chair head, Gold, which is zero-yielding, could find itself under further selling pressure. Focusing on the technical picture, the metal remains bearish on the daily charts, as prices are currently below the 50 Simple Moving Average. Sustained weakness below $1280 may open a path lower towards $1267. A solid breakdown and daily close below the $1267 level could inspire bears to target $1260 and $1250, respectively.
GBP/USD Daily Outlook
Daily Pivots: (S1) 1.3086; (P) 1.3157; (R1) 1.3200; More....
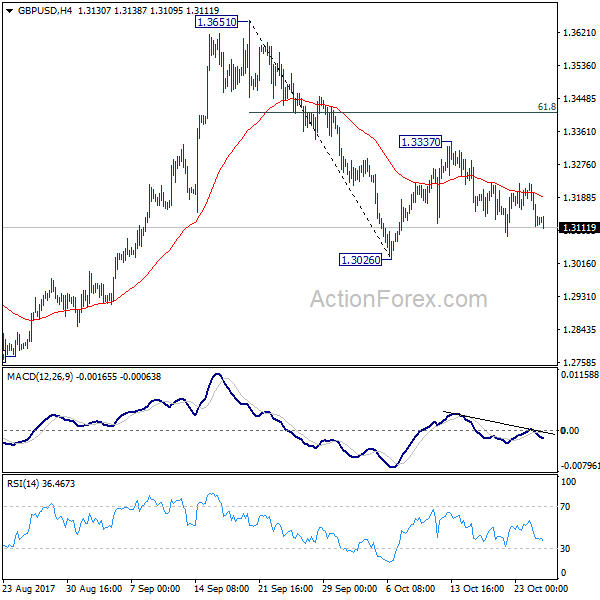
Intraday bias in GBP/USD remains neutral for consolidation above 1.3026. On the downside, break of 1.3026 will resume the decline from 1.3651 and target 1.2773 key support level. This will also revive the case of medium term reversal. Meanwhile, on the upside, break of 1.3337 will resume the rebound from 1.3026 to 61.8% retracement of 1.3651 to 1.3026 at 1.3412 and above.
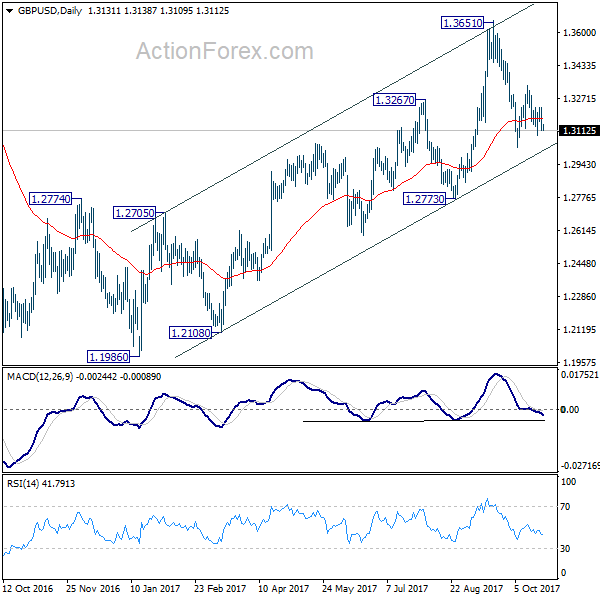
In the bigger picture, while the medium term rebound from 1.1946 was strong, GBP/USD hit strong resistance from the long term falling trend line. Outlook is turned a bit mixed and we'll stay neutral first. On the downside, decisive break of 1.2773 key support will argue that rebound from 1.1946 has completed. The corrective structure of rise from 1.1946 to 1.3651 will in turn suggest that long term down trend is now completed. Break of 1.1946 low should then be seen. On the upside, break of 1.3835 support turned resistance will revive the case of trend reversal and target 38.2% retracement of 2.1161 (2007 high) to 1.1946 (2016 low) at 1.5466.
USD/CHF Daily Outlook
Daily Pivots: (S1) 0.9861; (P) 0.9886; (R1) 0.9934; More....
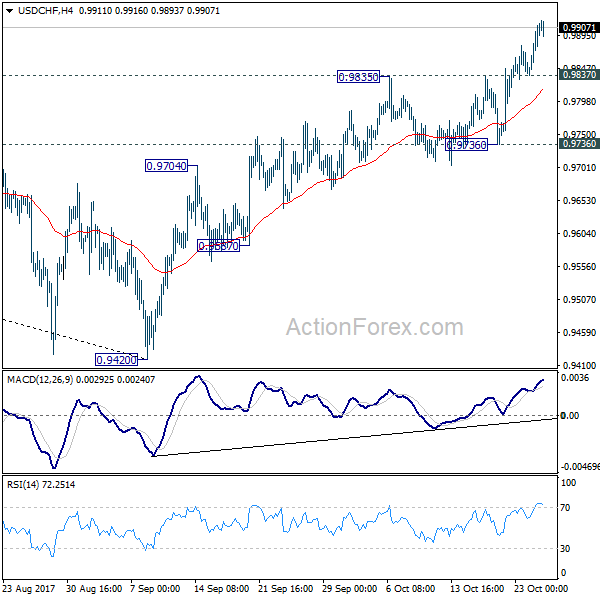
Intraday bias in USD/CHF remains on the upside for the moment. As noted before, medium term fall from 1.0342 should have completed at 0.9420 already. Current rally should target 61.8% retracement of 1.0342 to 0.9420 at 0.9990. Sustained break there will pave the way to retest 1.0342 high. On the downside, below 0.9837 minor support will turn bias neutral and bring consolidation. But outlook will remain bullish as long as 0.9736 support holds.
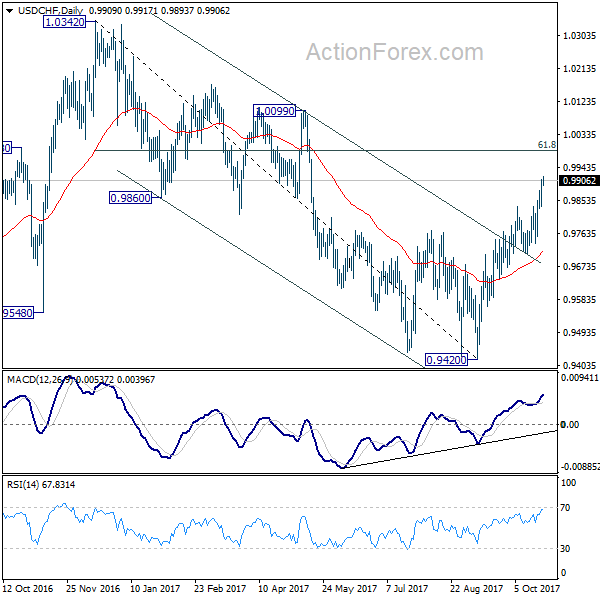
In the bigger picture, current development suggests that USD/CHF has defended 0.9443 (2016 low) key support level again. Rise from 0.9420 could develop into a medium term move and target a test on 1.0342 high. This represents the upper end of a long term range that started back in 2015. On the downside, break of 0.9587 support is now needed to indicate completion of the rise from 0.9420. Otherwise, further rally will remain in favor in medium term.
Currencies: Dollar Struggles To Extend Gains Even As Core Yields Rise
Sunrise Market Commentary
- Rates: Test of US 10-yr yield resistance ongoing
Today's eco calendar contains German Ifo and US durable goods orders. We expect their impact to be of intraday importance at best ahead of tomorrow's ECB meeting. Technically, the US 5-yr yield moved sustainably north of 2% while the test of US 10-yr yield resistance (2.4%) is ongoing. A break ahead of the ECB seems difficult. - Currencies: Dollar struggles to extend gains even as core yields rise
The dollar showed again no clear trend yesterday as investors await the ECB decision. Today, IFO business sentiment and the US durable orders might have intraday significance for FX trading, but we don't expect the major USD cross rates to break important technical levels. The recent sterling rebound had no strong legs as Brexit optimism fades again
The Sunrise Headlines
- US big industry earnings dazzled, driving the Dow (+0.72%) to another record. Other US indices only gained around 0.1%. Asian stock markets eke out small gains overnight. India outperformed after cabinet approved a $32 bn plan to recapitalise its state banks over the next two years.
- Politicians from four German parties seeking to form a first-of-its-kind coalition government agreed not to increase the country's debt load in order to fund sought-after tax cuts, subsidies and investments.
- The Chinese Communist party failed to designate a clear potential successor to its general secretary for the 1st time in a quarter-century, raising the possibility that Xi Jinping will attempt to remain in power well into the next decade.
- Australia's core inflation unexpectedly slowed in the September quarter as electricity prices spiked by less than forecast. The currency dropped half a cent against the US dollar with AUD/USD heading to 0.77.
- The fault lines within the Republican Party cracked further as feuding between President Donald Trump and senators intensified within the US Capitol, and anti-establishment activists claimed political momentum outside of it.
- Today's eco calendar contains Germen IFO investment sentiment, UK Q3 GDP, US durable goods orders and the rate decision by the Bank of Canada. Germany and the US supply the market
Currencies: Dollar Struggles To Extend Gains Even As Core Yields Rise
Dollar rebound stalls even as core yields rise
Trading in the major USD cross rates showed again no consistent trading pattern yesterday. An initial decline of EUR/USD was blocked after mixed, but still strong EMU PMI's. A further rise in US and EMU yields supported the likes of USD/JPY and EUR/JPY as investors continue to look forward to the ECB policy decision later this week. EUR/USD closed the session at 1.1761. USD/JPY finished at 113.90.
Overnight, Asian equity indices trade with moderate to decent gains. Japan underperforms. Risk sentiment has currently little impact on the dollar. EUR/USD is trading in well-known territory in the 1.1760 area. USD/JPY is also holding near yesterday's level (high 113 area). Australia Q3 CPI rose less than expected and pushed the Aussie dollar more than half a big figure lower (AUD/USD 0.7720). A sustained break below 0.7733 would deteriorate the short-term picture.
Today, the October German IFO business confidence is expected to have stabilized. The German PMI dropped in October (due to the services sector) suggesting some downside risk to the IFO. That shouldn't be too awful, as the level remains sky-high. Even so, a third consecutive decline would be a warning signal. In the US, the durable orders are expected to have risen by 1% M/M following a 2% M/M increase in August. The risk for the headline figure is on the downside, but the core of the report should be ok. US new home sales fell unexpectedly sharply in August (the impact of the hurricanes) Another (small) decline is expected.
The impact of the data on the EUR/USD or on other major USD cross rates might be modest as investors have plenty of other issues on the radar. We don't expect the IFO to be negative for the euro in case of a small miss. Yesterday, the euro was well bid after mixed PMI's. Investors apparently don't like to be positioned euro short going into tomorrow's ECB meeting.. A decent US durable orders report might be slightly USD supportive, but it won't trigger a break beyond important resistances. Spain, the nomination of the next head of the Fed and the political debate on the US tax reform remain wildcards. We also keep an eye at the equity indices. Some kind of fatigue on the long rally might weigh on USD/JPY and even on USD/EUR
From a technical point of view, EUR/USD dropped below the 1.1823/ 1.2070 consolidation pattern, but there was no sustained follow-through price action, which was disappointing for EUR/USD bears. We maintain a cautious sell-on upticks bias. The pair needs to drop below 1.1670/62 to give comfort to EUR/USD bears. The USD/JPY momentum was positive in September. The pair regained 110.67/95 resistance, a short-term positive. The 114.49 correction top is the next resistance. Sentiment improved further last week, but we still assume that a break beyond 114.49 will be difficult. This week's failed return above 114 confirms this view
EUR/USD: holding within established ranges going into ECB meeting
EUR/GBP
GBP rebound already aborted
Yesterday, sterling erased part of the post-EU summit gains. The exchange of words between EU and UK officials turned more constructive, even without any concrete progress in the negotiations. UK officials also felt that an agreement on a transition period is unlikely until there is sufficient progress on the nature of the future EU-UK trade relationship. This scenario leaves UK businesses in uncertainty as the Brexit negotiations drag on. EUR/GBP rebounded off the sub-0.89 recent lows and closed the session at 0.8956. Cable also ceded ground and finished the session at 1.3134.
Today, the first estimate of the UK Q3 GDP will be published. Growth is expected similar to that of the second quarter at 0.3% Q/Q and 1.5% Y/Y. We have no good reason to take a different view from the consensus. A weak figure or an unfavourable composition of growth will add to the markets' conviction that the room for the BoE to raise rates beyond a sole rate hike in November is very limited. It also looks that the EU and UK have returned to their tough Brexit positions, despite a more constructive tone at the EU summit last week. In this context we see little upside for sterling.
EUR/GBP staged a strong uptrend from April till late August and set a top at 0.9307. Rising UK inflation and the BoE preparing markets for a November rate hike triggered a sterling rebound, but it has run its course. EUR/GBP supports at 0.8743 and 0.8652 proved too difficult to break. The recent rebound above 0.89 improved the ST technical picture of EUR/GBP, but for now there were no convincing follow-through gains. EUR/GBP 0.9026 is 50% retracement of the recent countermove.
EUR/GBP: holding tight ranges, but bottom looks well protected
USD/JPY Daily Outlook
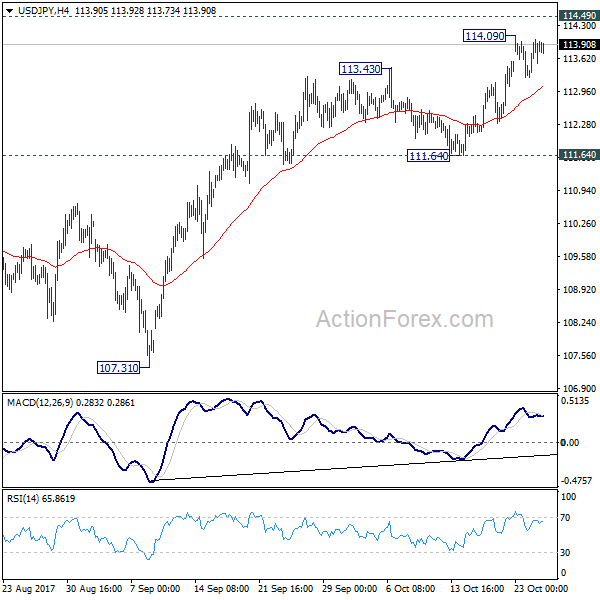
Daily Pivots: (S1) 113.42; (P) 113.72; (R1) 114.20; More...
Intraday bias in USD/JPY remains neutral for consolidation below 114.09 temporary top. Outlook remains mildly bullish as long as 111.64 support holds Above 114.09 will resume the rise from 107.31 to 114.49 resistance. Decisive break there will confirm that correction pattern from 118.65 has completed at 107.31 already. And USD/JPY should then target a test on 118.65.
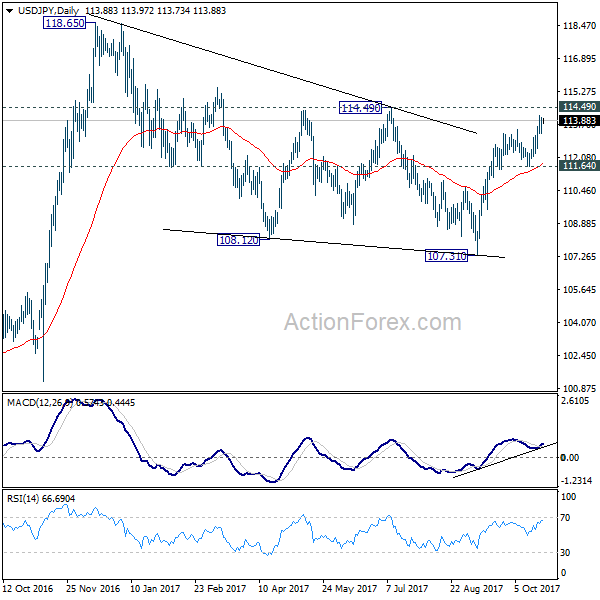
In the bigger picture, medium term rise from 98.97 (2016 low) is not completed yet. It should resume after corrective fall from 118.65 completed. Break of 114.49 resistance will likely resume the rise to 61.8% projection of 98.97 to 118.65 from 107.31 at 119.47 first. Firm break there will pave the way to 100% projection at 126.99. This will be the key level to decide whether long term up trend is resuming.
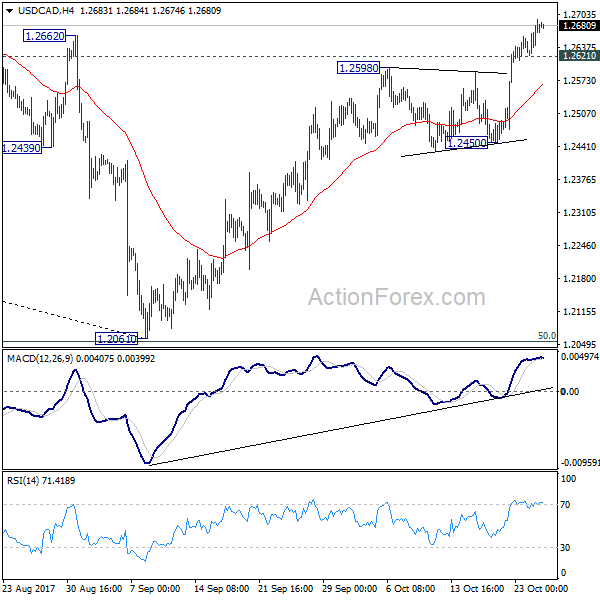
USD/CAD Daily Outlook
Daily Pivots: (S1) 1.2633; (P) 1.2662; (R1) 1.2704; More....
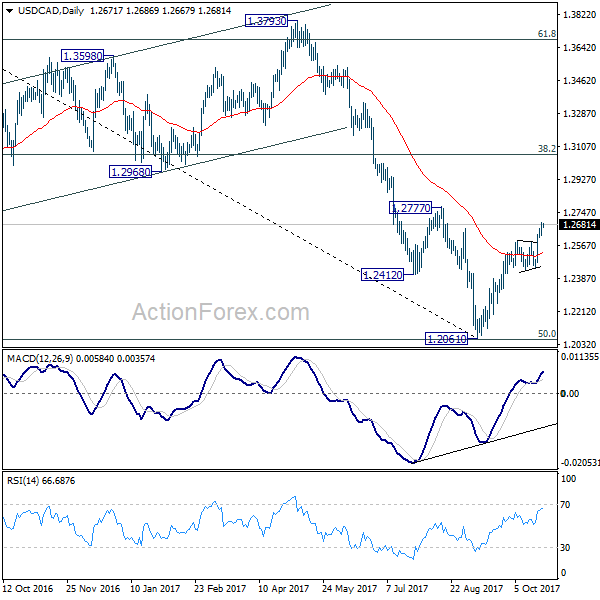
USD/CAD's rally is still in progress and intraday bias remains on the upside. Rebound from 1.2061 is targeting 1.2777 resistance first. Decisive break there will confirm medium term reversal and target 38.2% retracement of 1.4689 to 1.2061 at 1.3065 next. On the downside, below 1.2621 minor support will turn intraday bias neutral first. But outlook will remain bullish as long as 1.2450 support holds.
In the bigger picture, USD/CAD should have defended 50% retracement of 0.9406 (2011 low) to 1.4869 (2016 high) at 1.2048. And with 1.2048 intact, we'd favor the case that fall from 1.4689 is a correction. Break of 1.2777 will further affirm this bullish case. That is, larger up trend from 0.9406 is not completed. And in that case, USD/CAD should target 1.3793 key resistance next. However, on the other hand, firm break of 1.2048 will indicate that fall from 1.4689 is at least a medium term down trend and should target 61.8% retracement at 1.1424 and below.
The First Estimate Of Q3 GDP Growth
Market movers today
In Germany, we get the Ifo expectations, which we expect to rise further to 107.9 in October, in line with the improved economic expectations indicated by the ZEW October release last week.
In the UK, we are set to get the first estimate of Q3 GDP growth. According to the soft economic indicators released so far, GDP growth was around 0.3-0.4% q/q, with 0.4% being our estimate. We do not get subcomponents but it is likely growth was held back by a combination of negative real wage growth and Brexit uncertainties, which have slowed private consumption growth and business investment growth, respect ively.
In the US, we will get one of the most important data releases of the week in terms of core capex for September. We believe core capex rose just 0.2% m/m after two very strong months, which would still be a sign that the investment recovery continues.
Today, we have the Bank of Canada rate decision, but more important are the monetary policy decisions tomorrow. For more on ‘what to watch' from the ECB.
In Scandinavia, the Swedish Debt Office is due to release its new forecast , see next page.
Selected market news
Asian shares are broadly flat this morning, while US Treasury yields broke above 2.4% (highest since March) and the US dollar got a lift following a report that Republican senators were leaning towards John Taylor to be the next Fed Chair. US stock index futures signalled that equities might take a breather, as tensions between Republicans and President Trump intensified on Tuesday after two senators accused Trump of debasing US politics and the country's standing abroad, a rebellion that could cause trouble for his legislative agenda and planned tax cuts.
Euro area PMIs for October released yesterday indicated that the economic recovery continued at a healthy pace at the start of Q4. The rate of job creation was the strongest rise in a decade, while output price inflation accelerated for the third consecutive month. Both should be welcome news for the ECB, which we still expect to scale back its QE purchases tomorrow. Despite a further increase in the manufacturing PMI, the composite measure has stabilised over recent months, pointing to GDP growth around 0.5-0.6% q/q in H2 17, see here. US PMIs also registered another increase, suggesting that the service sector remains the main growth river and that GDP growth was slightly above 2% AR in Q3 17.
China has this morning presented its new leadership in the Politburo Standing Commitee. The line-up was as expected following the news reports yesterday as out lined in our Flash Comment China: Xi gets name in Constitution, Wang Qishan steps down. It points to continuation as the amount of members is unchanged at seven and the five new members represent different factions of the Communist Party. However, there is also no successor to Xi Jinping as President in 2022, which will add to speculation he may stay on after his second term. With Xi Jinping having Congress behind him and a team he has been part of forming, we believe reforms will get a further push in 2018.
Australia’s Inflation Growth Missed Market Expectations In The Three Months To September
For the 24 hours to 23:00 GMT, the AUD declined 0.44% against the USD and closed at 0.7777.
LME Copper prices rose 1.7% or $114.5/MT to $7073.5/MT. Aluminium prices rose 0.5% or $10.5/MT to $2144.0/MT.
In the Asian session, at GMT0300, the pair is trading at 0.7729, with the AUD trading 0.62% lower from yesterday's close, after the release of weaker-than-expected inflation data damped the possibility for a near-term interest rate hike.
Data revealed that Australia's consumer price index (CPI) advanced 0.6% on a quarterly basis in 3Q 2017, undershooting market expectations for a gain of 0.8%. In the previous quarter, the CPI had advanced 0.2%.
The pair is expected to find support at 0.7692, and a fall through could take it to the next support level of 0.7656. The pair is expected to find its first resistance at 0.7795, and a rise through could take it to the next resistance level of 0.7862.
The currency pair is trading below its 20 Hr and 50 Hr moving averages.

Euro-Zone’s Manufacturing Sector Activity At A 6-Year High In October, Services Sector Growth Cooled To A 2-Month Low In...
For the 24 hours to 23:00 GMT, the EUR rose 0.13% against the USD and closed at 1.1765, buoyed by a stronger-than-expected reading on the Euro-zone manufacturing sector.
Data showed that the Euro-zone's preliminary Markit manufacturing PMI unexpectedly climbed to a level of 58.6 in October, hitting its highest level since February 2011 and suggesting that manufacturing sector will continue to propel growth in the common currency region. Markets had expected the PMI to fall to a level of 57.8, after recording a reading of 58.1 in the previous month. On the contrary, the region's flash Markit services PMI declined more-than-anticipated to a level of 54.9 in October, expanding at its weakest pace in two months. The PMI had recorded a reading of 55.8 in the prior month, while investors had envisaged for a fall to a level of 55.6.
Separately, activity in Germany's manufacturing sector slightly eased to a level of 60.5 in October, against market consensus for a fall to a level of 60.0. In the previous month, the PMI had recorded a reading of 60.6. Meanwhile, the nation's services sector growth slowed to a level of 55.2 in October, more than market expectations for a drop to a level of 55.5 and following a reading of 55.6 in the previous month.
The greenback gained ground against a basket of major currencies, driven by reports that Republican Senators are leaning towards John Taylor to be the next head of the Federal Reserve.
Gains in the US Dollar were supported further, following a pair of upbeat economic releases in the US that pointed towards improving economic conditions in the world's largest economy.
The flash Markit manufacturing PMI in the US advanced to a nine-month high level of 54.5 in October, topping market expectations for a rise to a level of 53.4 and following a reading of 53.1 in the previous month. Further, the nation's preliminary Markit services PMI recorded an unexpected rise to a level of 55.9 in October, expanding at its quickest pace in eight months. Markets had expected the PMI to fall to a level of 55.2, compared to a level of 55.3 in the prior month.
Other data indicated that the nation's Richmond Fed manufacturing index sharply eased to a level of 12.0 in October, compared to a reading of 19.0 in the previous month, while market participants had anticipated for a drop to a level of 17.0.
In the Asian session, at GMT0300, the pair is trading at 1.1760, with the EUR trading slightly lower against the USD from yesterday's close.
The pair is expected to find support at 1.1738, and a fall through could take it to the next support level of 1.1715. The pair is expected to find its first resistance at 1.1788, and a rise through could take it to the next resistance level of 1.1815.
Moving ahead, investors would eye Germany's Ifo expectations and business climate indices for October, slated to release in a few hours. Moreover, the US flash durable goods orders and new home sales, both for September, set to release later in the day, will keep investors on their toes.
The currency pair is showing convergence with its 20 Hr and 50 Hr moving averages.
