Sample Category Title
EURUSD Analysis: Fails To Climb Above 100-Hour SMA
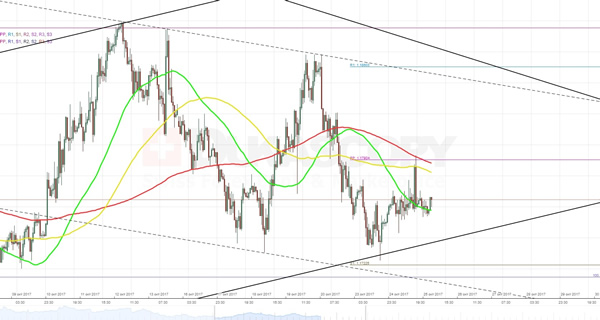
Previous trading session was marked by attempt to elevate the pair above the 1.1780 level amid concerns over President Trump’s tax reform. However, the surge was successfully neutralized by the 100-hour SMA that was additionally backed up by the weekly PP and the 200-hour SMA. As a result, the pair slipped back to the 55-hour SMA. Until release of data on the US Core Durable Goods Orders the pair is likely to fluctuate near the 1.1760 mark. Depending on result, the exchange rate might either jump and clash with the above combined resistance or fall and hit the bottom trend-line of junior ascending channel. Even if this pattern does not sustain, a deep plunge will be still unlikely as an area between 1.1725 and 1.1722 represents notable support level.
USDJPY Analysis: Fluctuates In Ascending Triangle
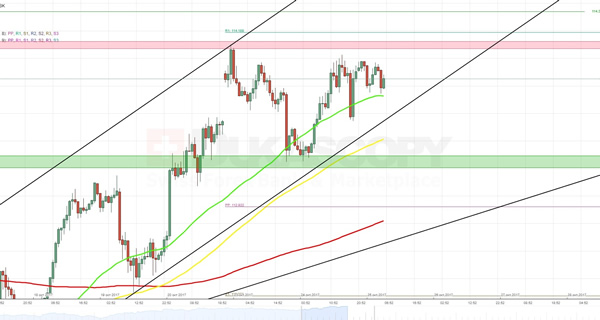
A number of failed attempts to break through the 114.00 resistance level as well as inability of the rate to slip below the rising 55- and 100-hour SMAs confirmed an assumption that the pair is fluctuating in an ascending triangle pattern. A release of information on the US Core Durable Goods Orders later this day provides a good opportunity to make a breakout from it. At the moment, the northern side looks more reliably secured due to additional barrier set up by the weekly R1 at 113.19. The southern side, in contrast, is protected only by moving averages, which are located quite far away from each other. In addition to that, there is a need to take into account that the average market sentiment is 61% bearish.
XAUUSD Analysis: Trades In Falling Wedge
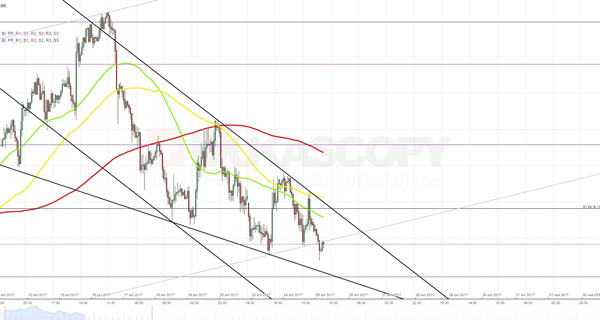
The exchange rate has finally made a breakout from the medium-term ascending channel. The plunge was caused by a rebound from the upper-trend line of the junior descending channel that was additionally backed up by the 100-hour SMA near 1,281.00. In the meantime, narrowing fluctuations of the rate indicate that the above channel is gradually transforming into the falling wedge formation. If this is the case, then a combined support formed by the lower line of the pattern in conjunction with the weekly S1 at 1,269.58 is expected to neutralize the fall after release of information on the US purchase orders. There are similar expectations for the opposite direction, which should be reliably secured by the 55- and 100-hour SMAs that are slipping along the resistance line of the wedge.
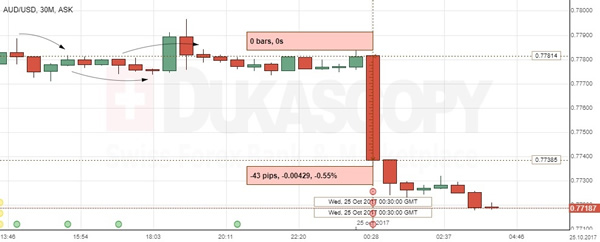
AUD/USD: AU Consumer Price Index
The Australian Dollar weakened significantly against the Greenback on the disappointing quarterly CPI report. The AUD/USD currency pair dropped 0.55% or 43 base points to the 0.7738 mark to continue slipping below the aforementioned level.
The Australian Bureau of Statistics revealed that the country's consumer inflation grew at a weaker pace of 0.6% in the Q3, missing expectations for a 0.8% expansion. The modest increase was fuelled by higher travel, tobacco and utility prices, offsetting reduced costs of telecommunication, fuel and vegetables. The results hurt the possibility of the Reserve Bank of Australia's interest rate hike in the near-term, as the yearly inflation growth remained under the 2.0% target.
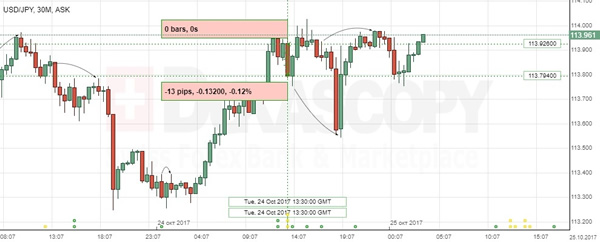
USD/JPY: US Manufacturing PMI
The Dollar was dragged slightly against the Japanese Yen after the disappointing PMI reports for the US. The USD/JPY dropped 13 base points to the 113.79 mark, but remained at the relatively strong level recovered after the decline triggered by the Japan's PM Shinzo Abe election victory.
The preliminary PMI report for the US services and manufacturing sectors showed better-than-expected readings of 55.9 and 54.5, respectively. The expansion indicators bolstered optimism over the US economy, though the bullish release failed to encourage the Greenback. Preliminary data was likely to confirm projections for the Federal Reserve to announce the interest rate hike at the December meeting.
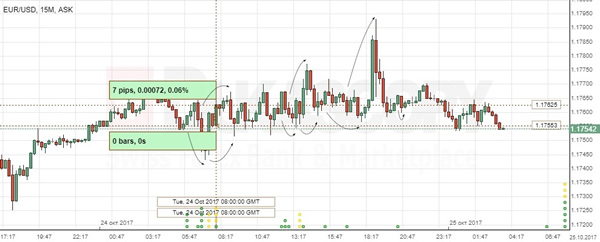
EUR/USD: EU Services PMI
The Euro was left without any bullish support after Markit released several PMI reports for the EZ counties. The EUR/USD currency pair was zigzagging within the 1.1750-1.1770 range and finished the session at the 1.1758 mark.
Markit published its preliminary report showing the Eurozone's Services PMI at a weaker level of 54.9 in October, though, as well as manufacturing, the sector continued solid growth. Meanwhile, France and Germany marked an expansion of both manufacturing and services industries in the same period, remaining the main contributors to the Euro zone's good economic condition. The pair is expected to be shaken on Thursday, when the ECB makes its monetary policy announcement.
Technical Outlook: WTI Oil Eases From Fresh High Ahead Of US Crude Inventories Data
Oil price eases in early Wednesday's trading, in reaction on unexpected build in crude stocks. API report, released in late Tuesday, showed crude stocks rose nearly 0.6 million barrels previous week, against expectations for 0.4 million barrels draw.
The pullback from Tuesday's high at $52.59, the highest in one month, could be seen as consolidation ahead of fresh upside and eventual break above key $52.84 barrier (28 Sep high).
Techs remain firmly bullish and supportive for further advance, as oil prices were recently driven by strong bullish sentiment on strong signs of oil market rebalancing and comments from Saudi Arabia on Tuesday, which showed readiness to extend current production cut plan.
Yesterday's rally and eventual close above one-week congestion tops was bullish signal, with traders positioning for today's EIA crude inventories report. US crude stocks and are expected to reduce by 2.5 million barrels in the previous week, which would be supportive for oil prices.
Otherwise, stronger pullback could be anticipated if report shows build in crude inventories.
Support at $52.00 stays intact for now, guarding more significant $51.64 support (rising Tenkan-sen).
Res: 52.59, 52.84, 53.73, 54.27
Sup: 51.96, 51.64, 51.17, 50.86
Daily Technical Analysis: EURUSD, GBPUSD, USDJPY, USDCHF
EURUSD
The EURUSD attempted to push higher yesterday topped at 1.1792 but closed lower at 1.1761 and unable to consistently move above the H1 EMA 200. The bias is neutral in nearest term. Immediate resistance is seen around 1.1792. A clear break above that area could trigger further bullish pressure testing the upper line of the bearish channel located around 1.1840 region but key resistance remains at 1.1900. Immediate support is seen around 1.1725. A clear break below that area would expose 1.1670 key support, which is the “neckline” of the “head and shoulders” formation on daily chart.
GBPUSD
The GBPUSD had a bearish momentum yesterday bottomed at 1.3113. The bias is bearish in nearest term testing the trend line support and the daily EMA 200 located around 1.3000 area which is a good place to buy with a tight stop loss. Immediate resistance is seen around 1.3150. A clear break above that area could lead price to neutral zone in nearest term testing 1.3200 region. Overall I remain bullish but need a clear break above 1.3330 key resistance to reactivate my bullish mode targeting 1.3615 area
USDJPY
The USDJPY had a bullish momentum yesterday topped at 114.02. The bias is bullish in nearest term especially if price able to break above 114.10 testing 114.50 key resistance which is a good place to sell with a tight stop loss. Immediate support is seen around 113.50/20 region. A clear break below that area could lead price to neutral zone in nearest term testing 112.85 area. On the upside, a clear break and daily close above 114.50 would expose 115.50 region. Overall I remain neutral.
USDCHF
The USDCHF had a bullish momentum yesterday topped at 0.9911 following a clear break above 0.9881 which nullifies the bearish pin bar scenario. The bias is bullish in nearest term testing 0.9950 – 1.0000 region. Immediate support is seen around 0.9881. A clear break below that area could lead price to neutral zone in nearest term testing 0.9835/00 region.
EURJPY Near-Term Bias Shifts To The Upside, Bullish Short-Term Signals
EURJPY holds a neutral intraday bias as prices consolidate in the upper 133 handle after a rebound from 131.65 (October 16 low). More upside is possible since a bullish signal was given by the crossover of the Tenkan-sen line above the Kijun-sen line on the 4-hour chart last week and prices are currently trading above these lines.
In the bigger picture, EURJPY was consolidating after peaking at 134.40 on September 22. The Ichimoku cloud on the 4-hour chart was moving sideways since early October but is starting to point up, shifting near-term risk to the upside.
Immediate resistance lies at 134.40 (September 22 high). A sustained break above this would confirm a resumption of the recent uptrend that started from 129.36. EURJPY seems to be well supported above 133.64, which is the Tenkan-sen line. If this support level holds, it will increase the odds for another leg higher in the coming days.
A dip below 133.64 would find further support at 133.32 (Kijun-sen) ahead of the key 133.00 level. Breaking this support would shift the focus to the downside with scope to reach the lower end of the range at 131.65, and then from here confirming a reversal of the recent uptrend from 129.36.
Overall, the 4-hour chart shows signs of bullish momentum in the near term as the market continues to progress towards the top of the range and above the Ichimoku cloud.
Technical Outlook: USDJPY – Tuesday’s Bullish Engulfing Signals Further Upside
The pair holds firm tone on Wednesday and consolidating under fresh over three-month high 114.09, posted on Monday.
Tuesday's strong rally reversed losses of the previous day and generated bullish signal on formation of bullish engulfing pattern.
Yen's weakness is boosted by strong rise of Nikkei index which moves in uninterrupted steep ascend.
Bullish techs are supportive for further advance and test of key barriers at 114.33 (Fibo 61.8% of 118.66/107.31 descend) and 114.36/49 (11 May / 11 July former tops), break of which would generate strong bullish signals.
Caution on overbought slow stochastic on daily chart and RSI showing hesitation ahead of overbought zone boundary, which may keep the pair in extended consolidation before bulls resume.
Higher base on Mon/Tue at 113.24 should ideally contain dips and keep intact next strong support and pivotal point at 112.87 (rising 10SMA / sideways-moving Tenkan-sen).
Res: 114.09, 114.33, 114.50, 115.00
Sup: 113.73, 113.48,113.24, 112.87