Sample Category Title
AUD/USD Collapse
AUD/USD has weakened. Monitor the key support at 0.7571. Hourly resistance is given at 0.7897 (13/10/2017 high). Further support lies at at 0.7733 (06/10/2017 low). Expected to show continued decline
In the long-term, the trend is turning positive. Key supports stands at 0.6009 (31/10/2008 low) . A break of the key resistance at 0.8164 (14/05/2015 high) is needed to invalidate our long-term bearish view.
USD/CAD Easy Clear Of Resistance At 1.2636
USD/CAD break of resistance at 1.2636 suggest and extension of bullish momentum. Hourly support lies at 1.2331 (26/09/2017 high). Expected to show continued short-term bullish pressures within uptrend channel.
In the longer term, the pair has broken long-term support that can be found at 1.2461 (16/03/2015 low). Strong resistance is given at 1.4690 (22/01/2016 high). The pair is likely to head further lower
USD/CHF Strong Momentum
USD/CHF is seeing a slight pause of bullish momentum. The technical structure suggests an improving short-term buying interest. Expected to show continued bullish pressures within uptrend channel. Hourly support stands at 0.9712 (12/10/2017 low).
In the long-term, the pair is still trading in range since 2011 despite some turmoil when the SNB unpegged the CHF. Key support can be found 0.8986 (30/01/2015 low). The technical structure favours nonetheless a long term bullish bias since the unpeg in January 2015.
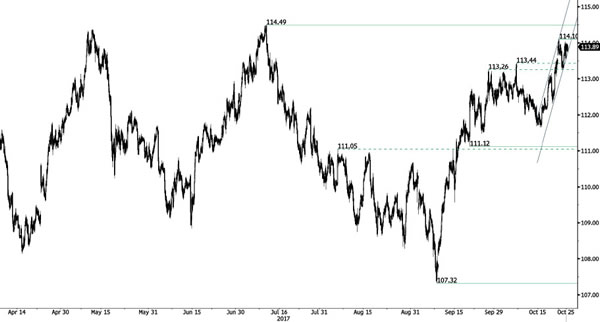
USD/JPY Weakening Short-Term Bullish Momentum?
USD/JPY has bounced back after setting a new hourly resistance at 114.10 (23/10/2017 high). Next key resistance can be found at 114.49 (11/07/2017 high). Support is located at 111.12 (20/09/2017 low).
We favor a long-term bearish bias. Support is now given at 99.02 (10/08/2013 low). A gradual rise towards the major resistance at 125.86 (05/06/2015 high) seems unlikely. Expected to decline further support at 93.79 (13/06/2013 low).
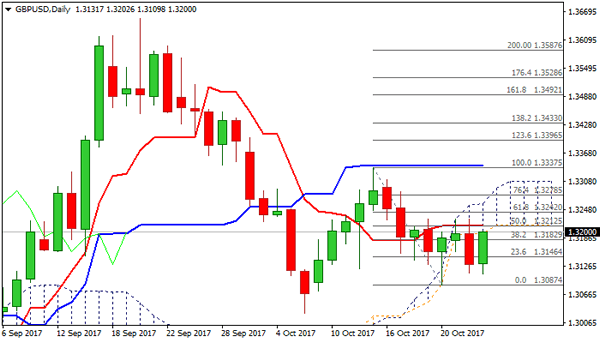
GBP/USD Further Weakness
GBP/USD has successfully tested resistance at (1.3229 reaction high) bouncing towards 1.3027 support. Key resistance stands at 1.3229 then 1.3338 (13/10/2017 high). Key support can be found at (1.3088 12/10/2017 low).
The long-term technical pattern is reversing. The Brexit vote had paved the way for further decline. Long-term support can be found at 1.1841 (07/10/2017 low). Long-term resistance given around 1.35 is at stake and indicates a long-term reversal in the negative trend. Yet, it is very unlikely at the moment.

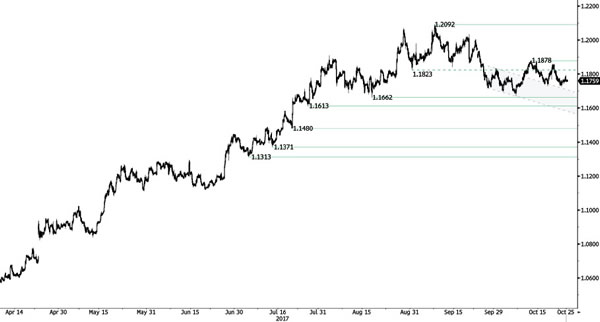
EUR/USD Bearish Pause
EUR/USD remains safety above hourly support at 1.1725 (23/10/20107 low). Break will trigger bearish extension to strong support given at a distance at 1.1662 (17/08/2017 low). Key resistance is located at 1.1878 (12/10/2017 high). Expected to show further short-term weakness.
In the longer term, the momentum is now turning largely positive. We favour a continued bullish bias. Key resistance is holding at 1.2252 (25/12/2014 high) while strong support lies at 1.0341 (03/01/2017 low).
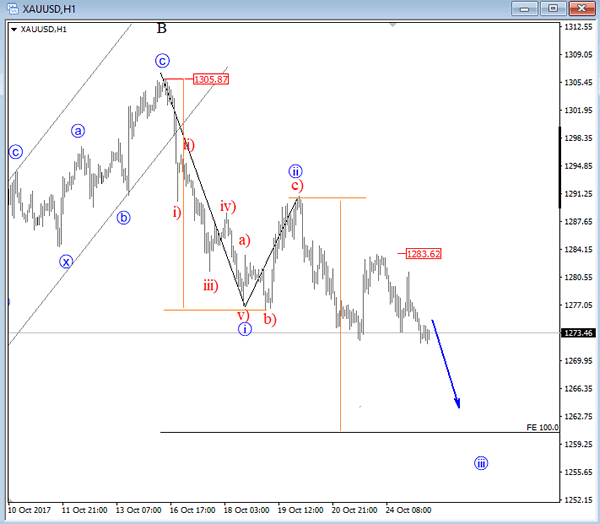
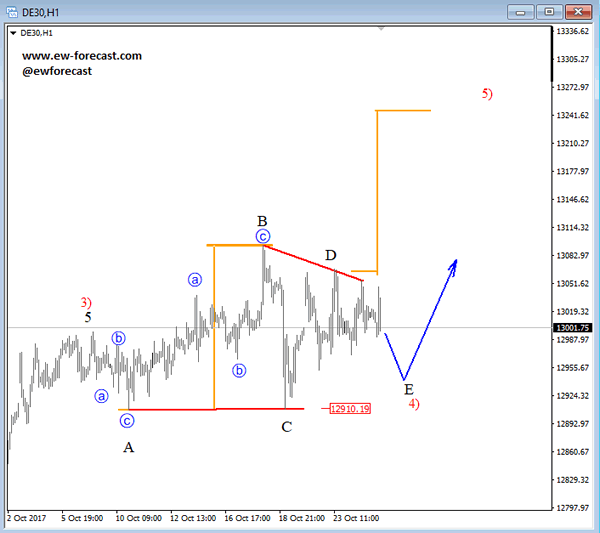
Elliott Wave Analysis: Gold And German DAX
Gold is back at the low of the week, making a bearish trend from 1305 because of lower lows and lower swing highs, as such, we think that current weakness may resume down to 1260 Fib. equality level measured from a top of wave one and from wave two highs.
GOLD, 1H
No change on DAX; price is still slow as market awaits ECB for Thursday, when we may finally see a breakout of a current October range. There is a five sub-wave move in a contracting range, seen as a triangle that is expected to push price higher into wave five. Break above 13070 may open room for recovery to 13200/13250.
German DAX, 1H
Technical Outlook: GBPUSD – Better Than Expected UK GDP Boosts Cable And Cements Expectations Of BoE Rate Hike Next...
Cable bounced from dangerous zone after better than expected UK GDP data and is focusing again daily cloud base resistance (1.3196).
Gross Domestic Product showed stronger than expected growth in Q3 (0.4% vs 0.3% forecast) which further boosts the idea on BoE rate hike on next week's meeting.
Fresh bullish sentiment underpins cable for renewed probe through cloud base / Tenkan-sen (1.3196/1.3212), break of which would open next key barrier at 1.3228 (triple upside rejection) for retest.
Twisting 4-hr cloud (1.3207) also attracts near-term bulls.
Close above 1.3228 pivot is needed to turn near-term structure into full bullish mode for further advance and test of daily cloud top (1.3260).
Res: 1.3212, 1.3228, 1.3242, 1.3260
Sup: 1.3182, 1.3146, 1.3100, 1.3087
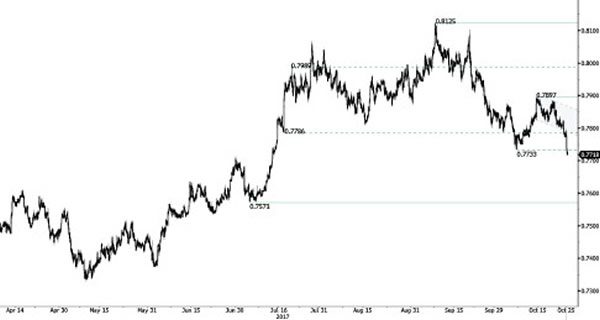
AUD Tests Key Support As Inflation Falls, Gold Inches Down
AUD loses ground amid disappointing inflation data
The Australian dollar took a hit during the Asian session after the release of disappointing inflation data. AUD/USD slid to 0.7707, its lowest July since mid-July, as investors discount further a hawkish shift from the Reserve Bank of Australia. The Australian economy started the year positively suggesting that the country had successfully reduced its dependence to the mining sector, while on the inflation front, price pressure was finally picking up.
Nevertheless, over the last few month clouds started to gather at the horizon. Over the summer, the pace of retail sales growth slid into negative territory, while the minutes of the last RBA meeting came with a dovish done which suggest the central bank is in no hurry to lift interest rate before at least mid-2018.
Released this morning, the weak inflation data for the third quarter was the final nail in the coffin for a hawkish shift from the RBA as the institution has now a legitimate excuse to wait longer and can save its “Aussie strength” argument for later. The consumer price index growth fell to 1.8%y/y (versus 2.0% expected) compared to 1.9% in the second quarter. The trimmed mean measure held at 1.8%y/y, below expectation of 2.0%.
We maintain our bearish on the Aussie, especially against the greenback, as the political situation is moving in the direction for investors which should revive the reflation trade. In addition, the Fed has initiated the process to unload its balance and is expected to lift borrowing cost one more time before the end of the year. It definitely makes a good case for betting on the greenback.
Gold in the doldrums
The spot price of an ounce of Gold is edging lower over the uncertainties on the next Fed Chair. An ounce of Gold is now trading around $1273 down around 0.25% in the last 24 hours. Gold is definitely under pressure since Donald Trump issued a report stating that he would likely nominate John Taylor as the new head of the Federal Reserve. Indeed Taylor is strong partisan of increasing interest rates to 1.25%.
Gold price also continues to suffer as there is also the fact the North-Korean threat has not been taken seriously by markets and the move towards safe haven that we saw in the precious metal’s prices, going from $1200 to $1325 between July and September, did not continue.
On top of that, there are clear downside pressures despite recent soft data in the US economy. September Building permits slowed down to 1.22 million vs 1.25 estimates. Housing starts also missed the forecasts of 1.18 million with a release at 1.13 million. Nonetheless other data such as the Manufacturing PMI came in better than expectations. The October US Manufacturing PMI index climbed to 54.1 from 53.1 a month earlier. This will likely continue weighing on the gold price at least in the short-term.
As usual markets can turn very positive regarding the US economy and for any US related-news which drive the price of the precious metals lower. We are now entering again in a period of over-optimism. Reloading gold position below $1250 is definitely going to be a great bargain.
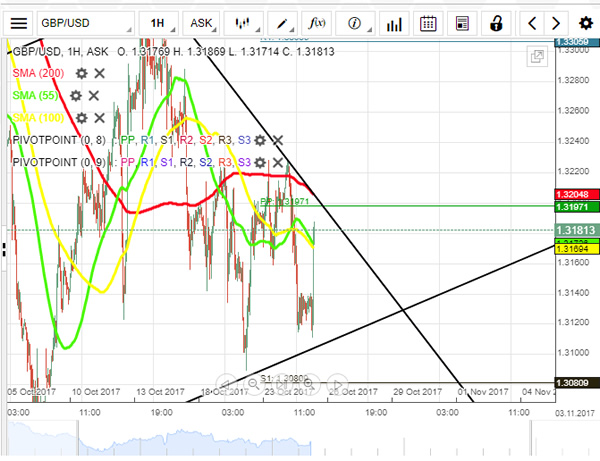
GBPUSD Analysis: Awaits GDP Release In Symmetrical Triangle
Due to growing fears about hard Brexit possibility the Sterling depreciated against the Dollar by 104 basis points. From technical perspective this plunge matched with a rebound from the upper trend-line of a dominant descending channel towards the bottom edge of a smaller ascending channel.
Until release of data on the UK quarterly GDP the cable is likely to consolidate near the 38.2% Fibonacci retracement level located at the 1.3145 mark. In case of positive news the pair might surge straight to the 1.3170 level that will be secured by the 100- and 55-hour SMA.
In the opposite scenario, there is a high chance that bears will succeed to push the pair from the symmetrical triangle pattern. In that case the Pound most probably is going to depreciate against the Dollar in the foreseeable future.