
Sample Category Title
Swiss Franc Trading Marginally Higher This Morning
For the 24 hours to 23:00 GMT, the USD rose 0.25% against the CHF and closed at 0.9781.
In the Asian session, at GMT0300, the pair is trading at 0.9778, with the USD trading a tad lower against the CHF from yesterday’s close.
The pair is expected to find support at 0.9756, and a fall through could take it to the next support level of 0.9735. The pair is expected to find its first resistance at 0.9804, and a rise through could take it to the next resistance level of 0.9831.
Amid a lack of macroeconomic releases in Switzerland today, traders would focus on global macroeconomic events for further direction.
The currency pair is trading between its 20 Hr and 50 Hr moving averages.

Loonie Trading On A Stronger Footing This Morning
For the 24 hours to 23:00 GMT, the USD slightly declined against the CAD and closed at 1.2514.
In the Asian session, at GMT0300, the pair is trading at 1.2501, with the USD trading 0.1% lower against the CAD from yesterday’s close.
The pair is expected to find support at 1.2462, and a fall through could take it to the next support level of 1.2424. The pair is expected to find its first resistance at 1.2565, and a rise through could take it to the next resistance level of 1.2630.
Ahead in the day, traders will look forward to Canada’s manufacturing shipments data for August.
The currency pair is trading below its 20 Hr and 50 Hr moving averages.

EUR/USD Daily Outlook
Daily Pivots: (S1) 1.1735; (P) 1.1767 (R1) 1.1798; More...
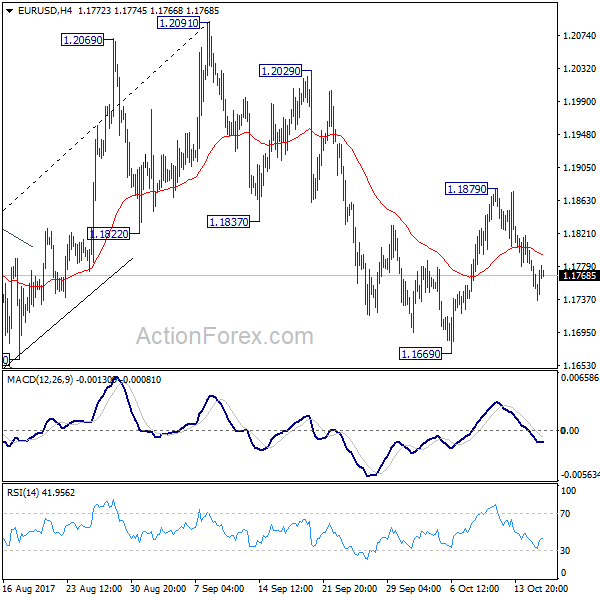
Intraday bias in EUR/USD remains mildly on the downside for 1.1669 support. Break there will confirm resumption of the whole corrective fall from 1.2091. In that case, EUR/USD will target 38.2% retracement of 1.0569 to 1.2091 at 1.1510. Strong support is expected there to complete the correction. On the upside, above 1.1879 will turn bias back to the upside for retesting 1.2091 high.
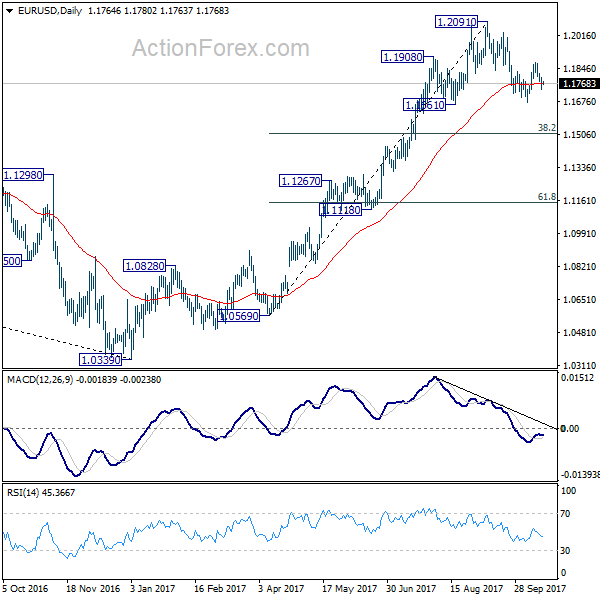
In the bigger picture, rise from medium term bottom at 1.0339 is not finished yet. It's expected to continue after pull back from 1.2091 completes. And, next target will be 38.2% retracement of 1.6039 (2008 high) to 1.0339 (2017 low) at 1.2516. However, it should be noted that there is no confirmation of trend reversal yet. That is, such rebound from 1.0399 could be a correction. And the long term fall from 1.6039 (2008 high) could resume. Hence, we'd be cautious on strong resistance from 1.2516 to limit upside.
GBP/USD Daily Outlook
Daily Pivots: (S1) 1.3136; (P) 1.3211; (R1) 1.3269; More....
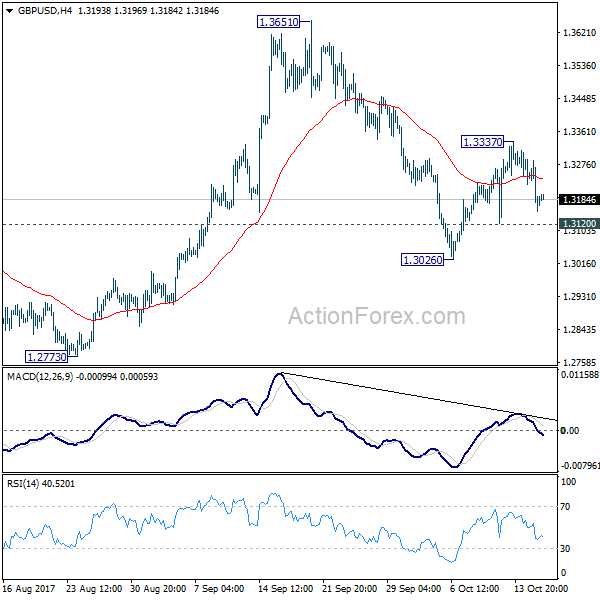
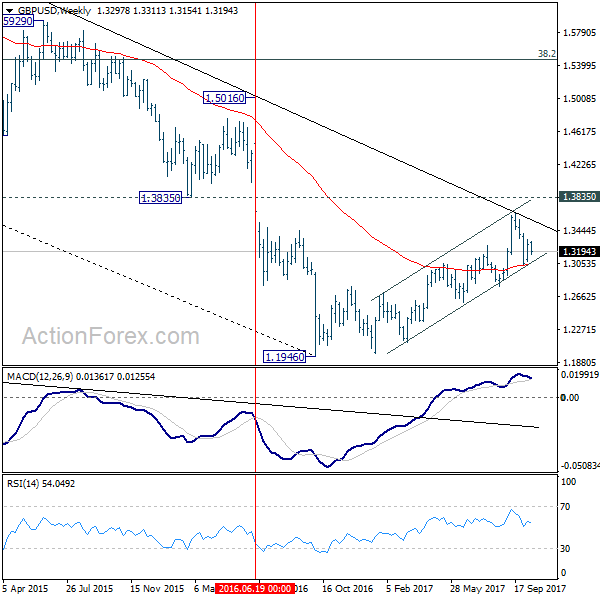
Intraday bias in GBP/USD stays neutral at this point. On the downside, break of 1.3026 minor support will indicate that recovery is completed at 1.3337. And fall from 1.3651 is resuming for 1.2773 support. That will revive that case that medium term rise from 1.1946 has completed at 1.3651. Meanwhile, above 1.3337 will bring retest of 1.3651 high instead.
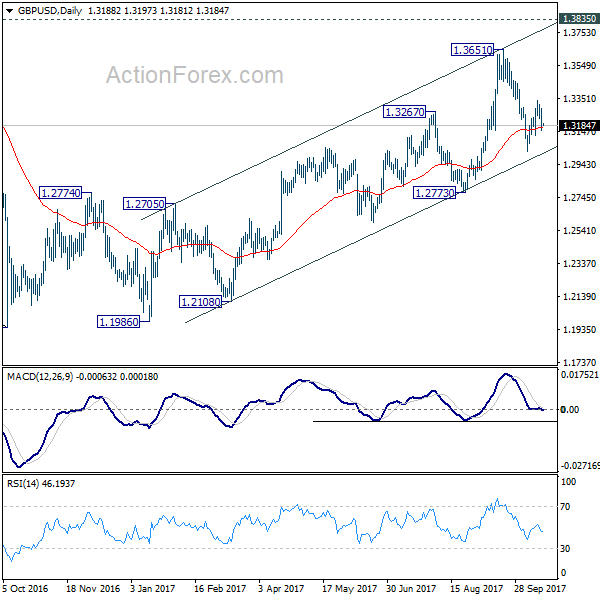
In the bigger picture, while the medium term rebound from 1.1946 was strong, GBP/USD hit strong resistance from the long term falling trend line. Outlook is turned a bit mixed and we'll turn neutral first. On the downside, decisive break of 1.2773 key support will argue that rebound from 1.1946 has completed. The corrective structure of rise from 1.1946 to 1.3651 will in turn suggest that long term down trend is now completed. Break of 1.1946 low should then be seen. On the upside, break of 1.3835 support turned resistance will revive the case of trend reversal and target 38.2% retracement of 2.1161 (2007 high) to 1.1946 (2016 low) at 1.5466.
USD/CHF Daily Outlook
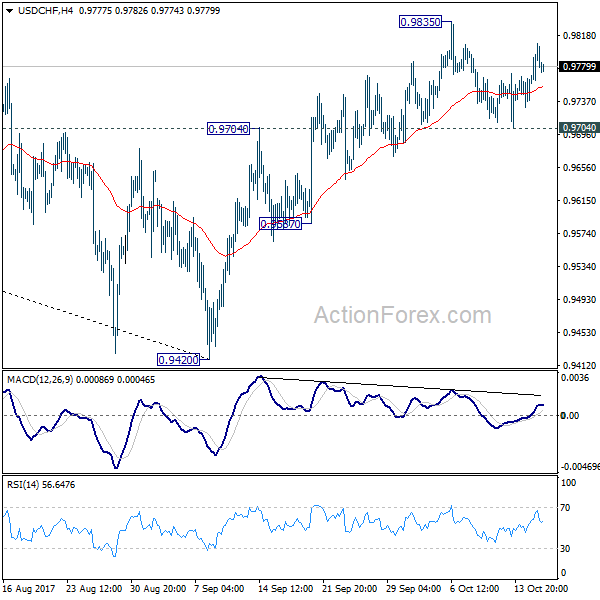
Daily Pivots: (S1) 0.9747; (P) 0.9778; (R1) 0.9814; More....
Intraday bias in USD/CHF remains neutral as it's still bounded in range of 0.9704/9835. As noted before, considering bearish divergence condition in 4 hour MACD, break of 0.9704 will argue that rebound from 0.9420 has completed. This will also mixed up the near term outlook and turn bias back to the downside for 0.9587 support. On the upside, break of 0.9835 will extend the rebound to 61.8% retracement of 1.0342 to 0.9420 at 0.9990.
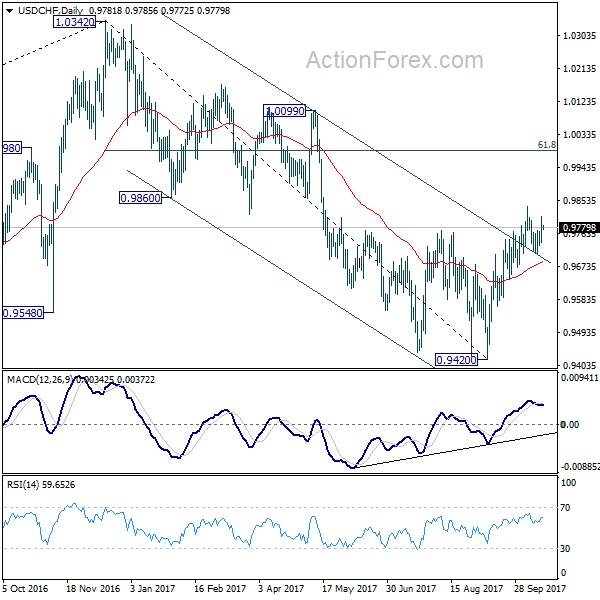
In the bigger picture, current development suggests that USD/CHF has defended 0.9443 (2016 low) key support level again. Rise from 0.9420 could develop into a medium term move and target a test on 1.0342 high. This represents the upper end of a long term range that started back in 2015. On the downside, break of 0.9587 support is now needed to indicate completion of the rise from 0.9420. Otherwise, further rally will remain in favor in medium term.
USD/JPY Daily Outlook
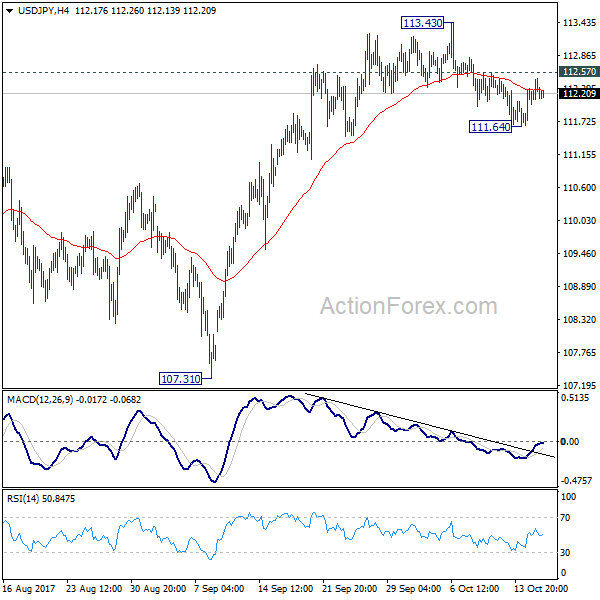
Daily Pivots: (S1) 111.99; (P) 112.23; (R1) 112.43; More...
Intraday bias in USD/JPY stays neutral first. With 112.57 minor resistance intact, another decline is in favor. Below 111.64 will target 55 day EMA (now at 111.45) first. Sustained break there will target 107.31 and possibly below. Nonetheless, above 112.57 will bring retest of 113.43. Break there will resume whole rise from 107.31 for 114.49 key resistance.
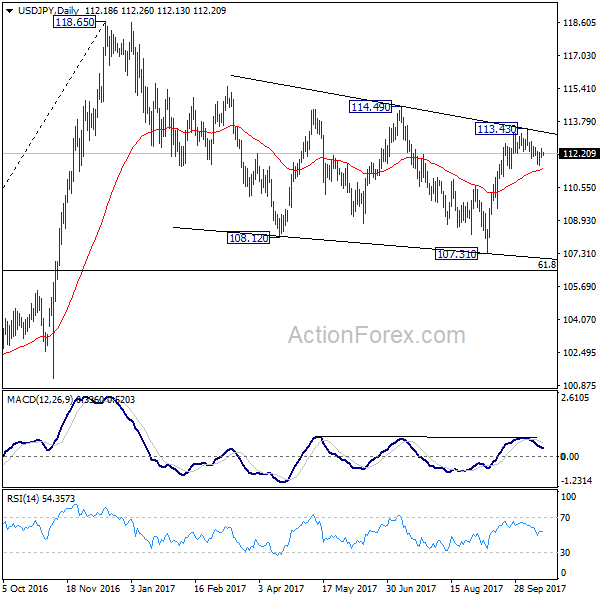
In the bigger picture, rise from 98.97 (2016 low) is seen as the second leg of the corrective pattern from 125.85 (2015 high). It's unclear whether this second leg has completed at 118.65 or not. But medium term outlook will be mildly bearish as long as 114.49 resistance holds. And, there is prospect of breaking 98.97 ahead. Meanwhile, break of 114.49 will bring retest of 125.85 high. But even in that case, we don't expect a break there on first attempt.
Daily Technical Analysis: EURUSD, GBPUSD, USDJPY, USDCHF
EURUSD
The EURUSD had a bearish momentum yesterday bottomed at 1.1736. The bias remains bearish in nearest term testing 1.1670 key support, which is the “neckline” of a “head and shoulders” formation as you can see on my daily chart below. A clear break and daily close below 1.1670 would confirm the bearish reversal scenario with nearest target seen at 1.1450. Immediate resistance is seen around 1.1800. A clear break above that area could lead price to neutral zone in nearest term testing 1.1850 but key resistance remains at 1.1900 which need to be clearly broken to the upside to potentially resume the major bullish trend testing 1.2000 – 1.2090 region.
GBPUSD
The GBPUSD continued to trade lower yesterday bottomed at 1.3154. The bias remains bearish in nearest term especially if price able to make a clear break below 1.3150 testing the daily EMA 200 and the major trend line support located around 1.3000 – 1.2950 region. Immediate resistance is seen around 1.3225. A clear break above that area could lead price to neutral zone in nearest term testing 1.3285 area but key resistance remains at 1.3330 region which need to be clearly broken to the upside to reactivate my bullish mode.
USDJPY
The USDJPY was indecisive yesterday. Price attempted to push higher topped at 112.47 but closed a little bit lower at 112.18. The bias is neutral in nearest term probably with a little bearish bias testing 111.65 support area. A clear break and daily close below that area would expose 111.00 – 110.65 area. Immediate resistance is seen around 112.47. A clear break and daily close above that area would retest 113.20 key resistance area. Overall I remain neutral.
USDCHF
The USDCHF had a bullish momentum yesterday topped at 0.9808 but closed a little bit lower at 0.9783. The bias is bullish in nearest term but only a clear break back above 0.9807/36 key resistance would nullify the bearish pin bar scenario and activate my bullish mode with nearest target seen at 0.9950. Immediate support is seen around 0.9765/50. A clear break below that area could lead price to neutral zone in nearest term but would keep the bearish pin bar scenario alive and kicking testing 0.9700 area. Overall I remain neutral.
AUD/USD Daily Outlook
Daily Pivots: (S1) 0.7822; (P) 0.7841; (R1) 0.7864; More...
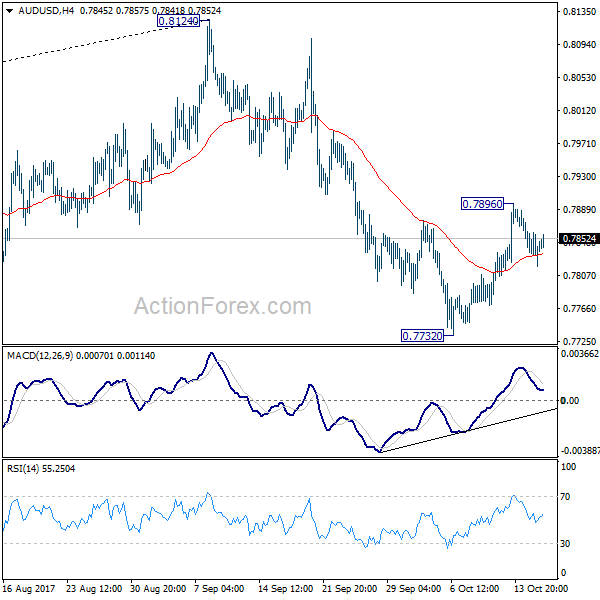
Intraday bias in AUD/USD remains neutral for the moment. Another rise is mildly in favor and break of 0.7896 will target a test on 0.8124 high. But we'd be cautious on strong resistance from there to limit upside and bring another fall to extend the corrective pattern. On the downside, break of 0.7732 will resume the decline from 0.8124 and target medium term fibonacci level at 0.7628 first.
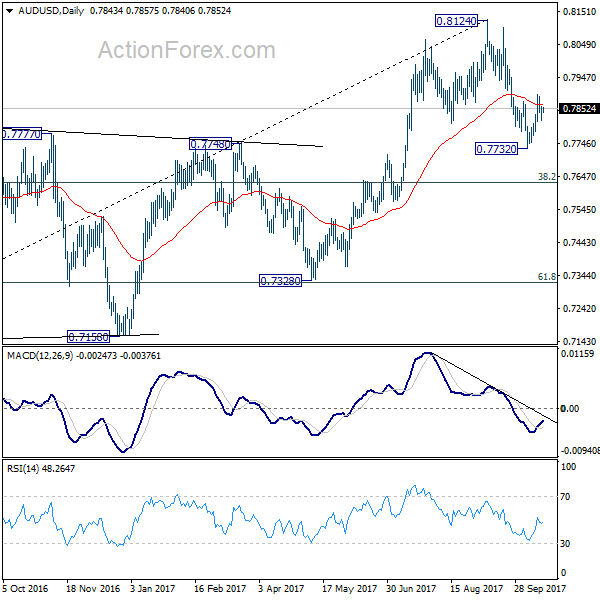
In the bigger picture, rise from 0.6826 medium term bottom is seen as corrective pattern. Current development suggests that it might be completed with three waves up to 0.8124 already. Break of 38.2% retracement of 0.6826 to 0.8124 at 0.7628 will firm this bearish case. And, decisive break of 0.7328 key cluster support (61.8% retracement at 0.7322) will confirm and bring retest of 0.6826 low. In case rise from 0.6826 resumes and extends, strong resistance should be seen at 38.2% retracement of 1.1079 to 0.6826 at 0.8451 to limit upside.
USD/CAD Daily Outlook
Daily Pivots: (S1) 1.2491; (P) 1.2541; (R1) 1.2569; More....
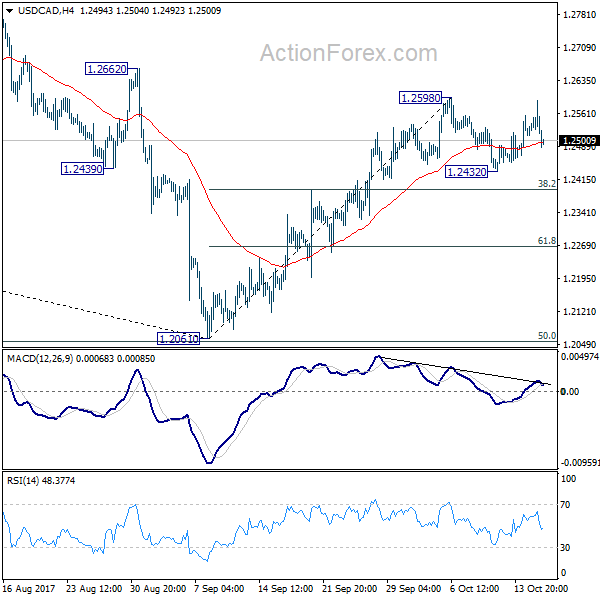
USD/CAD's rebound was limited below 1.2598 and weakened again. Intraday bias is turned neutral first. Consolidation from 1.2598 is still in progress. In case of deeper fall, we'd now expect downside to be contained by 38.2% retracement of 1.2061 to 1.2598 at 1.2393 to bring rally resumption. On the upside, break of 1.2598 will extend the rebound from 1.2061 to 1.2777 resistance next.
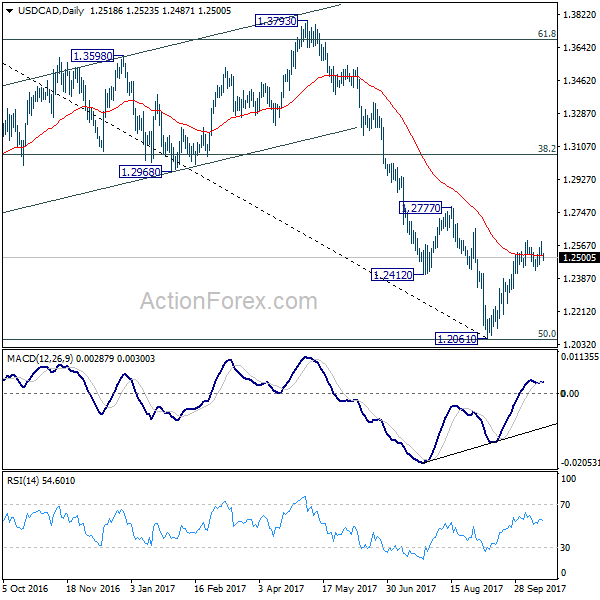
In the bigger picture, USD/CAD should have defended 50% retracement of 0.9406 (2011 low) to 1.4869 (2016 high) at 1.2048. And with 1.2048 intact, we'd favor the case that fall from 1.4689 is a correction. Break of 1.2777 will further affirm this bullish case. That is, larger up trend from 0.9406 is not completed. And in that case, USD/CAD should target 1.3793 resistance next. However, on the other hand, firm break of 1.2048 will indicate that fall from 1.4689 is at least a medium term down trend and should target 61.8% retracement at 1.1424 and below.
Dollar Firm but Losing Momentum as Fed Chair Race Goes On
Dollar is trading as the strongest one for the week. The greenback was lifted by talks that John Taylor is considered a hawk and has impressed US President Donald Trump in Fed chair interview. But momentum in the greenback is rather weak as it struggled to extend gains in late US session. Dollar was also weighed down mildly by falling yields, with 10 year yield closed down -0.09 at 2.298. Sterling is extending this week's decline as markets are reassessing the dovish possibilities of November BoE meeting. Meanwhile, Canadian Dollar rebounded as NAFTA negotiation is extended. UK job data will be the main focus today. Markets will also keep an eye on Chinese Communist Party Congress in Beijing.
Trump likes Taylor for his hawkishness? Or flexibility?
Dollar's rally since yesterday was built on top of speculations that Standford University economist John Taylor is catching up in the race as the next Fed chair. Analysts point to the fact that Taylor is known for the so called Taylor rule, which implies higher interest rate. He has also criticized Fed's ultra-loose monetary policy before and is seen by some as the most hawkish candidate. However, we'd like to point out again that firstly, US President Donald Trump would likely prefer someone who he can work well with, rather than someone who's most suitable for the job. Or maybe in better words, Trump would see someone he can work well with as the most suitable one, not from Fed's operation nor market stability angle. Secondly, Taylor has demonstrated his flexibility in recent speeches, as he said that rules shouldn't be used as a "way to tie central bankers' hands." Instead, "there are reasons to run policy with a strategy." It could be his "flexibility" that impressed Trump, not his "hawkishness."
Markets reassessing dovish possibilities for BoE November meeting
Sterling was sold off yesterday even though CPI hit 3% level in September. BoE Governor Mark Carney also reiterated that "the judgment of the majority of the committee is some raise in interest rates over the coming months may be appropriate". The developments affirmed the central case of a November BoE hike. However, markets are starting to look at some dovish scenarios. Firstly, a November hike is still not a done deal, even though it's the most likely scenario. Secondly, the vote split could be dovish if hawks just win by a margin. Thirdly and most importantly, it could just be a one-off. As we pointed out before, a 25bps hike just brings the Bank Rate back to pre-Brexit referendum level. Back then, GBP/USD was above 1.3835 key support level. And since then federal funds rate was raised from 0.50% to 1.25%, and another hike is coming in December. Based on this, a break above 1.3835 handle in GBP/USD is not justifiable. And upside potential is rather limited.
EU to start preparing trade talks with UK
Ahead of the EU summit later this week, officials are already starting to prepare for trade negotiation with UK after Brexit. It's reported that EU is targeting to have a road map ready by December. And the after the December summit, it's hopeful that sufficient progress is being made on the negotiations to move on to trade talks. But for the moment, preparation work will only be carried out within EU. EU's chief Brexit negotiator said that "this week's European Council will be a stepping stone toward the next get-together." And, "I have said we are ready to accelerate the rhythm, but to accelerate you need two." However, UK's Brexit Secretary David Davis said yesterday that "we are reaching the limits of what we can achieve without consideration of the future relationship." Davis's comments suggests he is unwilling to revolve the key issues of the "past" like the divorce bill, before talking about the "future" trade agreements.
Loonie rebounds as NAFTA negotiations extend
Canadian Dollar rebounded overnight on news regarding North American Free Trade Agreement negotiation. The fourth round of NAFTA negotiation concluded yesterday. U.S. Trade Representative Robert Lighthizer, Mexican Economy Minister Ildefonso Guajardo and Canadian Foreign Minister Chrystia Freeland jointly postponed the target from December to March 2018. The time between negotiating rounds were also extended to give everyone more room to study the proposals. This is seen as a sign of willingness to resolve the differences between the parties. While it's unlikely, there were some speculations that NAFTA could be ripped to zero as the worst case scenario.
On the data front
Australia Westpac leading index rose 0.1% mom in September. UK employment data will be the key focus in European session. Later in the day, Canada will release manufacturing shipments. US will release housing starts and building permits. Fed will also release Beige Book economic reports.
USD/CAD Daily Outlook
Daily Pivots: (S1) 1.2491; (P) 1.2541; (R1) 1.2569; More....
USD/CAD's rebound was limited below 1.2598 and weakened again. Intraday bias is turned neutral first. Consolidation from 1.2598 is still in progress. In case of deeper fall, we'd now expect downside to be contained by 38.2% retracement of 1.2061 to 1.2598 at 1.2393 to bring rally resumption. On the upside, break of 1.2598 will extend the rebound from 1.2061 to 1.2777 resistance next.
In the bigger picture, USD/CAD should have defended 50% retracement of 0.9406 (2011 low) to 1.4869 (2016 high) at 1.2048. And with 1.2048 intact, we'd favor the case that fall from 1.4689 is a correction. Break of 1.2777 will further affirm this bullish case. That is, larger up trend from 0.9406 is not completed. And in that case, USD/CAD should target 1.3793 resistance next. However, on the other hand, firm break of 1.2048 will indicate that fall from 1.4689 is at least a medium term down trend and should target 61.8% retracement at 1.1424 and below.
Economic Indicators Update
| GMT | Ccy | Events | Actual | Forecast | Previous | Revised |
|---|---|---|---|---|---|---|
| 23:30 | AUD | Westpac Leading Index M/M Sep | 0.10% | -0.08% | ||
| 08:30 | GBP | Jobless Claims Change Sep | 3.2K | -2.8K | ||
| 08:30 | GBP | Claimant Count Rate Sep | 2.30% | |||
| 08:30 | GBP | ILO Unemployment Rate 3M Aug | 4.30% | 4.30% | ||
| 08:30 | GBP | Average Weekly Earnings 3M/Y Aug | 2.10% | 2.10% | ||
| 12:30 | CAD | Manufacturing Shipments M/M Aug | -0.30% | -2.60% | ||
| 12:30 | USD | Housing Starts Sep | 1.18M | 1.18M | ||
| 12:30 | USD | Building Permits Sep | 1.25M | 1.27M | ||
| 14:30 | USD | Crude Oil Inventories | -2.7M | |||
| 18:00 | USD | Federal Reserve Beige Book |