Sample Category Title
Trade Idea : USD/JPY – Sell at 112.80
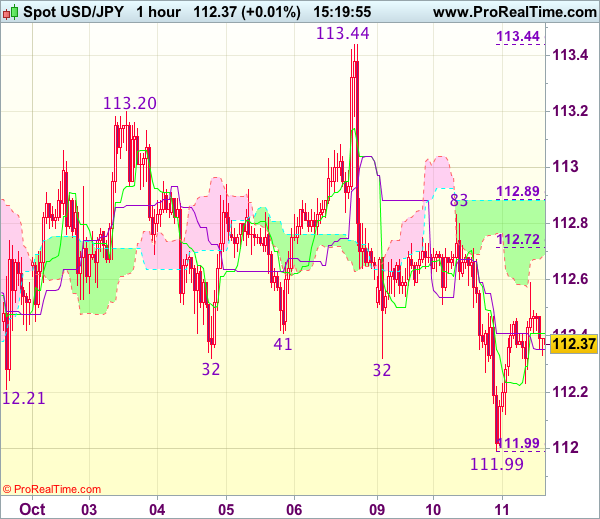
USD/JPY - 112.36
Most recent candlesticks pattern : N/A
Trend : Up
Tenkan-Sen level : 112.41
Kijun-Sen level : 112.35
Ichimoku cloud top : 112.88
Ichimoku cloud bottom : 112.69
Original strategy :
Sell at 112.65, Target: 111.65, Stop: 113.00
Position : -
Target : -
Stop : -
New strategy :
Sell at 112.80, Target: 111.80, Stop: 113.15
Position : -
Target : -
Stop : -
Although dollar rebounded after falling to 111.99 yesterday and initial upside risk is for recovery to 112.70-75 (50% Fibonacci retracement of 113.44-111.99), however, reckon 112.83-89 (yesterday’s high and 61.8% Fibonacci retracement) would limit upside and bring another decline later, below said support at 111.99 would add credence to our view that top has been formed at 113.44 and extend weakness to 111.75-80, then towards 111.47 support but oversold condition would limit downside and reckon 111.11 support would remain intact.
In view of this, we are looking to sell dollar on recovery as 112.83 resistance should limit upside and bring another decline. A break of indicated level at 112.83-89 would abort and signal low is formed, bring a stronger rebound to 113.10-20 but price should falter well below said last week’s high at 113.44.
XAUUSD Intraday Analysis
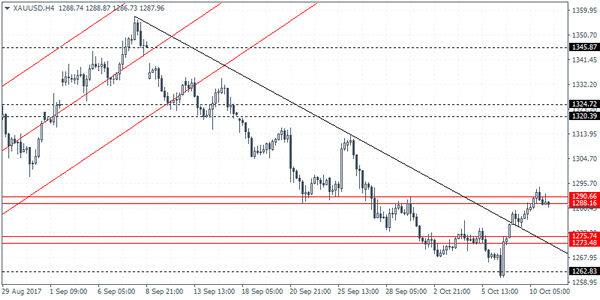
XAUUSD (1287.96): Gold prices maintained strong gains yesterday as price action broke past the falling trend line and is currently seen trading in the resistance level of 1290 - 1288. We can expect to see a near-term dip but declines could be limited to the support level of 1275 - 1273 area of support. As long as this support holds, the decline to this level could signal a retest of the trend line breakout. A successful rebound off this support level will keep the bias to the upside with gold prices likely to break past the resistance level and extend gains to the next main resistance level seen at 1320 - 1324 area.
USDJPY Intraday Analysis
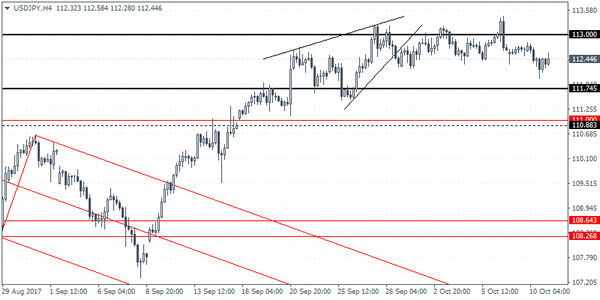
USDJPY (112.44): The USDJPY continues to consolidate near the major falling trend line around the 113.00 levels. Price action was seen briefly retreating from this resistance level yesterday and further downside could be expected. Support at 111.74 remains within reach to the downside. However, the sideways price action could be maintained in the near term. USDJPY will see further direction being established on a breakout above 113.00 or below 111.74.
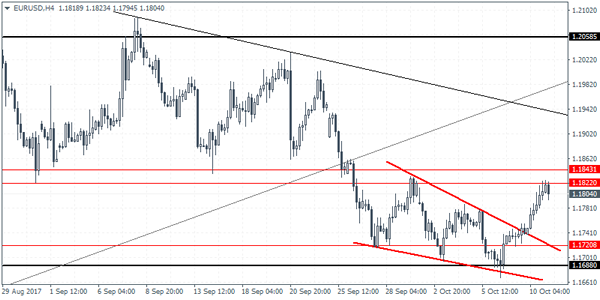
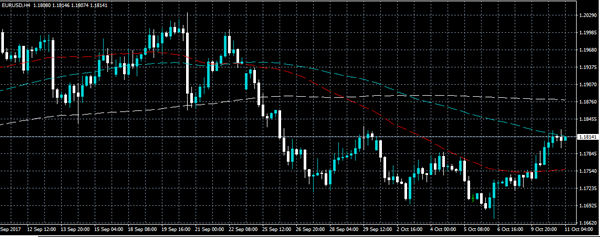
EURUSD Intraday Analysis
EURUSD (1.1804): The euro maintained the gains yesterday as price action was seen rising to the initial resistance level of 1.1822 by the day's close. Currently, EURUSD is seen declining off this resistance level, although further near-term upside could see price testing 1.1850. The rally to the resistance level marks the upside move and could see a near term pullback. A retest back to the breakout level from the descending wedge pattern is the main risk. However, a pullback could likely trigger a potential inverse head and shoulders pattern in the making. This would put EURUSD on a bullish track towards the minimum 1.1902 and potentially up to 22 September's unfilled gap near 1.1948. In the event of a decline below 1.1720, it would invalidate this still nascent inverse head and shoulders pattern.
Euro Maintains Gains As Catalonia Holds Back From Declaring Independence
The common currency was seen making gains yesterday. This came late in the evening as the Catalonia parliament saw the leader holding back from declaring independence.
However, CarlesPuigdemont said that the referendum held was successful but noted that the only way forward was through dialogue. The Spanish courts declared the Catalonian referendum as illegal. The speech that was given late yesterday in the Catalonian parliament was met with mixed reactions but was seen as a positive for the euro currency.
On the economic front, data from the UK showed that manufacturing production rose 0.4% on the month beating estimates of a 0.2% increase. Industrial production rose 0.2% as expected while construction output rose 0.6%.
Looking ahead, the FOMC meeting minutes will be coming out today. Investors will be expecting to see hawkish minutes being released with Fed officials likely to proceed with rate hikes in December.
Investors Exhale As Catalan Fears Ease
A strong sense of relief was felt across financial markets on Tuesday evening, after Catalan leaders signed a “symbolic” declaration of independence, but immediately suspended its formal approval and called for talks with Madrid.
Although President Carles Puigdemont's remarks disappointed many of his ardent supporters, who were hoping for a unilateral declaration of independence, his speech was music to investors'ears, as this softer approach eased tensions. However, there is still a possibility that Puigdemont's call for dialogue with Spain could rekindle investor anxiety, especially when considering how the Spanish government has made it clear on many occasions that it will not enter into talks with Catalonia's government. With Brussels backing Spain and insisting that the referendum was illegal, things could end badly for Puigdemont, if Madrid turns up the heat. The Spanish government will be holding an emergency cabinet meeting today, to discuss its official response to Puigdemont's declaration and as such, could spark Euro volatility.
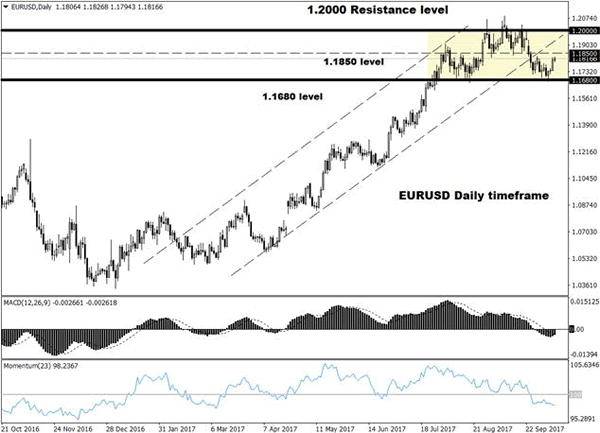
From a technical standpoint, the EURUSD rallied to a fresh weekly high above 1.1820 on Tuesday evening, after Catalonia stopped short of declaring independence. Prices still remain in a very wide range, with 1.1850 acting as a pivotal point on the daily charts. Price action suggests that the pair is waiting for a catalyst to venture higher or lower, and this could come in the form of the Spanish government's response to Catalonia's “symbolic” declaration. A breakout above 1.1850 may forge a path back towards 1.2000. In an alternative scenario, if 1.1850 acts as a tough resistance, then sellers may target 1.1680.
FOMC meeting minutes in focus
The Dollar depreciated against its peers on Tuesday, amid speculation that Donald Trump's tax overhaul plan could face headwinds down the road. This has been a rough week for the Greenback, as North Korean tensions and an absence of inspiration for Dollar bullish investors, exposed the currency to downside losses.
Wednesday's main risk event and potential market shaker will be the release of September's FOMC meeting minutes, which investors will closely comb through for clues on rate hike timings in the final quarter of 2017. With the Federal Reserve speakers repeatedly dishing out hawkish signals, the pending Fed minutes could be presented with a similar hawkish touch, potentially inspiring Dollar bulls. Markets will also pay close attention to discussions around inflation, and if voting members have looked beyond the recent weakness, to continue the gradual removal of monetary policy accommodation.
From a technical standpoint, the Dollar Index has found itself under pressure on the daily charts. A breakdown below 93.00 could hand over victory to sellers, with the next level of interest at 92.50. In an alternative scenario, bulls need to break back above 93.75 to jump back into the game.
Commodity spotlight – Gold
Gold quietly appreciated to its highest level in nearly two weeks on Tuesday, as a vulnerable Dollar, political risk in Spain and North Korean tensions, boosted investor attraction towards the metal.
While uncertainty and geopolitical risk are likely to stimulate appetite for Gold in the short term, gains remain capped by rising expectations of another U.S interest rate increase in December. Much attention will be directed towards September's FOMC minutes released later today, which will have the ability to punish Gold, if hawks are in the vicinity.
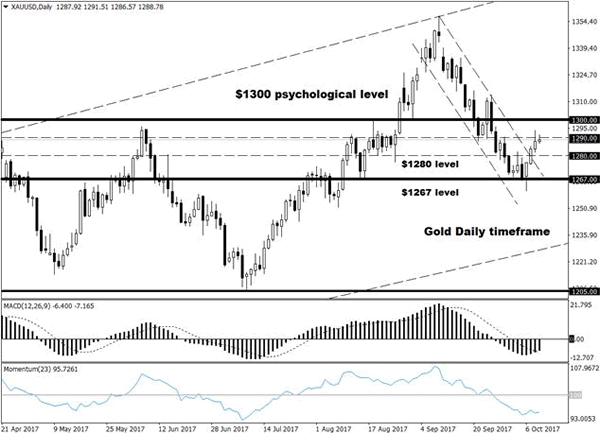
Taking a look at the technical picture, although the yellow metal is in the process of a technical bounce, sellers are still in firm control below the psychological $1300 level. A breakdown back below $1280, is likely to create a path back towards $1267. In an alternative scenario, a daily close above $1290 should encourage an appreciation to $1300.
Sterling Fails At 1.3225
The British pound continues to trade around the 1.3195 level against the U.S dollar, after earlier hitting 1.3225, with the greenback continuing to consolidate at two-week trading lows, amid concerns President Donald Trump’s tax plan could stall.
Intraday trading sentiment surrounding the GBPUSD is currently mixed, despite fundamental sentiment improving in the British pound, the pair was twice rejected from the key 1.3220 technical resistance area.
Going forward, a move below the 1.3190 support area should provoke intraday GBPUSD losses towards the 1.3166 region, whilst a higher time-frame price-close back above the 1.3220 level should cement further buying interest.
Traders are likely to remain cautious towards further positioning ahead of FOMC Meeting Minutes, which are due to be released during the upcoming U.S trading session.
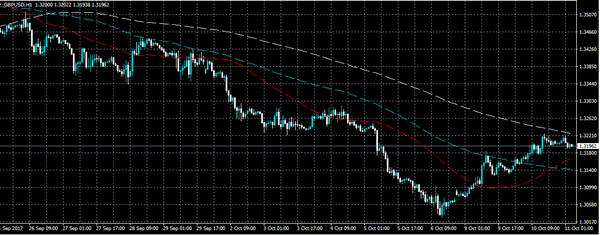
Key technical support for the GBPUSD pair below the 1.3190 level is found at the pairs weekly pivot point, at 1.3166 and the key 1.3150 level. Further support is seen at 1.3141 and the former swing-low at 1.3128.
To the upside, key technical resistance above the 1.3195 level is found at 1.3220 and the October 5th swing-high at 1.3249. Once above 1.3249, further resistance is found at 1.3290 and the pairs 100-week moving average, at 1.3323.
EURO Holding 1.1800 Level
The euro continues to firm above the 1.1800 handle against the U.S dollar, touching a high of 1.1828, after Catalonia’s leader stopped short of making a formal declaration of independence from Spain on Tuesday, instead of calling for talks with Madrid over the region’s future.
Today's trading sentiment the EURUSD pair is bullish, as imminent financial market risks have subsided, with the single currency staging a relief rally.
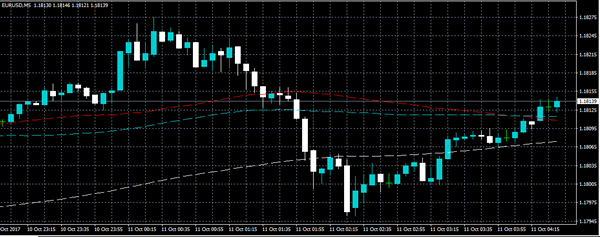
Going forward, the EURUSD pair should remain further bullish while holding price above the 1.1800 level. A near-term break-above the 1.1832 level will likely expose further buying towards interim resistance at 1.1858.
Later today the EURUSD faces a key risk event, with the release of FOMC Meeting Minutes. Any indication of an upcoming U.S rate hike inside the meeting minutes, is likely to be taken as U.S dollar supportive.
Key intraday resistance on the EURUSD pair is located at the September 29th price-high, at 1.1832, and the pairs 50-day moving average, at 1.1858. Once above 1.1858, further resistance is found at the pairs monthly pivot point, at 1.1875, and the key 1.1910 level.
Key technical support is found at the pairs daily pivot point, at 1.1800 and the recent swing price-low, at 1.1795. Once below 1.1795, further support is found at 1.1770, and the pairs weekly pivot point, at 1.1740.
FOMC Minutes To Set The Tone On Wednesday
Monetary policy will likely dictate the financial markets on Wednesday, as the Federal Reserve gets set to unveil the minutes of last month's policy meeting.
There's not a lot of action expected leading up to the Fed minutes. In Europe, Spain will release final September inflation data at 07:00 GMT. The harmonized index of consumer prices (HICP) is forecast to rise 1.9% annually in September.
Federal Reserve Bank of Chicago President Charles Evans is scheduled to deliver a speech at 11:15 GMT, about an hour before US markets officially open.
Investors will then turn their attention to the Federal Open Market Committee (FOMC) minutes, which are due for release at 18:00 GMT. The US central bank kept interest rates on hold last month, but chose October as the start of the “great unwind.” The Fed will begin reducing its balance sheet this month at a rate of $10 billion. At that rate, it'll take years just to see the balance sheet cut in half from the current level of around $4.5 trillion.
The FOMC has just two meetings left this year. Investors are pricing one more interest rate increase before the end of 2017.
Shortly after the FOMC minutes, European Central Bank (ECB) board member Peter Praet is set to deliver a speech.
Commodity traders will also be monitoring weekly crude inventory data courtesy of the American Petroleum Institute (API). The official inventory report from the US Energy Information Administration (EIA) will be released Thursday morning, which is one day later than its usual release schedule.
EUR/USD
The euro gained ground on Tuesday, returning above 1.18 US amid geopolitical crisis in Catalonia. The EUR/USD exchange rate nudged higher in overnight trade to reach 1.1830. All eyes will be on the ECB in the coming months as policymakers attempt to pour cold water on the euro rally. The ECB is expected to announce the fate of its quantitative easing program this month.

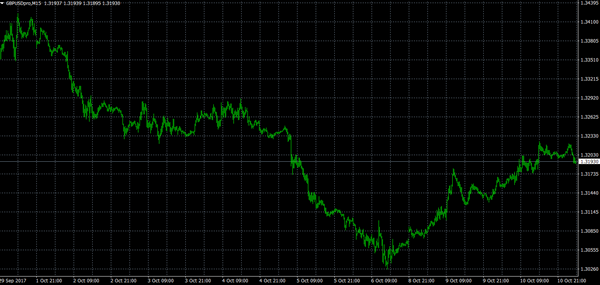
GBP/USD
The pound rose on Wednesday, and is on track for its third consecutive daily advance. Cable pushed through the 1.32 level as the dollar bulls lost control of the market. Sterling is consolidating gains north of 1.32, with prices eyeing the 20-day simple moving average at 1.3260. On the opposite side of the ledger, immediate support is likely found in the 1.3150 region.
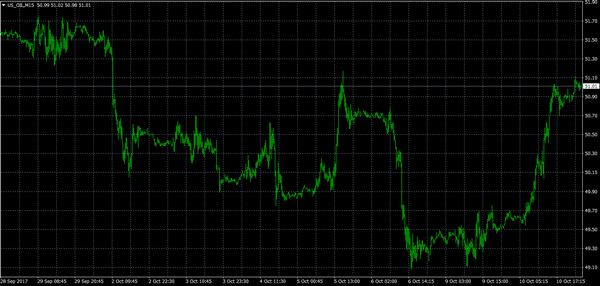
US OIL
Crude oil broke out on Tuesday, posting its biggest one-day gain in two weeks on signs that the global market is returning to balance. US crude prices extended their rally north of $51.00 a barrel on Wednesday before paring gains through the Asian session. Prices continue to hold the $51.00 level ahead of key inventory data.
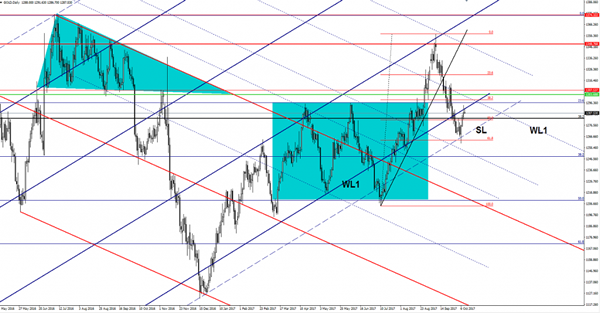
Gold Shows Exhaustion Signs
Gold made a false breakout above the first warning line (WL1) of the ascending pitchfork and now could drop again. Price failed to close right on the WL, signaling that the bears could take control again. It could come down to test and retest the long term 38.2% retracement level. I want to remind you that only a drop below the sliding parallel line (SL) will confirm a larger drop in the upcoming weeks.