
Sample Category Title
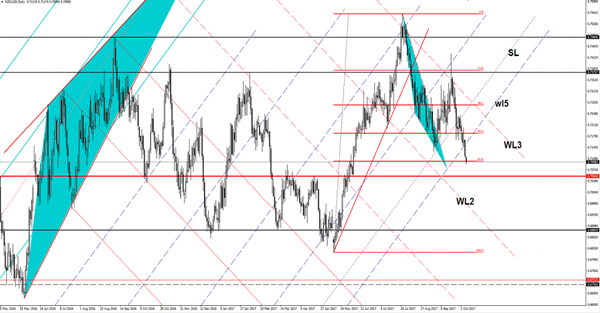
NZD/USD Breakdown Has Finally Come
Price is going down very fast and ignores all support levels. I’ve said in the previous reports that the NZD/USD should drop further and should take out the dynamic support from the wl5. Now is pressuring the 61.8% retracement level, could ignore this as well if the USDX will reach new highs. The pair is trapped between the WL3 and WL2, but is could develop a Falling Wedge pattern if will fail to reach the 0.7053 horizontal support.
Gold Bounce Or Break?
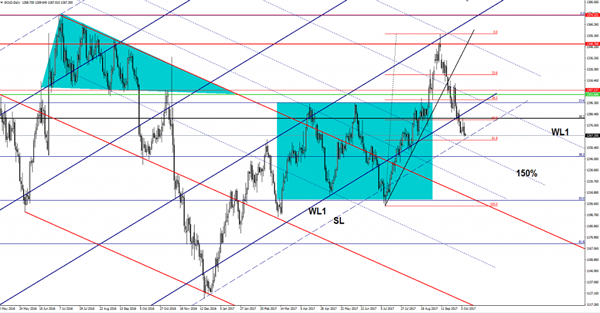
The yellow metal dropped significantly in the yesterday’s trading session and reached new lows. Price changed little today, but maintains a bearish bias on the short term. Gold is trading right above an important dynamic support, a valid breakdown will announce a further drop.
The price is into a corrective phase as the USDX has finally managed to rebound on the short term. Gold should drop further if the USDX’s breakout above the 93.81 will be validated. The greenback is expected to dominate the currency market in the upcoming period if the United States data will come in better today as well.
The economic calendar is filled with high impact data, the US Unemployment Rate is expected to remain steady at 4.4% for the second month in September, while the Average Hourly Earnings could increase by 0.3%, more versus the 0.1% in the former reading period. Moreover, the NFP will be released as well and is expected to be reported at 82K. You should keep an eye on the economic calendar to see what will move the price.
Gold dropped much below the $1270 per ounce and is almost to reach the sliding line (SL) of the ascending pitchfork, where he may find support again. Support can be found at the 61.8% retracement level. However, a breakdown below the mentioned support levels will confirm a reversal on the short term and a drop much below the $1250 per ounce.
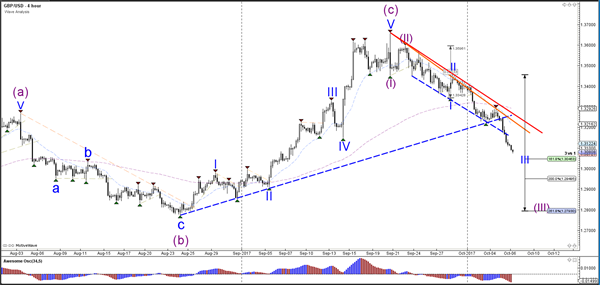
Daily Wave Analysis: GBP/USD Drops 150 Pips After Breaking Key Support Zone
Currency pair GBP/USD
The GBP/USD has broken below the important long-term support trend line (dotted blue), the 1.3250 round level, and the potential 50% Fibonacci level of wave 4 mentioned yesterday. This bearish breakout invalidates the bullish wave structure and changes the structure to bearish with currently a wave 3 (blue).
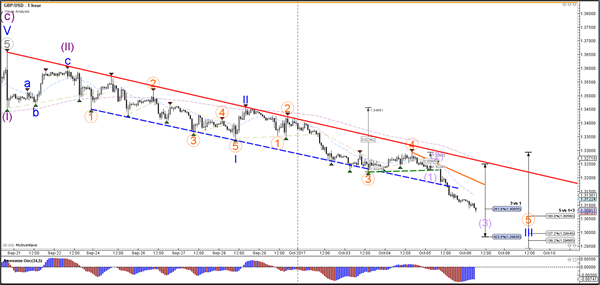
The GBP/USD break below the support trend lines (dotted lines) and is showing strong bearish momentum ever since the first breakout (dotted green).
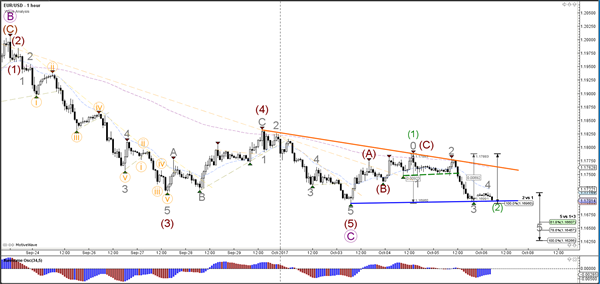
Currency pair EUR/USD
The EUR/USD will most likely soon break below the support trend line (blue) due to the strong bearish momentum. A bearish breakout below it and the 23.6% Fibonacci level of wave 4 (blue) could see price fall towards the 38.2% Fibonacci level near 1.15.
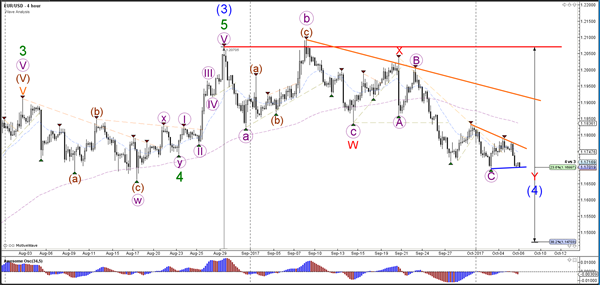
The EUR/USD will probably soon invalidate the bullish wave 1-2 (green), which also would mean that wave C (purple) has not yet been completed and is still open. A more likely wave scenario is indicating by the bearish 5 wave pattern (grey), which would be confirmed if price breaks below support.
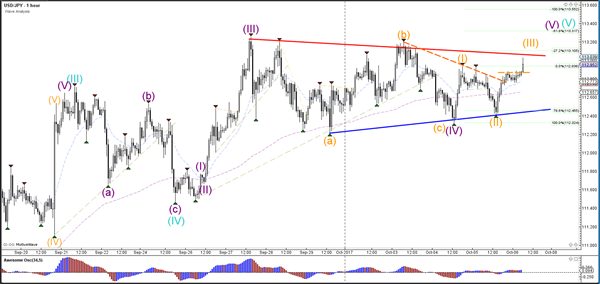
Currency pair USD/JPY
The USD/JPY is in a triangle pattern, which is indicated by the support (blue) and resistance (red) trend lines. The triangle pattern could indicate a pause with the uptrend and a bullish breakout above resistance (red) could take price up towards 114.50-115.
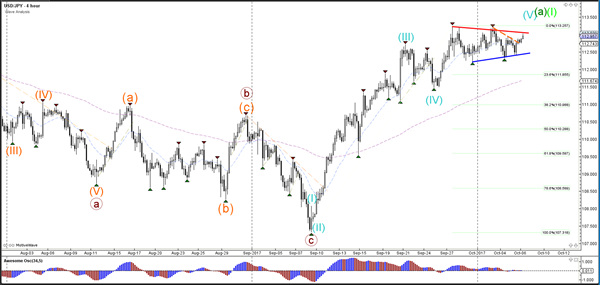
The USD/JPY broke above the resistance trend lines (dotted lines). The next bullish breakout could confirm a potential wave 3 (orange). In that case price has most likely expanded the wave 4 (purple) via a larger ABC (orange).
Market Update – Asian Session: RBA Official Does Not Rule Out rate cut following weaker retail sales
Asia Summary
Following the gains in the US equity markets, Asian indices are generally higher. Markets in Hong Kong have traded at an intraday 10-year high, while record highs have been seen for the equity markets in the Philippines. Equity markets in New Zealand trade at record high for 5 straight sessions. Markets in China and South Korea are still closed in observance of national holidays.
In Hong Kong, the banking sector has traded mostly higher. Shares of Standard Chartered have however underperformed, following reports that UK regulators are probing $1.4B in client fund transfers.
The gaming sector in Hong Kong has been weighed down amid the release of Macau tourism data for the Golden Week period.
Following yesterday’s retail sales induced declines, the Aussie has further weakened on today’s session. Earlier today, RBA official Harper did not rule out a rate cut amid the weaker retail sales data. The RBA last cut rates in Aug 2016.
Looking ahead, the US monthly payrolls report is in focus. Fed speakers are expected to include Bostic and Dudley. China’s Sept Caixin Services PMI may be released on Sunday Oct 8th, while Chinese markets will reopen next week
Key economic data
(HK) Hong Kong Sept Nikkei PMI: 51.2 v 49.7 prior
(JP) Japan Aug Labor Cash Earnings Y/Y: 0.9% v 0.5%e; Real Cash Earnings; 0.1% v 0.1%e
(JP) Japan Sept Official Reserve Assets: $1.27T v $1.27T prior
Speakers and Press
China
(CN) S&P: Amid the government’s deleveraging efforts, asset growth in the domestic banking sector has lagged growth of nominal GDP for the first time since 2012.
(CN) US Commerce Dept defers anti-dumping decision on imports of aluminum foil from China; to issue decision no later than Nov 30th
(HK) Macau Number of Mainland China Tourists from Oct 1-4 at 363.4K, -5.1% y/y
(HK) Hong Kong Securities and Futures Commission (SFC) plans to begin investor identification (ID) mechanism in early 2018 - HK Press
Other
(AU) Australia Senator Xenophon (independent) to quit and move to state politics
(AU) RBA Harper: Should a wider stalling of consumption occur, that could warrant rates response; NOT ruling out rate cut
(JP) Japan Fin Min Aso: Confirms to hold 2nd economic dialogue with US in Washington DC on Oct 16th**Note: On Sept 24th, it was reported that Aso was expected to skip the G20 and IMF meetings in Washington due to be held in Oct, as the US and Japan are expected to hold their 2nd economic dialogue on Oct 16th in Washington.
(JP) Tokyo Gov Koike (Party of Hope): Should freeze planned sales tax hike in 2019; To carry out 'Yurinomics' based on private-sector led economic revitalization, not relying excessively on monetary easing and fiscal spending.
(PH) BoJ signs $12.5B bilateral currency (FX) swap agreement with the Philippines, effective today
(TW) Taiwan said to consider raising electricity prices - Taiwanese Press
(SA) Saudi Arabia King: Remains keen on stability of global oil market
(SG) Singapore Central Bank (MAS): To issue semiannual monetary policy statement and Q3 GDP data on Oct 13th
IMF Lagarde: IMF supports accommodative policy for ECB and BoJ; more optimistic about global recovery
Asian Equity Indices/Futures (00:30ET)
Nikkei +0.3%, Hang Seng +0.4%, Shanghai Composite closed, ASX200 +0.9%, Kospi closed
Equity Futures: S&P500 flat ; Nasdaq flat, Dax +0.1% , FTSE100 +0.1%
FX ranges/Commodities/Fixed Income (00:30ET)
EUR 1.1686-1.1716; JPY 112.76-113.02; AUD 0.7743-0.7799; NZD 0.7091-0.7118
Aug Gold -0.2% at 1,270/oz; Aug Crude Oil -0.2% at $50.70/brl; Sept Copper -0.1% at $3.041/lb
GLD SPDR Gold Trust ETF daily holdings -0.4% to 851.1 metric tons
(AU) Australia sells A$700M in 2028 Bonds, avg yield 2.8410%, bid to cover 4.56x
US markets on close: Dow +0.5%, S&P500 +0.6%, Nasdaq +0.8%, Russell +0.3%
Best Sector in S&P500: Financials and Tech +1%
Worst Sector in S&P500: Utilities -0.1%
At the close: VIX 9.19 (-0.44pts); Treasuries: 2-yr 1.495% (+2bps), 10-yr 2.35% (+2.5bps), 30-yr 2.891% (+2.5bps)
US Market Summary
US equities continued to extend gains today. The S&P 500 closed at a record high, hitting its longest streak of all-time closing highs since 1997. The Stoxx 600 turned positive and the IBEX popped higher after a news report from Spain indicated that Catalan representatives could stall their efforts for independence due to leadership divisions. The Dollar Index approached $94 as Brexit concerns and Canadian trade data weighed on Cable and the Loonie, respectively. The VIX ended down 2%, below the 9.50 level. Tech and financials outperformed, while telecom was in the red.
US Afterhours Movers
SNCR Provides update on strategic alternatives process; enters exclusivity agreement with Siris; +26.0% afterhours
YUMC Reports Q3 $0.52 v $0.55e, Rev $2.04B v $2.00Be (2 est); sets new dividend of $0.10 (1% indicated yield), increases share buyback; +3.5% afterhours
COST Reports Q4 $2.08 v $2.02e, Rev $42.3B v $41.7Be; E-commerce surging; -1.8% afterhours
NLY Files to sell 65M shares of common stock via CS, Merrill, GS, WFC (6.0% of shares outstanding); -2.3% afterhours
Australia’s Construction Sector Growth Cooled In September
For the 24 hours to 23:00 GMT, the AUD declined 0.89% against the USD and closed at 0.7791.
LME Copper prices rose 0.9% or $58.0/MT to $6511.0/MT. Aluminium prices declined 0.7% or $15.5/MT to $2124.0/MT.
In the Asian session, at GMT0300, the pair is trading at 0.7761, with the AUD trading 0.39% lower against the USD from yesterday's close.
Overnight data indicated that Australia's AiG performance of construction index declined to a level of 54.7 in September, after recording a reading of 55.3 in the prior month.
The pair is expected to find support at 0.7735, and a fall through could take it to the next support level of 0.7708. The pair is expected to find its first resistance at 0.7813, and a rise through could take it to the next resistance level of 0.7864.
The currency pair is trading below its 20 Hr and 50 Hr moving averages.

Governing Council Discussed QE Tapering Options At September Meeting: ECB Minutes
For the 24 hours to 23:00 GMT, the EUR declined 0.42% against the USD and closed at 1.1711, after minutes of the European Central Bank (ECB) highlighted concerns over the rapid appreciation of the Euro.
Minutes of the ECB’s latest meeting showed discussion among members on various options to extending its asset buying, including the choice between the pace and the intended duration. Further, it showed that policymakers admitted the need of a substantial monetary policy for a little longer period of time to ensure that inflation’s returns to the central bank’s target and “broadly agreed” that October’s meeting would be the right time for “the bulk of the decisions”. Minutes also showed that officials fretted over Euro’s strength and its impact on the nascent economic recovery.
Other economic data showed that Germany’s Markit construction PMI dropped to a level of 53.4 in September, compared to a reading of 54.9 in the prior month.
The greenback gained ground against its major peers, after the latest string of economic reports painted a bright picture of the US economy.
Data revealed that initial jobless claims in the US eased more-than-expected to a level of 260.0K in the week ended 30 September, compared to a level of 272.0K in the previous week, while markets were anticipating for a fall to a level of 265.0K. Further, the nation’s trade deficit narrowed to an eleven-month low of $42.4 billion in August, as exports of goods and services rose to a nearly three-year high. The nation had posted a revised trade deficit of $43.6 billion in the previous month, while investors had expected the country’s trade deficit to narrow to $42.7 billion.
Another set of data revealed that the final durable goods orders in the US climbed more than initially estimated by 2.0% on a monthly basis in August, while the preliminary print had indicated a rise of 1.7%. Durable goods orders had registered a decline of 6.8% in the prior month. Moreover, the nation’s factory orders rebounded 1.2% on a monthly basis in August, more than market consensus for a rise of 1.0%. Factory orders had dropped 3.3% in the previous month.
In the Asian session, at GMT0300, the pair is trading at 1.1706, with the EUR trading marginally lower against the USD from yesterday’s close.
The pair is expected to find support at 1.1677, and a fall through could take it to the next support level of 1.1648. The pair is expected to find its first resistance at 1.1757, and a rise through could take it to the next resistance level of 1.1808.
The currency pair is trading below its 20 Hr and 50 Hr moving averages.

Pound Trading Lower In The Asian Session
For the 24 hours to 23:00 GMT, the GBP declined 0.95% against the USD and closed at 1.3116, amid mounting rumours that the British Prime Minister, Theresa May, could be ousted in the coming months.
In the Asian session, at GMT0300, the pair is trading at 1.3101, with the GBP trading 0.11% lower against the USD from yesterday’s close.
The pair is expected to find support at 1.3043, and a fall through could take it to the next support level of 1.2984. The pair is expected to find its first resistance at 1.3205, and a rise through could take it to the next resistance level of 1.3308.
Moving ahead, investors will look forward to UK’s Halifax house price index for September, slated to release in a few hours.
The currency pair is trading below its 20 Hr and 50 Hr moving averages.

Japanese Yen Trading A Tad Lower In The Asian Session
For the 24 hours to 23:00 GMT, the USD slightly rose against the JPY and closed at 112.82.
In the Asian session, at GMT0300, the pair is trading at 112.85, with the USD trading marginally higher against the JPY from yesterday’s close.
On the data front, Japan’s labour cash earnings rebounded 0.9% on an annual basis in August, compared to a fall of 0.3% in the prior month. Markets had anticipated for a gain of 0.5%.
The pair is expected to find support at 112.54, and a fall through could take it to the next support level of 112.24. The pair is expected to find its first resistance at 113.02, and a rise through could take it to the next resistance level of 113.20.
The currency pair is trading above its 20 Hr and 50 Hr moving averages.

Switzerland’s Consumer Price Inflation Advanced As Expected In September
For the 24 hours to 23:00 GMT, the USD rose 0.33% against the CHF and closed at 0.9784.
In economic news, Switzerland's consumer price index (CPI) registered a rise of 0.2% on MoM in September, at par with market expectations. The CPI had registered a flat reading in the previous month.
In the Asian session, at GMT0300, the pair is trading at 0.9791, with the USD trading 0.07% higher against the CHF from yesterday's close.
The pair is expected to find support at 0.9757, and a fall through could take it to the next support level of 0.9724. The pair is expected to find its first resistance at 0.9810, and a rise through could take it to the next resistance level of 0.9830.
Amid a lack of macroeconomic releases in Switzerland today, investors will focus on Switzerland's unemployment rate for September, the sole important release next week.
The currency pair is trading above its 20 Hr and 50 Hr moving averages.

Loonie Trading Slightly Higher, Ahead Of Canada’s Unemployment Rate Data
For the 24 hours to 23:00 GMT, the USD rose 0.74% against the CAD and closed at 1.2569.
On the macro front, Canada's international merchandise trade deficit surprisingly widened to C$3.41 billion in August, defying investor consensus for the nation's trade deficit to narrow to C$2.60 billion and following a revised deficit of C$2.98 billion in the prior month.
In the Asian session, at GMT0300, the pair is trading at 1.2574, with the USD trading a tad higher against the CAD from yesterday's close.
The pair is expected to find support at 1.2496, and a fall through could take it to the next support level of 1.2417. The pair is expected to find its first resistance at 1.2619, and a rise through could take it to the next resistance level of 1.2663.
Trading trend in the pair today is expected to be determined by the release of Canada's crucial unemployment rate data for September, due to release later in the day.
The currency pair is trading above its 20 Hr and 50 Hr moving averages.
