Sample Category Title
NZDUSD Forecasting the Path and Buying Short Term Dips
NZDUSD Elliott Wave 1 Hour Chart 09.14.2017
Back then we were pointing out that NZDUSD has ended cycle from the 07/27 peak at 0.7128 low. Consequently we're expecting larger bounce to happen. NZDUSD is currently short term pull back agianst the 0.7128 low in wave ((x)) black.Proposed pull back is showing incomplete structure, suggesting another marginal push lower toward 0.7193-0.71628 area, where buyers will be waiting for further rally ideally.
Although we expected the rally, we didn't force trades at that stage because the price structure didn't have incomplete bullish sequences that will justify the risk.
NZDUSD Elliott Wave 1 Hour Chart 09.18.2017
Shortlly after, the price has reached proposed technical area at 0.7193-0.71628 . NZDUSD has found buyers there and we got the nice rally. A few days after, the price has broken above 09/08 peak, making incomplete bullish sequences in the cycle from the 0.71283 low. As we can see at the chart below, we have now 5 swings to the upside, when currently doing 6th swing. As far as pivot at 0.7181 low remians intact we expect the pair to find the buyers for further rally in 7th swing. Due to incomplete bullish sequences, we recommended members to buy the intraday dips in 3,7,11 swings against the 0.71815 low. Until pull back gives us clear 3 wave structure, we have 50-61.8 fibonacci retracement area as a potential buying zone : 0.7262-0.7243.
NZDUSD Elliott Wave 1 Hour Chart 09.19.2017
We got proposed pull back (x) and it has reached 50 fibonacci level as expected. It has unfolded as a clear 3 wave abc pattern, when buying area was at 0.7260-0.7247. It's already giving us reaction from there. We would like to see more separation from the current short term low, to get confimration that (x) blue has ended. We expect the pair to trade higher and like staying long, targeting 0.73921-0.74417 area.
NZDUSD Elliott Wave 1 Hour Chart 09.20.2017
The pair is trading higher as expected, and members are enjoying profits in risk free trades. Next important technical area to the upside comes at 0.73921-0.74417 and it's expected to be reached before cycle from the 0.7128 low completes as 7 swings structure. Mentioned area should find sellers , and we expect to see larger pull back from those levels.
We advised members to take profits there.
GBP/USD Progressive Bearish Channel Formed
The GBP/USD has rejected perfectly from 1.3440 as seen in my Session Recap webinar analysis of the German election impact and made a U-turn continuing with a bearish progressive channel zigzag. 1.3435-55 is the first POC zone (D L1,W L3 order block 38.2) and 1.3470-85 is the POC2 (D H3, EMA89, 50.0). Both zones could reject the price towards 1.3400 and 1.3379. Break of daily low at 1.3363 could move the price to 1.3353 and below we might expect a breakout towards the 1.3318-00 zone.
W L3 - Weekly Camarilla Pivot (Weekly Interim Support)
W H3 - Weekly Camarilla Pivot (Weekly Interim Resistance)
W H4 - Weekly Camarilla Pivot (Strong Weekly Resistance)
D H4 - Daily Camarilla Pivot (Very Strong Daily Resistance)
D L3 - Daily Camarilla Pivot (Daily Support)
D L4 - Daily H4 Camarilla (Very Strong Daily Support)
POC - Point Of Confluence (The zone where we expect price to react aka entry zone)
Spot Gold Stands at the Back Foot
Spot Gold stands at the back foot on Wednesday and hit new one-month low at $1285 in extension of Tuesday's strong fall (the biggest one-day loss since July 3), which generated negative signal on formation of Bearish Engulfing pattern.
Today's weakness cracked rising 55SMA support at $1287 and eyes next targets at $1281 (50% retracement of $1204/$1357 ascend) and more significant daily cloud top at $1276.
Bearish techs show further room at the downside for extension of bear-leg from $1357 (08 Sep peak).
Session high at $1296 and psychological $1300 barrier marks initial resistances, with extended upticks expected stay capped under falling 10SMA at $1304.
Res: 1296; 1300; 1304; 1310
Sup: 1285; 1281; 1276; 1270
Gold: Reverses Gain, Targets Further Weakness
Gold: The commodity closed lower after reversing its Monday gains on Tuesday. This saw it following through lower during early trading on Wednesday. On the downside, support comes in at the 1,280.00 level where a break will turn attention to the 1,270.00 level. Further down, a cut through here will open the door for a move lower towards the 1,260.00 level. Below here if seen could trigger further downside pressure targeting the 1,250.00 level. Conversely, resistance resides at the 1,300.00 level where a break will aim at the 1,310.00 level. A turn above there will expose the 1,320.00 level. Further out, resistance stands at the 1,330.00 level. All in all, GOLD looks to weaken further on bear pressure.
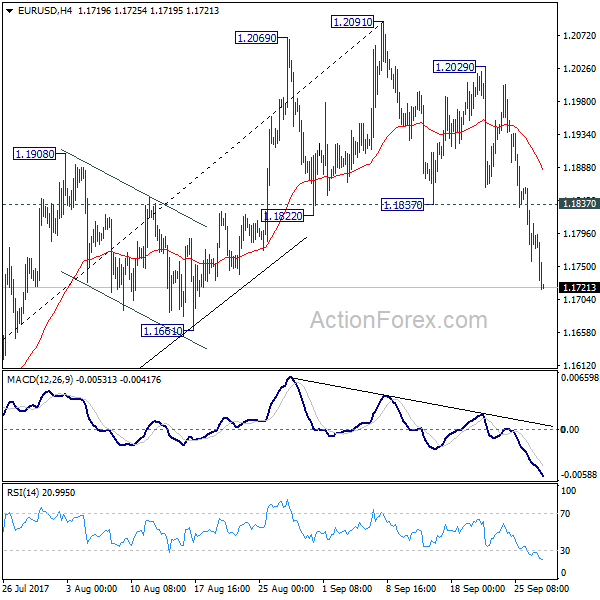
EUR/USD Mid-Day Outlook
Daily Pivots: (S1) 1.1745; (P) 1.1803 (R1) 1.1850; More...
Intraday bias in EUR/USD remains on the downside as correction from 1.2091 extends. Deeper decline should be seen as 1.1661 first. Such decline is correcting whole rise from 1.0569. Break of 1.1661 will target 38.2% retracement of 1.0569 to 1.2091 at 1.1510, where we're expecting support to bring rebound. On the upside, above 1.1837 minor resistance will turn intraday bias neutral first. But break of 1.2029 resistance is needed to confirm completion of the pull back. Otherwise, deeper fall will remain in favor as the correction develops.
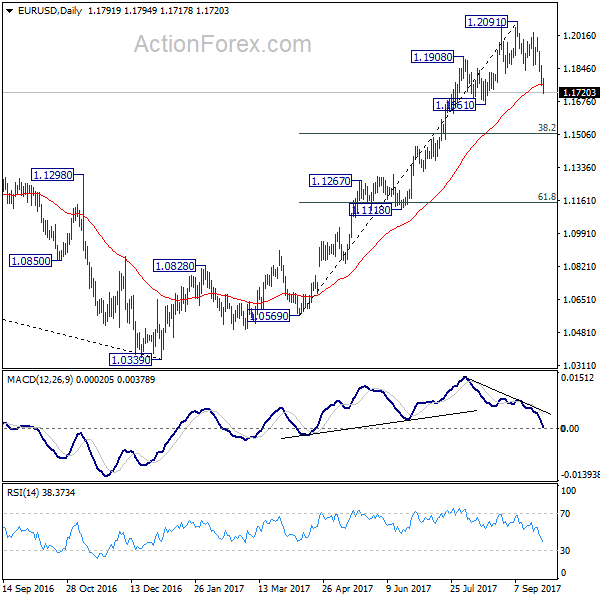
In the bigger picture, rise from medium term bottom at 1.0339 is still in progress for 38.2% retracement of 1.6039 (2008 high) to 1.0339 (2017 low) at 1.2516. However, it should be noted that there is no confirmation of trend reversal yet. That is, such rebound from 1.0399 could be a correction. And the long term fall from 1.6039 (2008 high) could resume. Hence, we'd be cautious on strong resistance from 1.2516 to limit upside. But after all, break of 1.1661 is needed to indicate medium term topping. Otherwise, outlook will remain bullish in case of pull back.
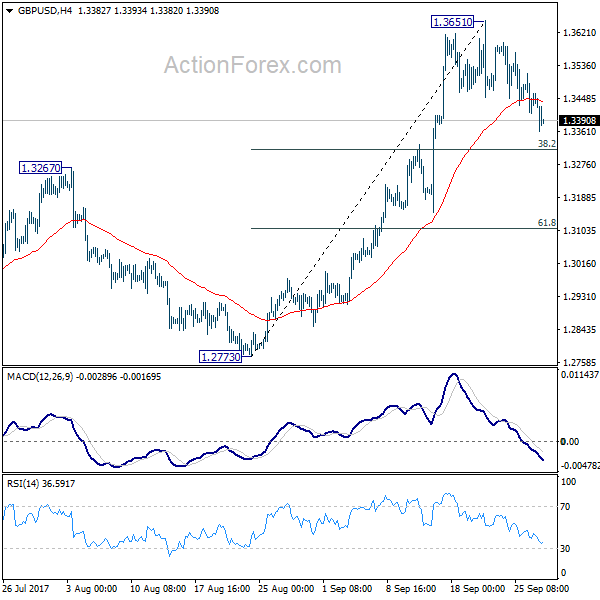
GBP/USD Mid-Day Outlook
Daily Pivots: (S1) 1.3406; (P) 1.3460; (R1) 1.3511; More....
GBP/USD dips lower today as pull back from 1.3651 extends. But there is no change in the bullish outlook. We'd continue to expect strong support from 38.2% retracement of 1.2773 to 1.3651 at 1.3316 to contain downside and bring rally resumption. Break of 1.3651 will turn bias back to the upside for 1.3835 support turned resistance next. Break there will target 55 month EMA (now at 1.4405).
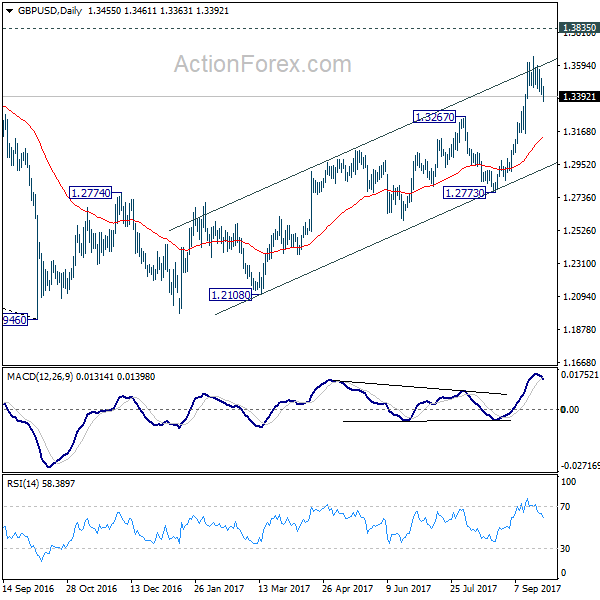
In the bigger picture, current development argues that the long term trend in GBP/USD has reversed. That is, a key bottom was formed back in 1.1946 on bullish convergence condition in monthly MACD. Current rise from 1.1946 will target 38.2% retracement of 2.1161 (2007 high) to 1.1946 (2016 low) at 1.5466 next. In any case, medium term outlook will now stay bullish as long as 1.2773 support holds.
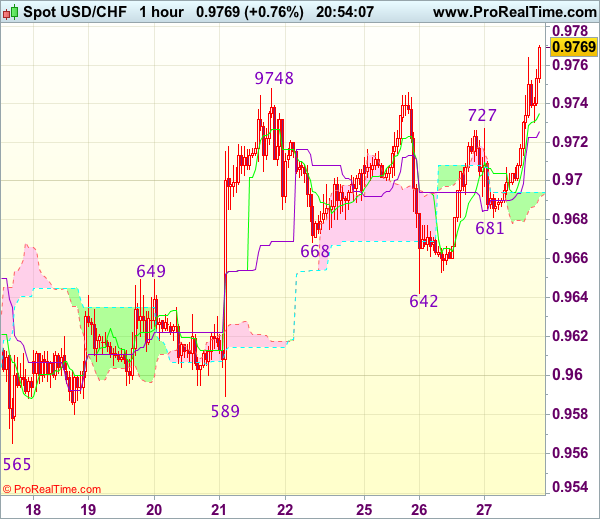
Trade Idea Update: USD/CHF – Hold long entered at 0.9685
USD/CHF - 0.9754
Original strategy :
Bought at 0.9685, Target: 0.9785, Stop: 0.9695
Position : - Long at 0.9685
Target : - 0.9785
Stop : - 0.9695
New strategy :
Hold long entered at 0.9685, Target: 0.9785, Stop: 0.9710
Position : - Long at 0.9685
Target : - 0.9785
Stop : - 0.9710
As the greenback did find renewed buying interest at 0.9681 (we recommended to buy at 0.9685 and a long position was entered) and has rallied in line with our bullish expectation, retaining our upside bias for recent upmove from 0.9421 low to to extend gain to 0.9773 resistance, however, break of this level is needed to bring further rise towards 0.9800-10 which is likely to hold from here due to near term overbought condition.
In view of this, we are holding on to our long position entered at 0.9685. Only below said support at 0.9681 would abort and signal top is formed instead, bring correction of recent rise towards support at 0.9642 which is likely to hold on first testing.
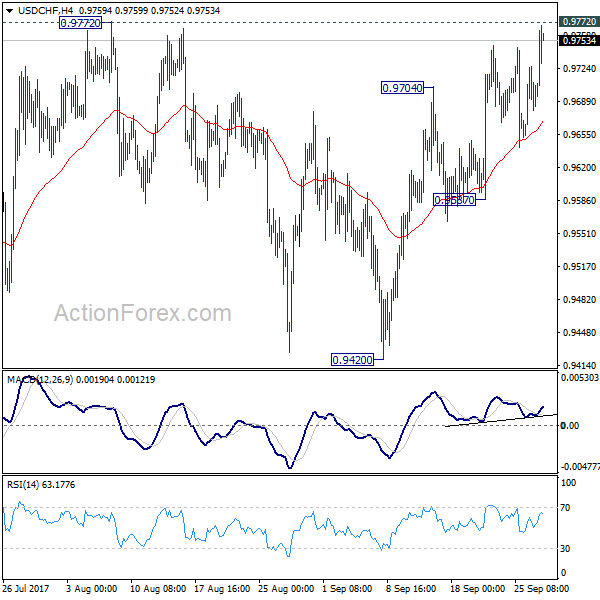
USD/CHF Mid-Day Outlook
Daily Pivots: (S1) 0.9649; (P) 0.9688; (R1) 0.9723; More....
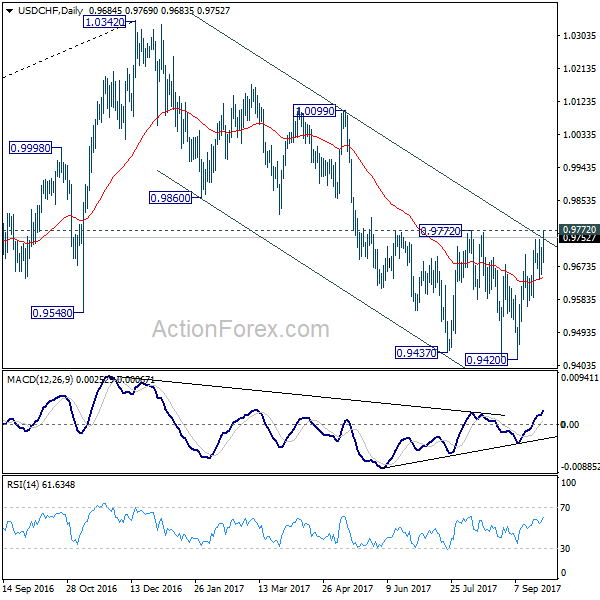
Focus on USD/CHF is now back on 0.9772 key resistance. Decisive break there will suggest that whole down trend form 1.0342 has completed. In that case, near term outlook will be turned bullish for 0.9860/1.0099 resistance zone. Nonetheless, with 0.9772 resistance intact, outlook remains bearish. Below 0.9587 minor support will turn bias back to the downside for retesting 0.9420 low.
In the bigger picture, focus remains on whether 0.9443 key support (2016 low) could be taken out firmly as down trend from 1.0342 extends. There are various interpretation of the price actions. But in any case, medium term outlook will stay bearish as long as 0.9772 resistance holds. Current down trend could extend to 38.2% retracement of 0.7065 (2011 low) to 1.0342 (2016 high) at 0.9090. However, break of 0.9772 will indicate that USD/CHF has successfully defended 0.9443 again and turn outlook bullish for 1.0099 resistance.
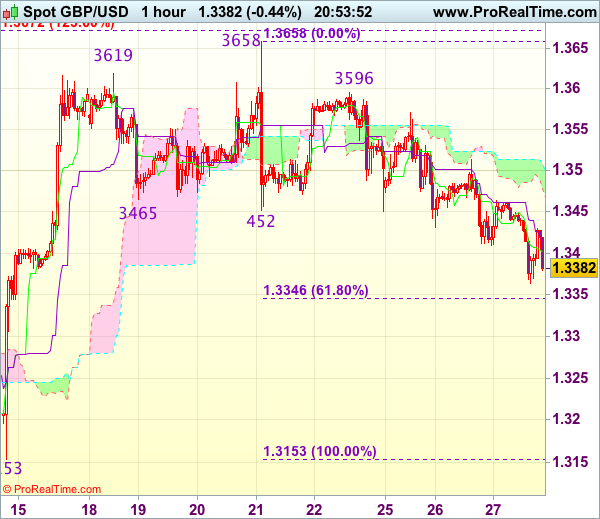
Trade Idea Update: GBP/USD – Sell at 1.3500
GBP/USD - 1.3400
Original strategy :
Sell at 1.3500, Target: 1.3380, Stop: 1.3535
Position : -
Target : -
Stop : -
New strategy :
Sell at 1.3500, Target: 1.3380, Stop: 1.3535
Position : -
Target : -
Stop : -
As cable has rebounded after falling to 1.3364 earlier today, suggesting minor consolidation above this level would be seen and corrective bounce to 1.3455-60 cannot be ruled out, however, reckon upside would be limited to 1.3500 and bring another decline later, below said support at 1.3364 would extend recent decline from 1.3658 top to 1.3345-50 (61.8% Fibonacci retracement of 1.3153-1.3658) and possibly towards previous resistance at 1.3329.
In view of this, would not chase this fall here and would be prudent to sell cable on further recovery as 1.3500 should hold. Above resistance at 1.3514 would defer and risk a stronger rebound to 1.3535-40 but resistance at 1.3571 should remain intact.
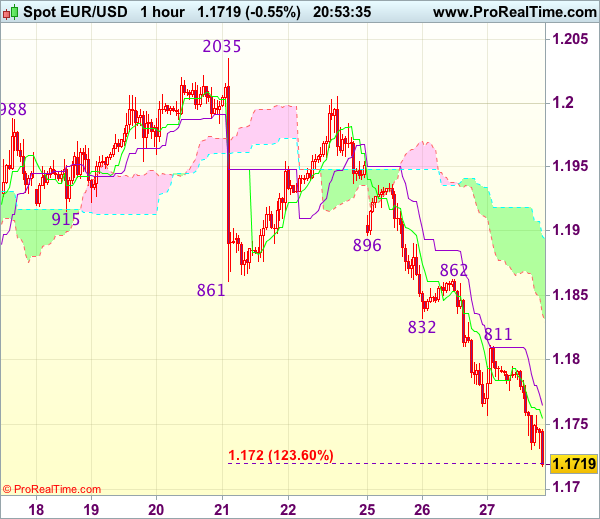
Trade Idea Update: EUR/USD – Sell at 1.1810
EUR/USD - 1.1725
Original strategy :
Sell at 1.1830, Target: 1.1720, Stop: 1.1865
Position : -
Target : -
Stop : -
New strategy :
Sell at 1.1830, Target: 1.1720, Stop: 1.1865
Position : -
Target : -
Stop : -
As the single currency has fallen again after brief recovery to 1.1811, adding credence to our bearish view that the decline from .2093 top is still in progress and downside bias remains for further weakness to 1.1720 (1.236 times projection of 1.2093-1.1838 measuring from 1.2035), then 1.1700, however, loss of downward momentum should prevent sharp fall below previous support at 1.1662 and bring rebound later.
In view of this, we are looking to sell euro on recovery, above the Kijun-Sen (now at 1.1765) would bring recovery to said resistance at 1.1811, however, previous support at 1.1832-38 (now resistance) should hold and bring another decline later. Above resistance at 1.1862 would abort and signal low is formed instead, bring a stronger rebound to 1.1896 (another previous support).