Sample Category Title
SILVER Consolidation
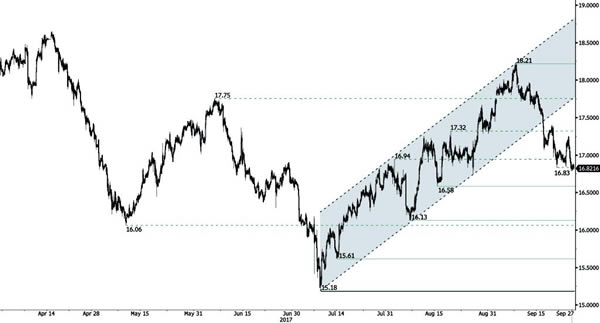
Silver has reversed and has broken uptrend channel by breaking support implied by its lower bound. Strong resistance is given at 18.65 (17/04/2017 high) while support can be found at 16.58 (15/08/2017 high). Expected to show further bearish move.
In the long-term, the trend is rater negative. Further downsides are very likely. Resistance is located at 25.11 (28/08/2013 high). Strong support can be found at 11.75 (20/04/2009).
GOLD Long-Term Bearish Consolidation
.
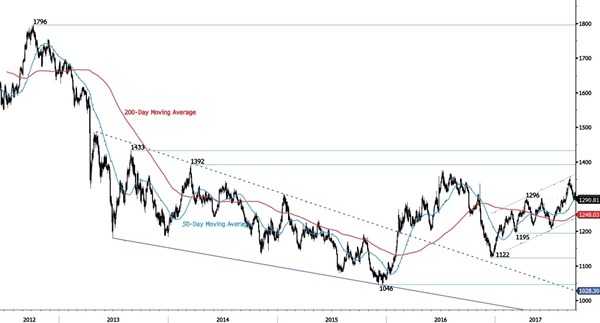
Gold has weakened again below 1300. Hourly support is now given at 1276 (25/08/2017 low). Hourly resistance is located at 1357 (08/09/2016). Stronger support lies at 1204 (10/07/2017 high). Expected to show further bearish move.
In the long-term, the technical structure suggests that there is a growing upside momentum. A break of 1392 (17/03/2014) is necessary ton confirm it, A major support can be found at 1045 (05/02/2010 low).
BITCOIN Holding Slightly Below 4000
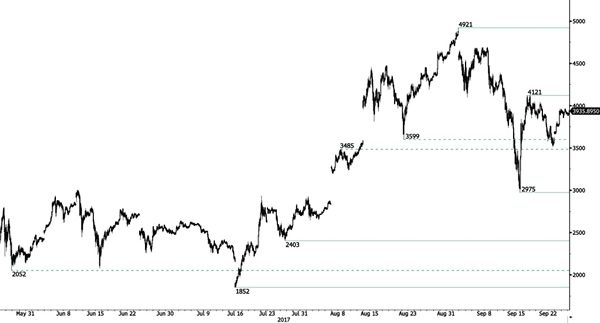
Bitcoin has taken a dive after strong interest over the summer. The digital currency has set up a new support at 2975 (22/08/2017 low). Hourly resistance is given at 4121 (18/09/2017 low). Key resistance can be located at 4921 (01/09/2017 high). The road is wide open for further shortterm decline.
In the long-term, the digital currency has had an exponential growth. There are decent likelihood that the asset will reach $10'000.
EUR/CHF Ready To Bounce Back
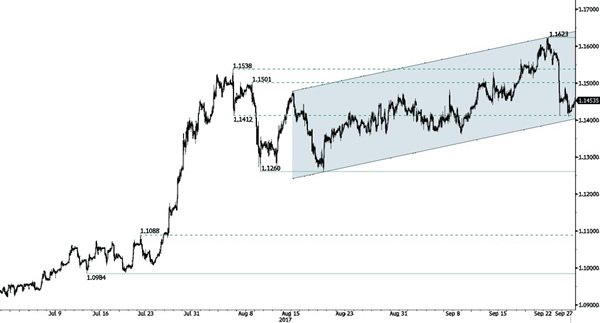
EUR/CHF's buying pressures are going up and the pair has broken resistance area between 1.1356 and 1.1472. The pair has also broken resistance at 1.1538 (04/08/2017 high). Expected to show continued bullish pressures.
In the longer term, the technical structure has reversed. Strong resistance is given at 1.20 (level before the unpeg). Yet, the ECB's QE programme is likely to cause persistent selling pressures on the euro, which should weigh on EUR/CHF. Supports can be found at 1.0184 (28/01/2015 low) and 1.0082 (27/01/2015 low).
EUR/GBP Monitoring Strong Support
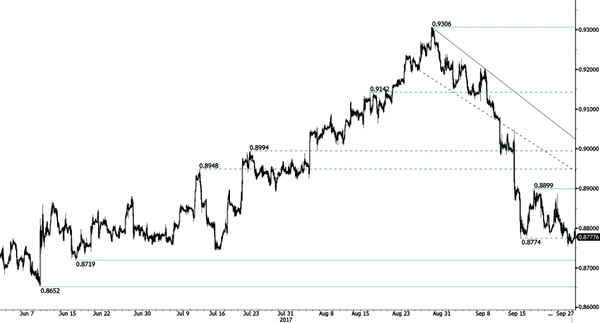
EUR/GBP is trading lower. The pair is having strong selling pressures. As long as prices remain below the resistance at 0.9176 (declining trendline), the short-term technical structure is biased to the downside. Hourly support is given at 0.8719 (16/06/2017). Strong resistance lies at 0.9306 (29/07/2017 high).
In the long-term, the pair has largely recovered from recent lows in 2015. The technical structure suggests a growing upside momentum. The pair is trading above from its 200 DMA. Strong resistance can be found at 0.9500 (psychological level).
AUD/USD Weakening
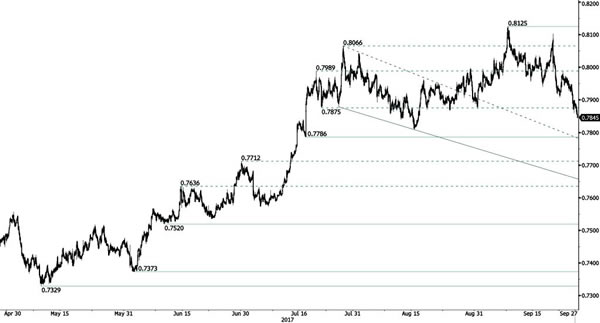
AUD/USD is weakening in the short-term. Hourly resistance is given at 0.8164 (14/05/2017 high). Hourly support given at 0.7908 (22/09/2017 low) has been broken. Expected to show continued weakness.
In the long-term, the trend is turning positive. Key supports stands at 0.6009 (31/10/2008 low) . A break of the key resistance at 0.8164 (14/05/2015 high) is needed to invalidate our long-term bearish view.
USD/CAD Short-Term Bullish Pressures Continue
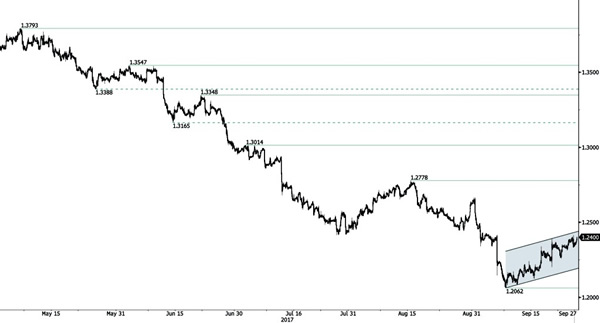
USD/CAD continues to move higher. Hourly support is located at 1.2062 (08/09/2017 low). Resistance is given at a distance at 1.2390 (20/09/2017 high). Expected to show continued short-term bullish pressures.
In the longer term, the pair has broken longterm support that can be found at 1.2461 (16/03/2015 low). Strong resistance is given at 1.4690 (22/01/2016 high). The pair is likely to head further lower.
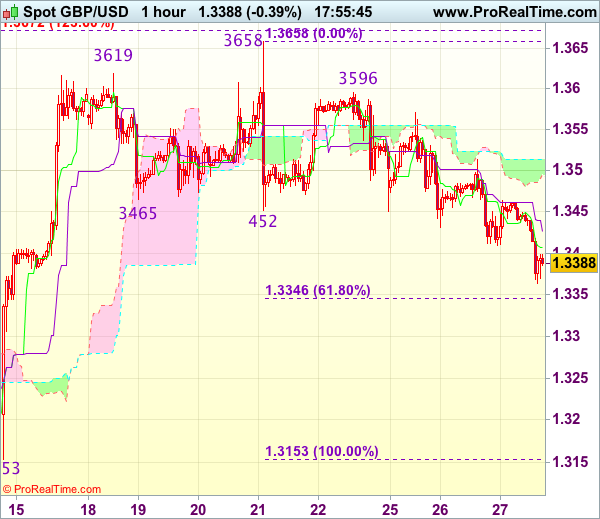
Trade Idea : GBP/USD – Sell at 1.3500
GBP/USD - 1.3422
Most recent candlesticks pattern : N/A
Trend : Up
Tenkan-Sen level : 1.3406
Kijun-Sen level : 1.3426
Ichimoku cloud top : 1.3514
Ichimoku cloud bottom : 1.3493
New strategy :
Sell at 1.3500, Target: 1.3380, Stop: 1.3535
Position : -
Target : -
Stop : -
As cable has rebounded after falling to 1.3364 earlier today, suggesting minor consolidation above this level would be seen and corrective bounce to 1.3455-60 cannot be ruled out, however, reckon upside would be limited to 1.3500 and bring another decline later, below said support at 1.3364 would extend recent decline from 1.3658 top to 1.3345-50 (61.8% Fibonacci retracement of 1.3153-1.3658) and possibly towards previous resistance at 1.3329.
In view of this, would not chase this fall here and would be prudent to sell cable on further recovery as 1.3500 should hold. Above resistance at 1.3514 would defer and risk a stronger rebound to 1.3535-40 but resistance at 1.3571 should remain intact.
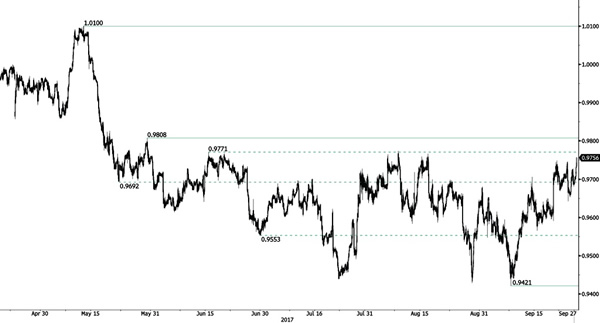
USD/CHF Edging Higher
USD/CHF is trading mixed. Strong resistance is given at 0.9808 (30/05/2017 high). The technical structure shows that there are decent downside risks. Strong support is given at 0.9421 (03/05/2017). Expected to show renewed bearish pressures.
In the long-term, the pair is still trading in range since 2011 despite some turmoil when the SNB unpegged the CHF. Key support can be found 0.8986 (30/01/2015 low). The technical structure favours nonetheless a long term bullish bias since the unpeg in January 2015.
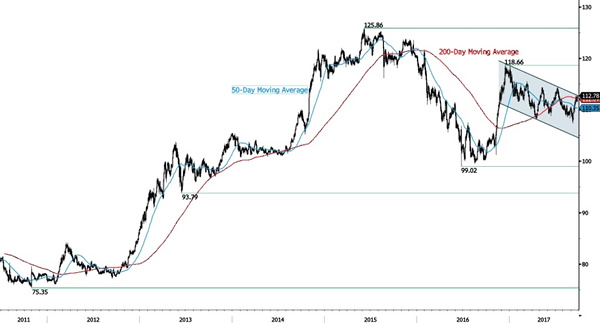
USD/JPY Strong Short-Term Bullish Move
USD/JPY is monitoring the 113.00 level. Strong support is located at 111.12 (20/09/2017 low). Expected to show further bearish pressures. Yet, downside risks are rising as markets may soon take some short-term profit.
We favor a long-term bearish bias. Support is now given at 99.02 (10/08/2013 low). A gradual rise towards the major resistance at 125.86 (05/06/2015 high) seems unlikely. Expected to decline further support at 93.79 (13/06/2013 low).