Sample Category Title
Technical Outlook: EURUSD Remains Bid But Struggles Under 1.2000/20 Pivots
The Euro stands higher on Wednesday and remains underpinned by 10SMA which contained pullback from 1.2092 but struggles under psychological 1.2000 barrier.
The price penetrated in descending thick hourly cloud (spanned between 1.1976 and 1.2020) with break above the cloud needed to signal stronger upside. Acceleration above 1.2028 (Friday’s high / Fibo 61.8% of 1.2092/1.1925 pullback) would confirm reversal and higher low at 1.1925.
Overall picture remains bullish but mixed signals from studies on lower timeframes suggest that the pair may stay in extended consolidation while 1.2000/20 pivots cap.
Initial range lies between 1.1960 and 1.2000.
Res: 1.2000, 1.2020, 1.2070, 1.2092
Sup: 1.1976, 1.1960, 1.1925, 1.1877
Forex Technical Analysis: EUR/USD, USD/JPY, GBP/USD
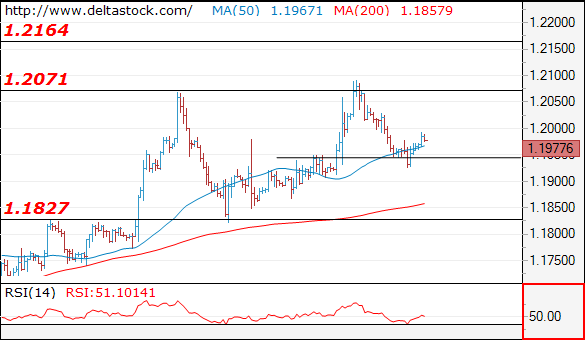
EUR/USD
Current level - 1.1977
The rebound above 1.1924 is quite pale and there is still a risk of another downswing, towards 1.1830 major support area.
| Resistance | Support | ||
| intraday | intraweek | intraday | intraweek |
|
1.2000 |
1.2160 |
1.1950 |
1.1830 |
|
1.2090 |
1.2500 |
1.1830 |
1.1660 |
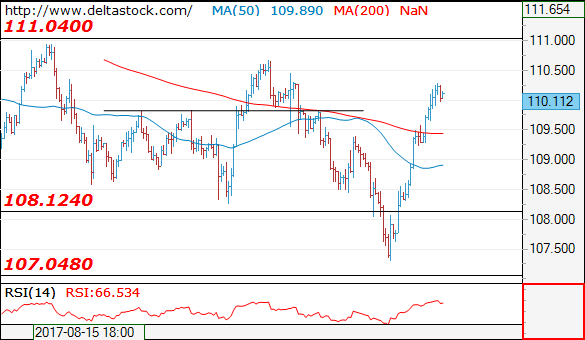
USD/JPY
Current level - 110.12
The upmove is still underway, for a test of 110.60 high. Initial intraday support lies at 109.60.
| Resistance | Support | ||
| intraday | intraweek | intraday | intraweek |
|
110.60 |
110.60 |
109.60 |
107.30 |
|
111.00 |
112.20 |
108.50 |
105.50 |
GBP/USD
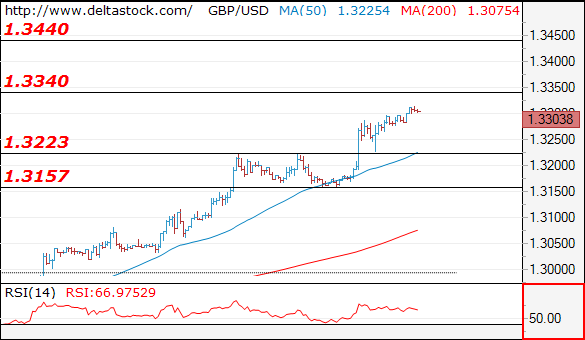
Current level - 1.3303
The uptrend is intact after the violation of 1.3260 peak and next hurdle lies at 1.3340, followed by 1.3440 area. Key support is projected at 1.3220.
| Resistance | Support | ||
| intraday | intraweek | intraday | intraweek |
|
1.3340 |
1.3340 |
1.3220 |
1.2990 |
|
1.3440 |
1.3500 |
1.3157 |
1.2770 |
EURUSD Analysis: Tries To Bypass 1.20 Level
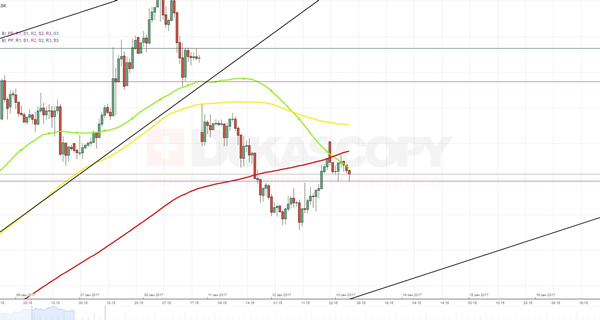
In line with expectations, a resistance created by the 55- and 100-hour SMAs prevented the further advance of the Euro against the Greenback. At the moment, this barrier is also strengthened by the weekly PP. For this reason, the pair is expected to fail to break to the top. However, a sharp decline should not happen as well, as the southern side remains reliably protected by the 200-hour SMA, which is moving along the lower support line of a long-term ascending channel. In other words, the rate is expected to stay for some time in this ascending triangle. On the other hand, an effect from release of data on the US PMI at 12:30 GMT might give a necessary impulse to bypass the above resistance a stay for some above the 1.9999 mark.
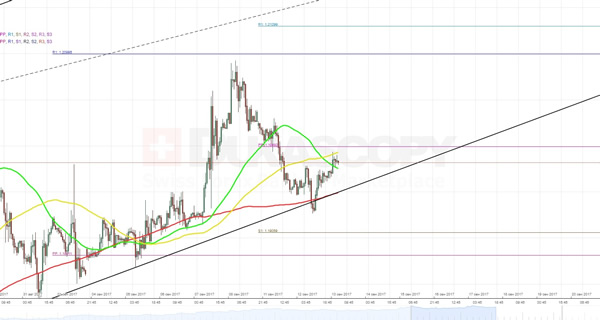
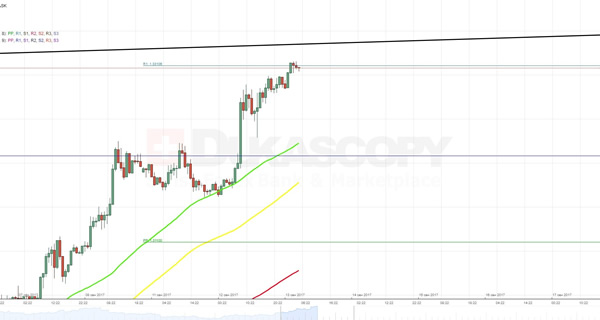
GBPUSD Analysis: To Reach Upper Edge Of Dominant Pattern
Due to release of satisfying data on the UK CPI, the Pound got an upside momentum that helped it to cross the monthly R1 at 1.3208 and then continue the surge. In the early Wednesday morning the pair even managed to reach the weekly R1. Most probably, until a release of information on the UK Average Hourly Earnings the pair will continue to fluctuate around the 1.3310 level. Usually, the market reaction on this event amounts to 30-40 basis points. This means that if the released data will justify experts' forecasts, the Sterling might finally reach the upper trend-line of a dominant ascending channel and then make a rebound. In the opposite scenario, the pair is likely to slip back to the 55-hour SMA and then continue the downfall.
USDJPY Analysis: Confidently Moves To North
In result of the yesterday's advance, the currency exchange rate managed to cross practically all barriers on its way. As a result, the only two obstacles that could prevent the further path to the north, except for the upper trend-line of a former descending channel near 110.42, are the weekly R2 at 110.98 and the monthly R1 at 111.26. From this perspective, the Dollar is expected to continue to appreciate against the Yen. An aggregate of technical indicators supports this assumption, sending strong buy signals for the upcoming day. However, there is also a need to take into account that an average market sentiment remains 58% bearish. Moreover, in the middle of the day the above scenario might be altered, depending on the released US PPI data.
XAUUSD Analysis: Trades Around 1,329.68
Even though the pair managed to cross the weekly S1 at 1,329.68 yesterday, the pressure of the bears was not strong enough to push it to the bottom edge of a dominant ascending channel.
On the other hand, a fully-fledged rebound did not happen as well and is not expected to happen today either. The main reason for such assumption is that the northern side contains too many technical barriers, such as the 200- and 100-hour SMAs as well as the weekly PP at 1,343.70. They could be crossed if the gold had fundamental rationale, but for now it does not. The opposite side, in turn, has an empty area up until the lower support line of the above pattern.
EUR/USD: JOLTS Job Openings
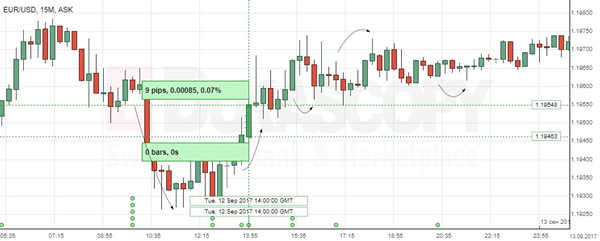
The JOLTS report showing an increase in the US job openings failed to result in the strengthening of the Greenback against the Euro on Tuesday. The bullish sentiment remained in the currency pair, as it continued trading session above the 1.954 level.
The Labour Department released its JOLTS report for July, where the amount of job openings rose surprisingly to 6.17M, following a downwardly revised figure of 6.12M in June. Data showed that slower job growth was temporary, while a new record high for the number of job openings indicated that demand for workers continued to be strong. Moreover, the labour market kept tightening due to a lack of skilled labour supply, though remained in a healthy growth state.
GBP/USD: UK Consumer Prices Index
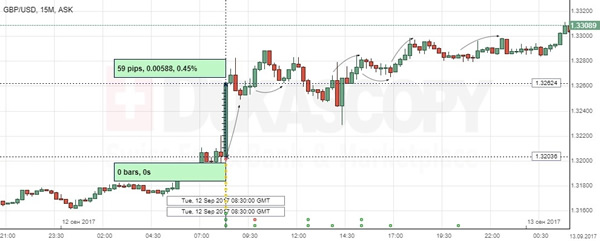
The Sterling jumped against the US Dollar to the highest level since late 2016, as Tuesday reports showed the strong growth in the UK consumer inflation. Following the release, the GBP/USD exchange rate surged 0.45% or 59 base points to the 1.3262 mark to reach the yearly peak.
The Office for National Statistics announced that its CPI for Britain revealed stronger-than-expected gain of 2.9% in August, up from an increase of 2.6% in the preceding month. The country's consumer prices growth was the strongest since the decision to quit the European Union, as Brexit kept pushing up the living cost in the UK. Higher costs of fuels as well as solid rise in clothing and footwear prices contributed most to the growth, as retailers passed cost pressures straight to customers.
Trade Idea: GBP/USD – Buy at 1.3170
GBP/USD – 1.3276
Original strategy :
Buy at 1.3170, Target:1.3370, Stop: 1.3110
Position: -
Target: -
Stop: -
New strategy :
Buy at 1.3170, Target:1.3370, Stop: 1.3110
Position: -
Target: -
Stop:-
As cable has eased after rising to 1.3329 earlier today, suggesting minor consolidation below this level would be seen and pullback to 1.3225-30 is likely, however, reckon downside would be limited to 1.3200 and support at 1.3161 should hold, bring another upmove later, above said resistance at 1.3329 would extend recent upmove to 1.3350-55 (50% projection of 1.2109-1.3269 measuring from 1.2774) but near term overbought condition should limit upside to 1.3390-00 and price should falter below 1.3440-50, bring retreat later.
In view of this, would not chase this rise here and would be prudent to buy sterling on subsequent pullback as said support at 1.3161 should limit downside, bring another rise later. Only below previous resistance at 1.3080-85 would defer and risk test of 1.3030-33 support, break there would suggest a temporary top is formed instead, risk correction to 1.2990-00 first.
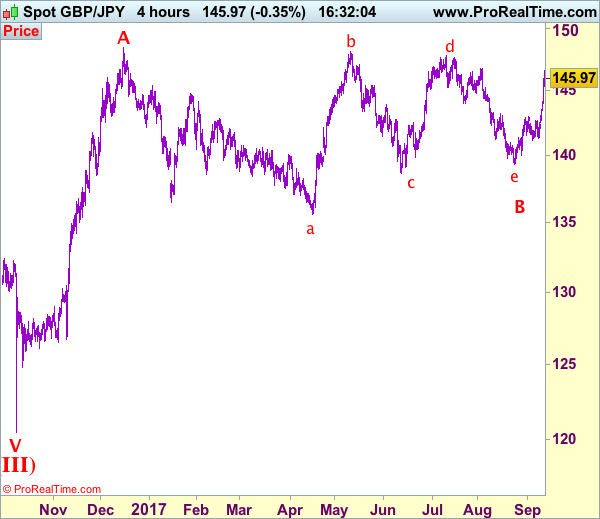
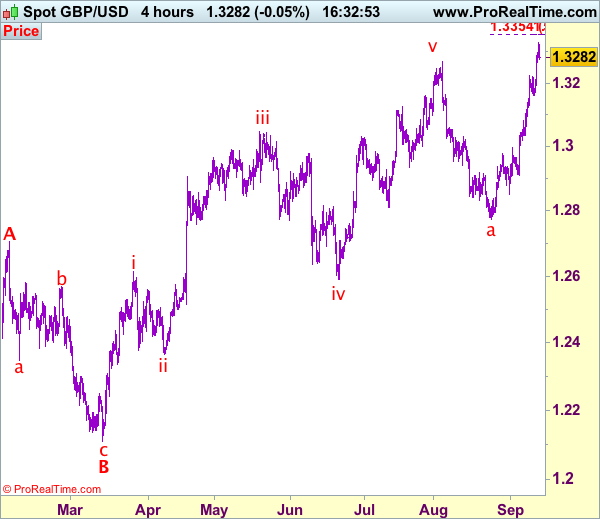
Our preferred count on the daily chart is that cable's rebound from 1.3500 (wave (A) trough) is unfolding as a wave (B) with A ended at 1.7043, followed by triangle wave B and wave C as well as wave (B) has ended at 1.7192, the subsequent selloff is the larger degree wave (C) which is still unfolding with minor wave (III) of larger degree wave 3 ended at 1.1986, hence wave (IV) correction is in progress which could either be a triangle wave (IV) of a complex formation but upside should be limited to 1.3500 and price should falter well below 1.4000, bring another decline in wave (V) of 3 for weakness to 1.1500, then 1.1200.
Trade Idea: GBP/JPY – Buy at 145.00
GBP/JPY - 146.00
Original strategy:
Buy at 144.80, Target: 146.80, Stop: 144.20
Position: -
Target: -
Stop: -
New strategy :
Buy at 145.00, Target: 147.00, Stop: 144.40
Position: -
Target: -
Stop:-
Although sterling has retreated after rising to 146.65 earlier today, this week’s rally signals early fall from 147.75 has ended at 139.35 (tentatively the final e leg of larger degree wave B), hence bullishness remains for test of resistance at 146.80, break there would add credence to this view and encourage for headway to 147.30-40, then retest of previous resistance at 147.75 which is likely to hold from here due to near term overbought condition,
In view of this, we are looking to buy sterling on pullback but at a higher level as 144.90-00 should limit upside. Only below said previous resistance at 143.00 (tentatively wave i top) would abort and signal top is formed instead, bring weakness to 142.50, then 142.20-25, however, reckon support at 141.30-35 would remain intact, bring another rebound later.
Our preferred count is that larger degree wave V with circle is unfolding from 251.12 with wave (I) 219.34, (II): 241.38 and wave (III) is subdivided into 1: 192.60, 2: 215.89 (23 Jul 2008) and wave 3 ended at 118.87 earlier in 2009. The correction from there to 162.60 is wave 4 which itself is a double three and is labeled as first a-b-c ended at 151.53, followed by wave x at 139.03, 2nd a ended at 162.60, 2nd b at 146.75 and 2nd c leg of wave 4 ended at 163.00. Therefore, the decline from 163.00 to 116.85 is now treated as wave 5 which also marked the end of larger degree wave (III), hence wave (IV) major correction has commenced for retracement of the wave (III) from 241.38 and upside target at 183.95-00 (50% Fibonacci retracement of the wave (II) from 241.38) had been met, a drop below 160.00 would suggest wave (IV) has ended at 195.85, bring decline in wave (V) for initial weakness to 130 (already met) and 120.