Sample Category Title
EUR/USD Daily Outlook
Daily Pivots: (S1) 1.1935; (P) 1.1956 (R1) 1.1987; More...
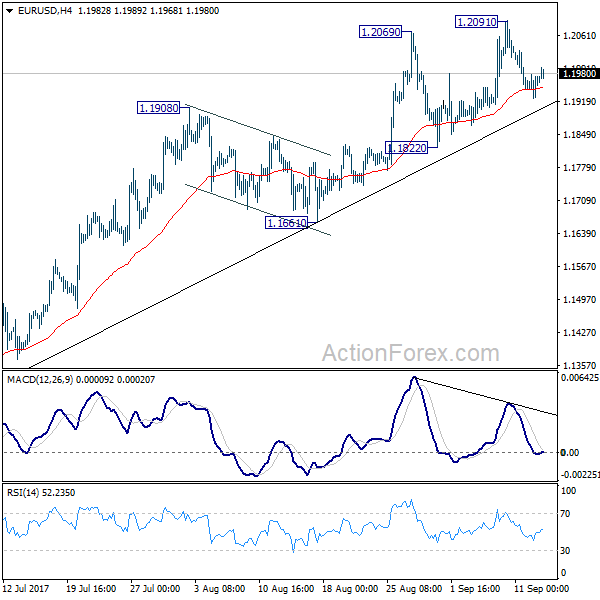
EUR/USD is staying in consolidation below 1.2091 and intraday bias remains neutral first. Overall, outlook remains bullish as long as 1.1822 support holds. Above 1.2091 will extend larger rise from 1.0339 and target next key fibonacci level at 1.2516. But considering bearish divergence condition in 4 hour MACD, break of 1.1822 will confirm short term topping and bring deeper fall back to 1.1661 support and below.
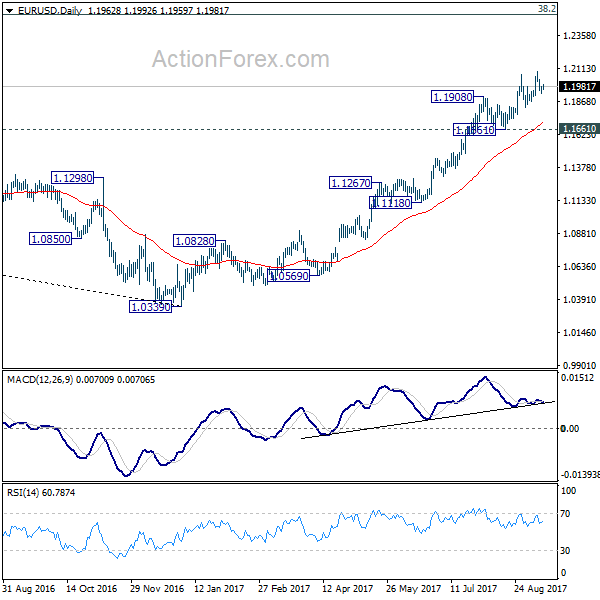
In the bigger picture, rise from medium term bottom at 1.0339 is still in progress for 38.2% retracement of 1.6039 (2008 high) to 1.0339 (2017 low) at 1.2516. However, it should be noted that there is no confirmation of trend reversal yet. That is, such rebound from 1.0399 could be a correction. And the long term fall fro 1.6039 (2008 high) could resume. Hence, we'd be cautious on strong resistance from 1.2516 to limit upside. But after all, break of 1.1661 is needed to indicate medium term topping. Otherwise, outlook will remain bullish in case of pull back.
GBP/USD Daily Outlook
Daily Pivots: (S1) 1.3193; (P) 1.3245; (R1) 1.3334; More...
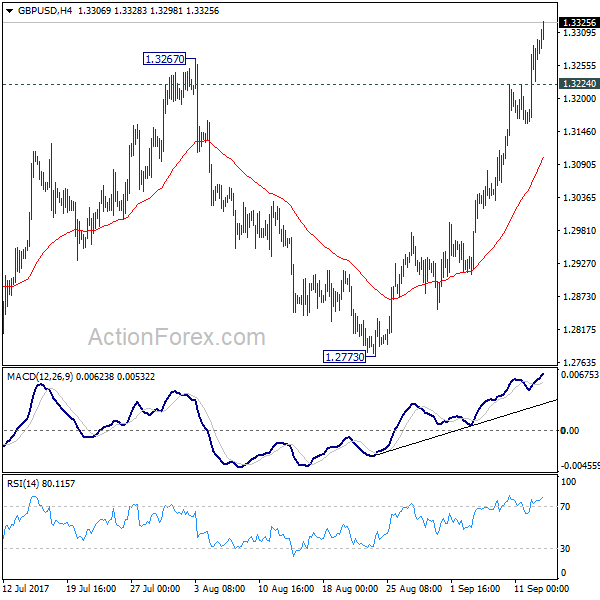
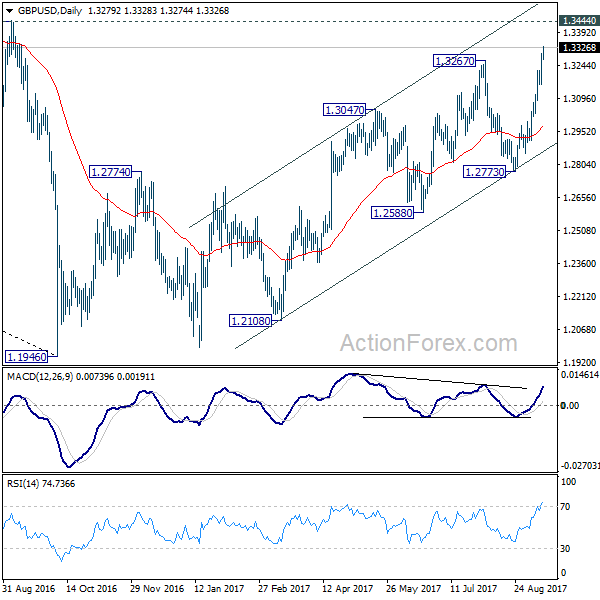
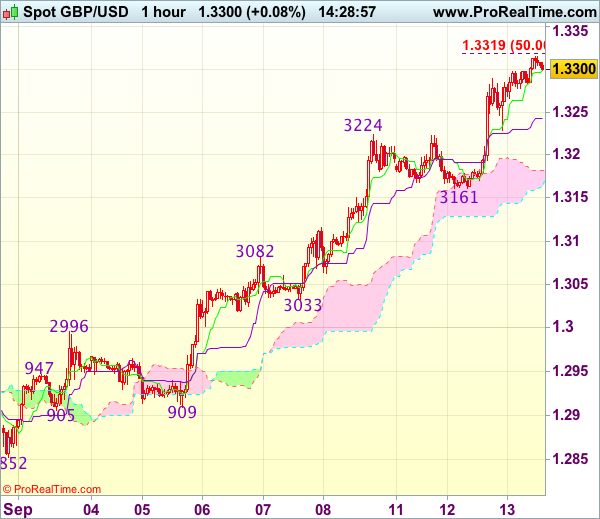
GBP/USD rises to as high as 1.3327 so far as recent rally continues. Intraday bias remains on the upside for 1.3444 key resistance next. At this point, we'd maintain that price actions from 1.1946 are still seen as a corrective pattern. Hence, we'd expect strong resistance from 1.3444 to limit upside to bring larger down trend reversal eventually. On the downside below, 1.3224 minor support will turn intraday bias neutral again. However, firm break of 1.3444 will carry larger bullish implication and target 1.3835/5016 resistance first zone first.
In the bigger picture, overall, price actions from 1.1946 medium term low are seen as a corrective pattern. While further rise cannot be ruled out, larger outlook remains bearish as long as 1.3444 key resistance holds. Down trend from 1.7190 (2014 high) is expected to resume later after the correction completes. And break of 1.2773 support will be the first sign that such down trend is resuming. However, considering bullish convergence condition in monthly MACD, firm break of 1.3444 will argue that whole down trend from 2.1161 (2007) has completed. And stronger rise would be seen back to 38.2% retracement of 2.1161 to 1.1946 at 1.5466.
Trade Idea : USD/CHF – Buy at 0.9540
USD/CHF - 0.9596
Most recent candlesticks pattern : N/A
Trend : Near term up
Tenkan-Sen level : 0.9597
Kijun-Sen level : 0.9583
Ichimoku cloud top : 0.9545
Ichimoku cloud bottom : 0.9498
Original strategy :
Buy at 0.9540, Target: 0.9640, Stop: 0.9505
Position : -
Target : -
Stop : -
New strategy :
Buy at 0.9540, Target: 0.9640, Stop: 0.9505
Position : -
Target : -
Stop : -
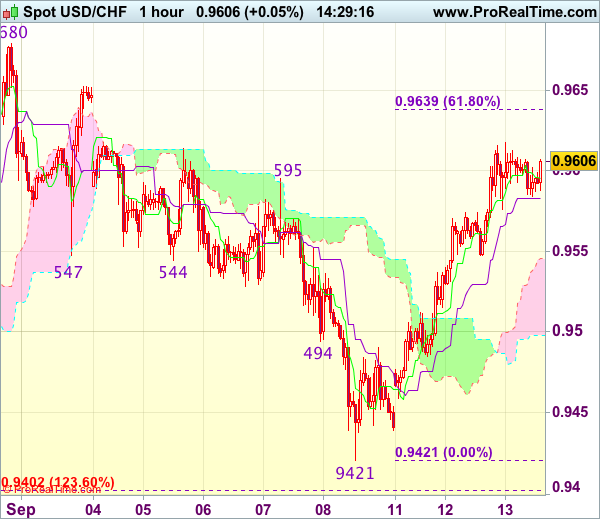
The greenback has maintained a firm undertone after staging a strong rebound yesterday, the breach of previous resistance at 0.9595 adds credence to our view that low has been formed at 0.9421 and consolidation with upside bias remains for further gain to 0.9635-40 (61.8% Fibonacci retracement of 0.9773-0.9421), however, near term overbought condition would limit upside to 0.9680 and reckon resistance at 0.9698-99 would remain intact.
In view of this, we are looking to reinstate long on dips as 0.9550-55 should limit downside and bring another upmove later. Below 0.9525-30 would defer and risk correction to 0.9500 but downside should be limited and 0.9450-60 would remain intact, bring another rebound later.
USD/CHF Daily Outlook
Daily Pivots: (S1) 0.9554; (P) 0.9586; (R1) 0.9631; More....
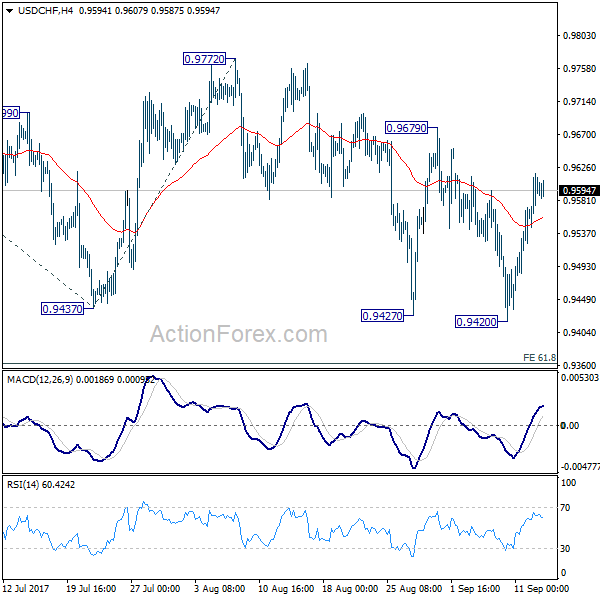
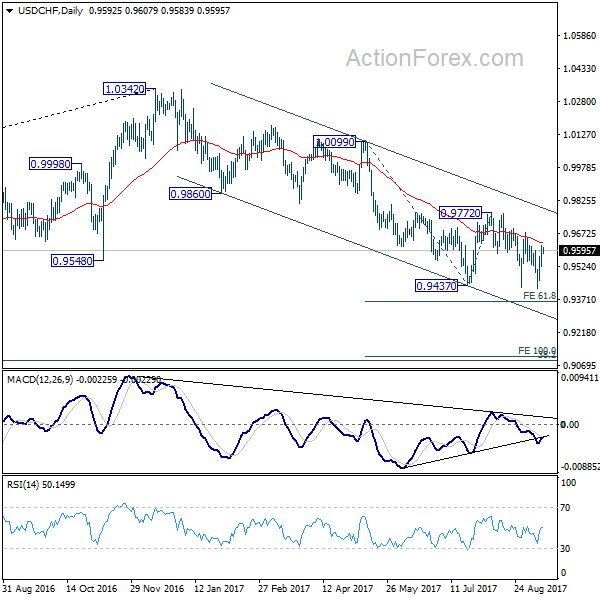
Rebound from 0.9420 is quite strong. But still, with 0.9679 resistance intact, outlook stays bearish. Another fall is still expected. Sustained break of 0.9420 will target 61.8% projection of 1.0099 to 0.9437 from 0.9772 at 0.9363 first. Break will target 100% projection at 0.9110 next. However, break of 0.9679 will indicate near term reversal and turn bias to the upside for 0.9772 resistance for confirmation.
In the bigger picture, current development suggests that 0.9443 key support (2016 low) could be taken out firmly as down trend form 1.0342 extends. There are various interpretation of the price actions. But in any case, medium term outlook will stay bearish as long as 0.9772 resistance holds. Current down trend could extend to 38.2% retracement of 0.7065 (2011 low) to 1.0342 (2016 high) at 0.9090. However, break of 0.9772 will indicate that USD/CHF has successfully defended 0.9443 again and turn outlook bullish for 1.0099 resistance.
Why 0.7320 Is Significant For Kiwi Dollar?
Key Highlights
- The New Zealand Dollar is trading with a positive bias, but faces a major resistance near 0.7320 against the US Dollar.
- There are two bearish trend lines with resistance near 0.7320 formed on the 4-hours chart of NZD/USD.
- New Zealand Food Price Index in August 2017 rose 0.6%, compared with the last -0.2%.
- The US Producer Price Index for August 2017 will be released today, which is forecasted to increase by 0.3% (MoM).
NZDUSD Technical Analysis
The New Zealand Dollar recovered well from the August 2017 low of 0.7130 against the US Dollar. The NZD/USD pair is currently in the bullish zone, but faces a crucial resistance near 0.7320.
The pair already attempted twice to settle above the 0.7320-0.7340 resistance levels, but failed. There are two bearish trend lines with resistance near 0.7320 formed on the 4-hours chart. These trend lines along with the 200 simple moving average (H4) are protecting an upside break.
On the downside, there are two bullish trend lines near 0.7270 and 0.7240. Moreover, the 100 simple moving average (H4) is at 0.7230 to act as a major support.
Overall, it seems like the pair is well supported on the downside between 0.7270-0.7220. Having said that, the pair needs to break the 0.7320-0.7340 to gain further upside momentum.
New Zealand Food Price Index
Today in New Zealand, the Food Price Index (FPI) for August 2017 was released by the Statistics New Zealand. The forecast was slated for a minor rise of 0.1% compared with the previous month.
However, the actual result was above the forecast, as the FPI posted an increase of 0.6%, compared with the last -0.2%. There was a sharp rise in Butter prices in August 2017 by 11% to a new high of $5.39 a block.
Commenting on the data, the consumer's price index manager, Matthew Haigh, stated:
We have seen butter prices rising lately due to New Zealand's export driven market. Butter prices have experienced all-time highs in the global market, and this also drives the price here at home.
To sum up, the NZD/USD pair remains elevated, but it won't be easy for buyers to clear strong offers near 0.7320 and 0.7340.
Trade Idea : GBP/USD – Buy at 1.3230
GBP/USD - 1.3309
Most recent candlesticks pattern : N/A
Trend : Near term up
Tenkan-Sen level : 1.3299
Kijun-Sen level : 1.3243
Ichimoku cloud top : 1.3182
Ichimoku cloud bottom : 1.3174
Original strategy :
Buy at 1.3175, Target: 1.3275, Stop: 1.3140
Position : -
Target : -
Stop : -
New strategy :
Buy at 1.3230, Target: 1.3330, Stop: 1.3195
Position : -
Target : -
Stop : -
As cable has continued moving higher after yesterday’s rally above resistance at 1.3269, adding credence to our bullish view that medium term upmove has resumed and upside bias remains for further gain to 1.3355-60 (61.8% projection of 1.2909-1.3224 measuring from 1.3161), however, loss of near term upward momentum should prevent sharp move beyond there and reckon 1.3390-00 would hold from here, risk from there has increased for a retreat to take place later.
In view of this, would not chase this rise at current level and would be prudent to buy cable on subsequent pullback as previous resistance at 1.3224 (now support) should limit downside and bring another upmove. Below 1.3200 would defer and risk correction towards support at 1.3161 which is likely to hold from here.
USD/JPY Daily Outlook
Daily Pivots: (S1) 109.51; (P) 109.88; (R1) 110.53; More...
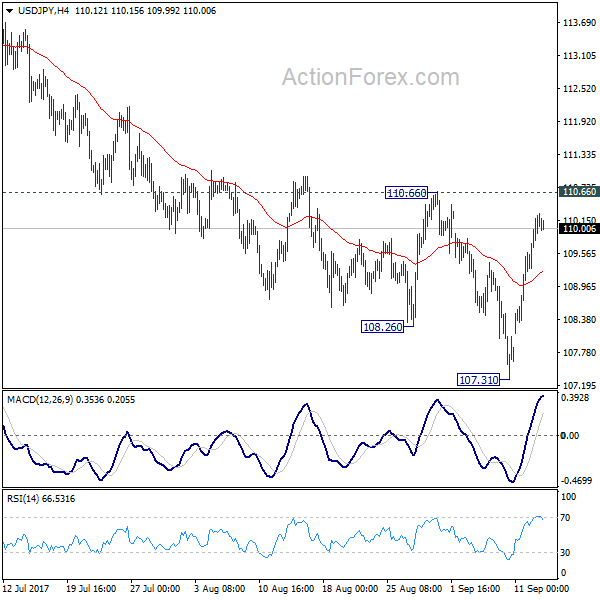
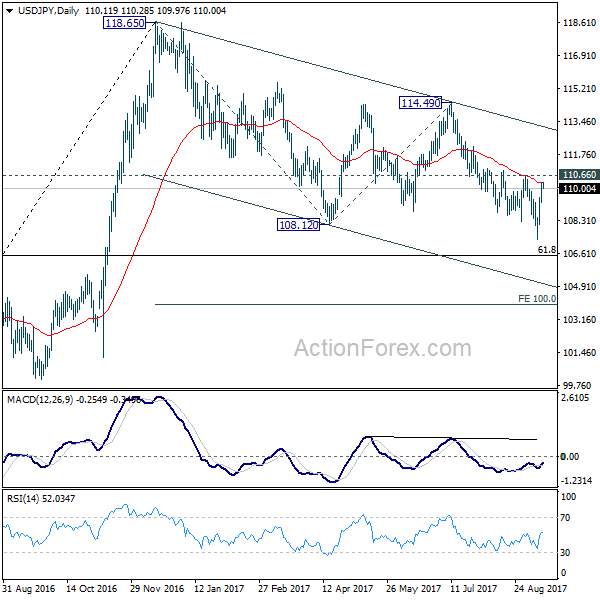
Outlook in USD/JPY remains unchanged. While the rebound from 107.31 is strong, it's limited below 110.66 resistance so far. Outlook stays bearish and another fall is still expected. Break of 107.31 will extend the whole fall from 118.65 to 61.8% retracement of 98.97 to 118.65 at 106.48 first. We'd look for support from there to bring rebound. But firm break of 106.48 will extend the decline to 100% projection of 118.65 to 108.12 from 114.49 at 103.96 or below. On the upside, firm break of 110.66 will confirm short term bottoming and turn bias back to the upside.
In the bigger picture, rise from 98.97 (2016 low) is now seen as the second leg of the corrective pattern from 125.85 (2015 high). It's unclear whether this this second leg has completed at 118.65 or not. But medium term outlook will be mildly bearish as long as 114.49 resistance holds. And, there is prospect of breaking 98.97 ahead. Meanwhile, break of 114.49 will bring retest of 125.85 high. But even in that case, we don't expect a break there on first attempt.
AUD/USD Daily Outlook
Daily Pivots: (S1) 0.7995; (P) 0.8022; (R1) 0.8045; More...
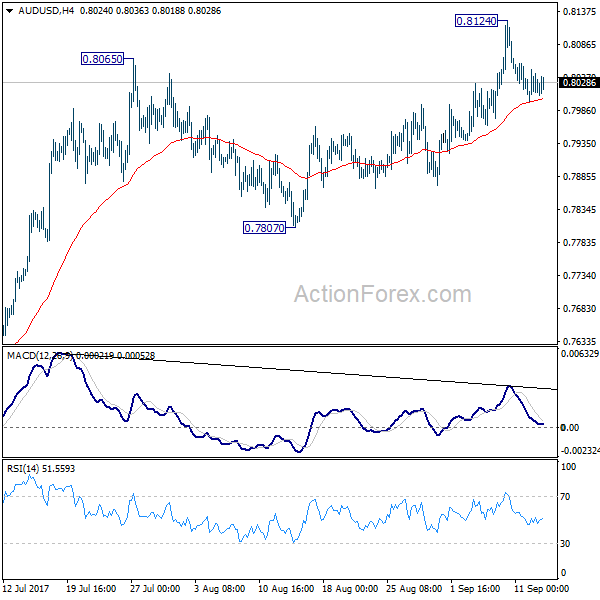
AUD/USD's staying in consolidation below 0.8124 temporary top. Intraday bias remains neutral for more corrective trading. . Overall, as long as 0.7807 support holds, near term outlook remains bullish for further rally. Above 0.8124 will target 100% projection of 0.6826 to 0.7833 from 0.7328 at 0.8335 next. However, considering bearish divergence condition in 4 hour MACD, firm break of 0.7807 will indicate near term reversal and turn bias back to the downside for 0.7328 key support.
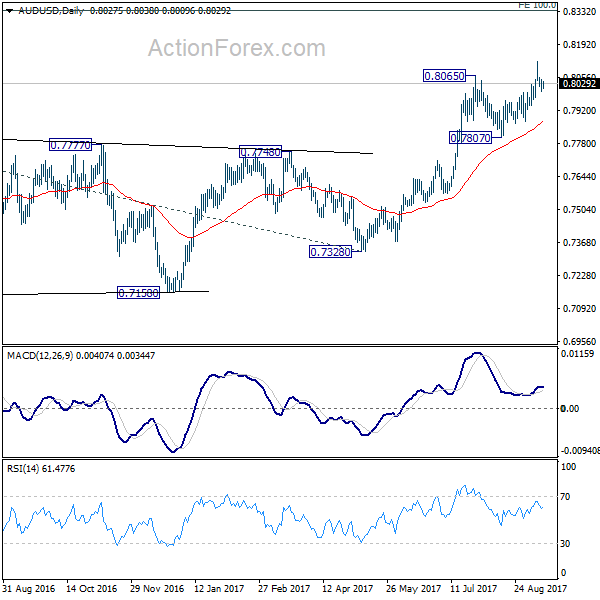
In the bigger picture, rise from 0.6826 medium term bottom is still in progress. At this point, there is no confirmation of trend reversal yet and we'll continue to treat such rebound as a corrective pattern. But in any case, break of 55 month EMA (now at 0.8090) will target 38.2% retracement of 1.1079 to 0.6826 at 0.8451. Break of 0.7807 support is needed to to be the first sign of completion of the rebound. Otherwise, further rise is now in favor.
US Equities At Record Levels
US equities closed at record levels on Wednesday, as improved risk-on sentiment returned to the markets and news that the US economy will benefit if the US tax reform is passed. US Treasury Secretary Mnuchin stated on Tuesday that “tax reform could be backdated to January 1st, 2017 as it would be a “big boon for the economy.” He also commented that the Trump administration was “super focused” on ensuring tax reform would be completed by the end of the year. Such comments helped the supported rise in US Treasury Yields.
On Wednesday, Asian equity markets reached a 10-year high, although the markets remain cautious that geo-political tensions between North Korea and the US could escalate following President Trump’s comments that the recent UN sanctions against North Korea were a “very small step” and “nothing compared to what ultimately will have to happen” to deal with North Koreas’ nuclear program. Following the recent sanctions, North Korea has vowed to redouble its efforts to fight of the threat of a US invasion. With continued rhetoric, markets will remain on edge and will ultimately look to safe havens.
UK Consumer Price Index was released on Tuesday, showing increasing UK inflation rising to 2.9% (YoY) in August. GBPUSD reached a 1 year high on the news. Inflation above the Bank of England’s target of 2% has been complicating why policy makers are not raising UK interest rates. With a Bank of England Policy meeting being held on Thursday, the markets are looking for clues as to the likely timing of rate hikes.
EURUSD edged higher overnight to currently trade around 1.1980.
USDJPY moved higher with improved risk-on sentiment. Currently, USDJPY is trading around 110.15.
GBPUSD benefitted from, higher than expected, UK inflation data. Currently, GBPUSD is trading around 1.3300.
Gold lost ground against USD and currently trades around $1,330.
WTI was trading in a narrow range ahead of today’s EIA report. Currently, WTI is trading around $48.70.
The major economic data releases for today will be:
At 13:30 BST, the Bureau of Labor statistics, Department of Labor will release Producer Price Index (MoM) for August. As a clear indicator of commodity inflation, this release could potentially help the Federal Reserve in its plans for a further rate hike this year if the release comes in strongly. The previous release, of -0.1% is expected to be bettered with the consensus calling for an increase to 0.3%. If the release is wildly different from the consensus we can expect USD volatility.
At 15:30, the Energy Information Administration will release Crude Oil Stocks change for September 4th. The impact of Hurricane Harvey is still being felt in the US, so markets will be eager to see if the consensus comes in at 2.285M (from the previous 4.580M). Expect Oil to see volatility if the released number is significantly different than the consensus.
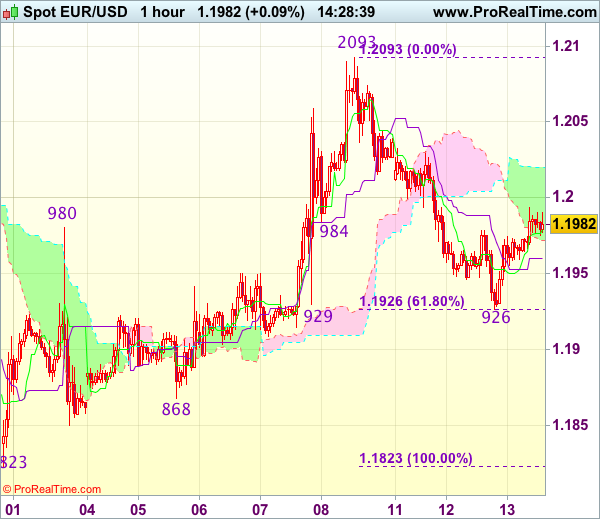
Trade Idea : EUR/USD – Stand aside
EUR/USD - 1.1981
Most recent candlesticks pattern : N/A
Trend : Up
Tenkan-Sen level : 1.1979
Kijun-Sen level : 1.1960
Ichimoku cloud top : 1.2020
Ichimoku cloud bottom : 1.1972
New strategy :
Stand aside
Position : -
Target : -
Stop : -
As the single currency has rebounded after falling to 1.1926 (exactly 61.8% Fibonacci retracement of 1.1823-1.2093), suggesting consolidation above this level would be seen and recovery to 1.2000 cannot be ruled out, however, reckon the upper Kumo (now at 1.2020) would limit upside and bring another decline. Below said support at 1.19256 would extend the fall from 1.2093 top to 1.1900 but loss of near term downward momentum should prevent sharp fall below previous support at 1.1868 and price should stay well above another previous support at 1.1823, bring rebound later.
In view of this, would not chase this fall here and would be prudent to stand aside in the meantime. Above 1.2020-30 (current level of the upper Kumo and previous resistance) would suggest the fall from 1.2093 has ended and bring a stronger rebound to 1.2050-60 but reckon upside would be limited to 1.2070, bring another decline.