Sample Category Title
Election Poll Pushes NZD Higher
The Kiwi dollar spiked higher yesterday, following the release of an opinion poll regarding New Zealand's upcoming General election on the 23rd of September. The poll showed the incumbent National Party being very safely ahead, something that may have come as a surprise considering that most polls suggest an extremely tight race between the National and Labour parties.
If the outcome is indeed very close, as the majority of opinion polls suggest, then one of these two main parties may have to form a coalition with the populist New Zealand First party, which advocates anti-immigration and protectionist policies. In our view, any potential coalition that includes NZ First could weigh notably on NZD, considering that protectionist policies would likely hurt the nation's trade-focused economy.
So far, the NZD has surged on polls showing the National Party being safely ahead, and declined on polls showing Labour gaining popularity. We believe this may have occurred mainly because a Labour victory could imply a Labour-NZ First coalition that renegotiates trade deals such as the Trans-Pacific Partnership (TPP), something Labour stated is likely to do. Any future polls that show the National Party being safely ahead could support NZD further, on speculation that the status-quo will be maintained. On the other hand, signs that Labour could win and perhaps even form a coalition with NZ First, could raise the likelihood for protectionist policies and thereby, weigh on the currency.
NZD/USD surged during the European morning Tuesday, after it hit support at 0.7225 (S2), near the prior downside resistance line drawn from the peak of the 21st of August. In our view, the pair shows signs of a short-term trend reversal, from a downtrend to an uptrend. However, we would like to see a clear break above the 0.7335 (R2) resistance before we get confident on more bullish extensions. Such a move could initially aim for the 0.7370 (R3) barrier, where another break is possible to pave the way for the key territory of 0.7400.
UK inflation accelerates; focus turns to wage data
Yesterday, both the headline and the core UK CPI rates for August rose by more than anticipated, enhancing speculation for a near-term BoE rate hike and pushing sterling even higher. The probability for a hike by year-end now rests at 50% according to the UK OIS. In our view, this development places even more emphasis on the labor market data for July we get today. The consensus is for the unemployment rate to have held steady at 4.4%, while average weekly earnings (both including and excluding bonuses) are anticipated to have accelerated.
Coming on top of firming inflation, a potential acceleration in wages could heighten further expectations for a more hawkish tone by the BoE when it meets tomorrow, and perhaps raise the odds for more than 2 MPC members voting for a hike. Something like that could bring the pound under renewed buying pressure.
GBP/USD surged yesterday after data showed that UK inflation accelerated. The pair rebounded from near 1.3160 (S3) and subsequently, it broke above the resistance (now turned into support) barrier of 1.3270 (S1), marked by the peak of the 3rd of August. On the 4-hour chart, we still see a short-term uptrend and thus, we believe that the break above 1.3270 (S1) may have opened the way for our next hurdle of 1.3360 (R1).
As for the bigger picture, the rate continues to trade above the medium-term upside support line taken from back at the low of the 7th of October. Actually, the latest recovery started after the rate rebounded from that line. This is another point enhancing our view that the rate could continue trading north for a while, perhaps until it tests the long-term downside resistance line, drawn from the peaks of July 2014.
As for the rest of today's highlights:
Besides the UK employment data, there are lots of second-tier indicators on the calendar today. Germany's final CPI for August, Eurozone's industrial production for July, and the US PPI figures for August are all coming out.
We have only one speaker on the agenda: EU Commission President Jean-Claude Junker. He will speak before the EU Parliament and he is expected to lay out the EU's priorities for the upcoming year. With the theme of potential EU reforms currently in the spotlight after the French elections and ahead of the German ones, Junker's comments could raise some eyebrows, should he address the subject.
NZD/USD
Support: 0.7260 (S1), 0.7225 (S2), 0.7195 (S3)
Resistance: 0.7300 (R1), 0.7335 (R2), 0.7370 (R3)
GBP/USD
Support: 1.3270 (S1),1.3225 (S2), 1.3160 (S3)
Resistance: 1.3360 (R1), 1.3450 (R2), 1.3500 (R3)
Trade Idea: EUR/JPY – Buy at 131.35
EUR/JPY - 131.80
New strategy :
Buy at 131.35, Target: 133.35, Stop: 130.75
Position: -
Target: -
Stop:-
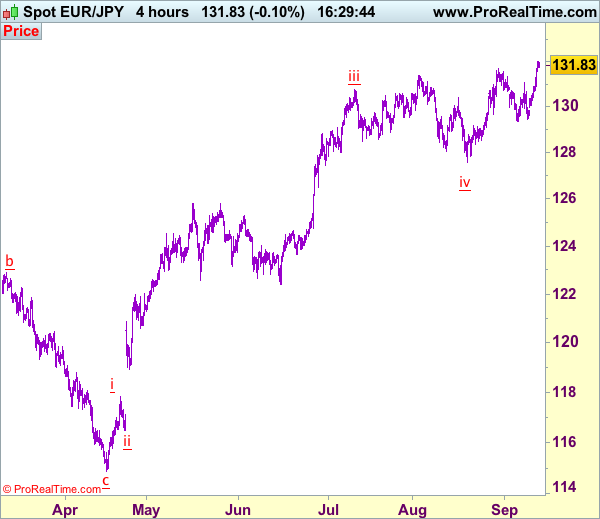
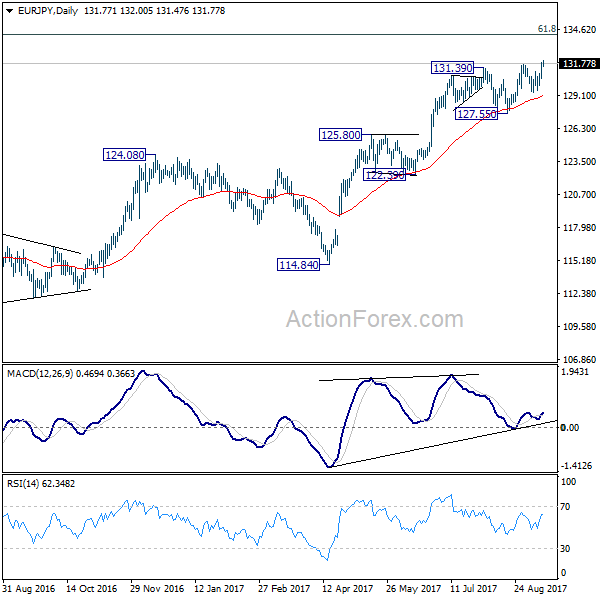
As euro’s rally has gathered momentum and broke above indicated previous resistance at 131.71, signaling early upmove has resumed and bullishness is for further gain to 132.40-50, then towards 133.00-10, however, near term overbought condition should prevent sharp move beyond 133.50 and upside should be limited to 133.90-00, risk from there is seen for a retreat later.
In view of this, would not chase this rise here and would be prudent to buy euro on pullback as 131.30-35 should limit downside. Below support at 130.91 would abort and suggest top is formed, bring weakness to 130.50-60 but still reckon downside would be limited to 130.25-30 and this week’s low at 129.95 should remain intact.
Our latest preferred count is that wave (ii) is ABC-X-ABC which ended at 123.33 and wave (iii) is unfolding with wave iii ended at 100.77, followed by wave iv at 111.57 and wave v as well as the wave (iii) has ended at 97.04, followed by wave (iv) at 111.43 and wave (v) has ended at 94.12 which is also the end of the larger degree v, this also implied the major wave (C) has also ended there, hence major correction has commenced from there with (A) leg unfolding in its lower degree wave c which has possibly ended at 145.69. Under this count, A-B-C wave (B) has commenced with A leg ended at 136.23, wave B at 143.79 and wave C has possibly ended at 149.79.
Our larger degree count is that the decline from 139.26 is wave (C) and is sub-divided into a diagonal triangle i-ii-iii-iv-v with wave i - 105.44, wave ii- 123.33, wave iii - 97.03, wave iv - 111.43, followed by the final wave v as well as the end of wave (C) at 94.12, this also mark the bottom of larger degree wave B. Under this count, major rise in wave C has commenced as an impulsive wave with minor wave III ended at 145.69, wave V is still in progress for further gain to 150.00. Having said that, this so-called wave V could well be the first leg of larger degree 5-waver wave C and this wave C should bring at least a retest of wave A top at 169.97 (July 2008).
Trade Idea: AUD/USD – Sell at 0.8090
AUD/USD – 0.8041
Original strategy:
Sell at 0.8090, Target: 0.7900, Stop: 0.8150
Position: -
Target: -
Stop:-
New strategy :
Sell at 0.8090, Target: 0.7900, Stop: 0.8150
Position: -
Target: -
Stop:-
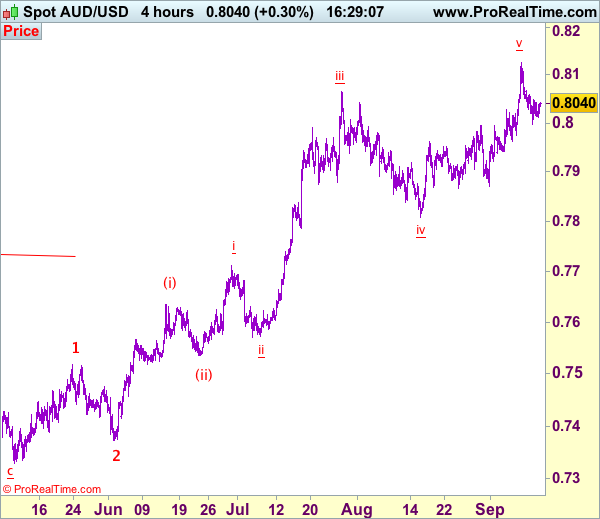
As aussie has recovered after finding support at 0.8011, retaining our view that further consolidation above 0.7998 (this week’s low) would be seen and another bounce to 0.8070 cannot be ruled out, however, if our view that top has possibly been formed at 0.8125 is correct, upside would be limited to 0.8090 and bring retreat later, below 0.8011 would bring test of 0.7998, break there would add credence to this view, bring test of previous support at 0.7963, below there would confirm and bring retracement of recent rise to 0.7920-25 and later 0.7890-00 but support at 0.7867-71 should remain intact.
In view of this, we are looking to sell aussie on recovery as 0.8090-00 should limit upside. Above said resistance at 0.8125 would (last week’s high) would extend recent upmove in wave v of (iii) to 0.8150, then towards 0.8200, however, loss of upward momentum should prevent sharp move beyond 0.8225-30 and price should falter below 0.8250-60, risk from there is seen for a retreat later.
On the 4-hour chart, the move from 0.8066 is the wave 5 with i: 0.8860, ii: 0.8315, wave iii is an extended move ended at 1.0183, iv: 0.9706 and wave v has ended at 1.1081 (also the top of entire wave 5). The subsequent selloff is the major correction which is unfolding as ABC-X-ABC and 2nd A leg has ended at 0.8848, followed by a-b-c wave B which ended at 0.9758, hence, 2nd C wave is now in progress and indicated downside target at 0.7000 and 0.6950 had been met, so further fall to 0.6710-20 cannot be ruled out.
Sterling Trades Above 1.3300
The British pound has moved to a new 2017 trading high against the U.S dollar, for a second consecutive day. Price-action broke above the 1.3289 level, hitting 1.3315 during the Asian trading session.
During the upcoming European session, GBPUSD traders will await the next directional move in sterling, after the release of key wage earnings and jobs data from the United Kingdom economy.
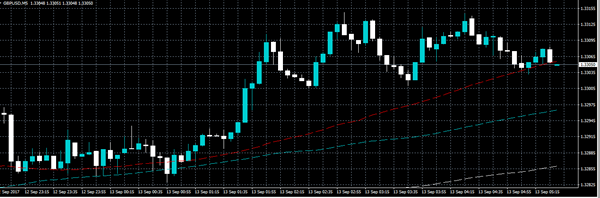
The GBPUSD pair remains strongly bullish on all-time frames, with price-action fast approaching the trend defining 100-week moving average.
Key intraday technical resistance is located at the 1.3328, 1.3347 and 1.3380 levels, with the pairs 100-week moving average, at 1.3398.

Key intraday GBPUSD technical support below the 1.3300 level is located at 1.3289, with the former monthly high, at 1.3268.
The daily pivot point is located at 1.3252, with further support coming from the former swing price low, at 1.3228.
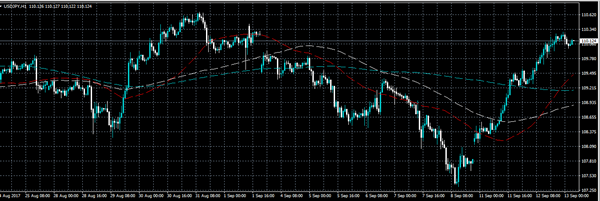
USDJPY Closes Price Gap
The USDJPY pair has moved above the 110 level, closing the gap created on the price charts on September 1st. Price-action continues to remain bullish, with the pair so far climbing to an intraday high of 110.29.
Later today, traders will look to key United States PPI data for the month of August, with most analysts expecting a 0.3 percent increase, much better than the –0.1 percent decline in U.S PPI seen in July.
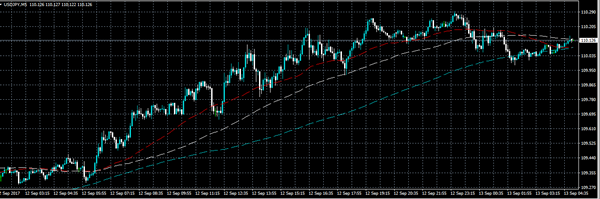
The USDJPY remains strongly bullish on an intraday basis while trading above the 109.90 level, with the pair rallying close to three-hundred pips, since last Friday's sell-off to 107.31.
Key intraday technical resistance is located at 110.29, the July 31st swing high, at 110.67, and the former monthly price high, at 111.05.
To the upside, key intraday technical resistance for the EURUSD pair is located at 1.1962, 1.1979 and 1.1999. Above the 1.1999 level, further resistance is found at the former swing price high at 1.3039.
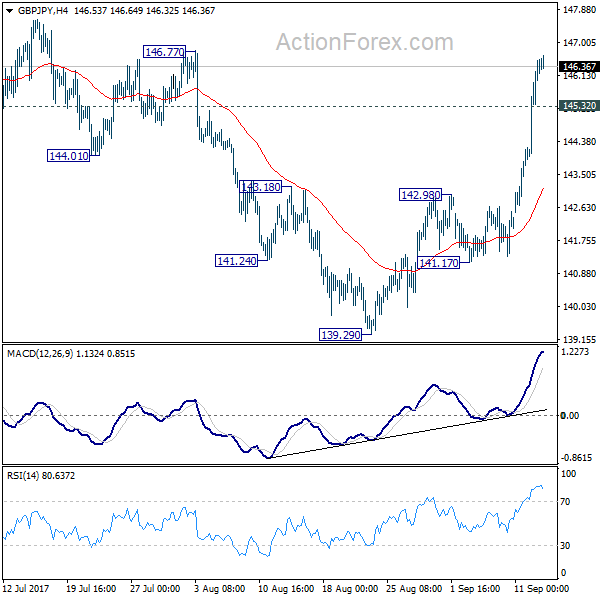
GBP/JPY Daily Outlook
Daily Pivots: (S1) 144.62; (P) 145.57; (R1) 147.27; More
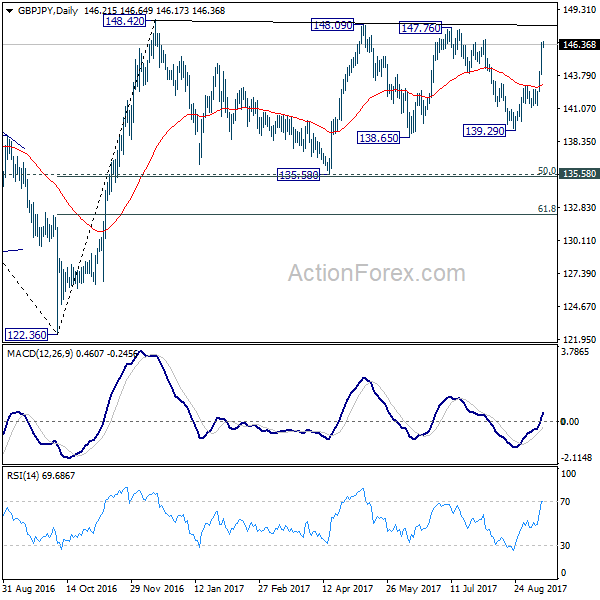
GBP/JPY's rise from 139.29 is still in progress and intraday bias remains on the upside for 147.76/148.42 resistance zone. Decisive break there will confirm resumption of medium term rebound from 122.36. On the downside, below 145.32 minor support will turn intraday bias neutral first. Overall, for the moment, GBP/JPY is still bounded in sideway consolidation pattern from 148.42.
In the bigger picture, the sideway pattern from 148.42 is still unfolding. In case of deeper fall, we'd expect strong support from 135.58 and 50% retracement of 122.36 to 148.42 at 135.39 to contain downside. Medium term rise from 122.36 is expected to resume later. And break of 38.2% retracement of 196.85 to 122.36 at 150.43 will carry long term bullish implications. However, firm break of 135.58/39 will dampen the bullish view and turn focus back to 122.36 low.
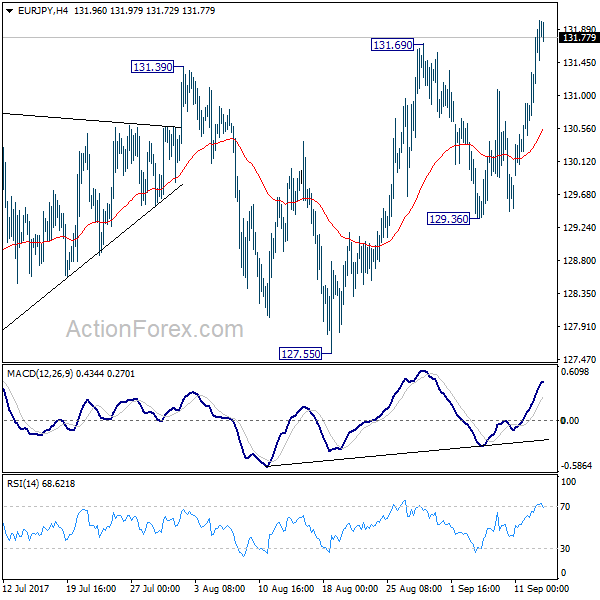
EUR/JPY Daily Outlook
Daily Pivots: (S1) 131.02; (P) 131.46; (R1) 132.25; More...
EUR/JPY's break of 131.69 resistance confirms resumption of larger rally. Intraday bias is back on the upside. Current rise should target 134.20 fibonacci level next. On the downside, break of 129.36 support is now needed to indicate short term topping. Otherwise, outlook will remain bullish in case of retreat.
In the bigger picture, current rise from 109.03 is seen as at the same degree as the down trend from 149.76 (2014 high) to 109.03 (2016 low). as long as 124.08 resistance turned support holds, further rise is expected to 61.8% retracement of 149.76 to 109.03 at 134.20. Sustained break there will pave the way to key long term resistance zone at 141.04/149.76. However, firm break of 124.08 will argue that rise from 109.03 is completed and turn outlook bearish.
EUR/GBP Daily Outlook
Daily Pivots: (S1) 0.8966; (P) 0.9024; (R1) 0.9066; More
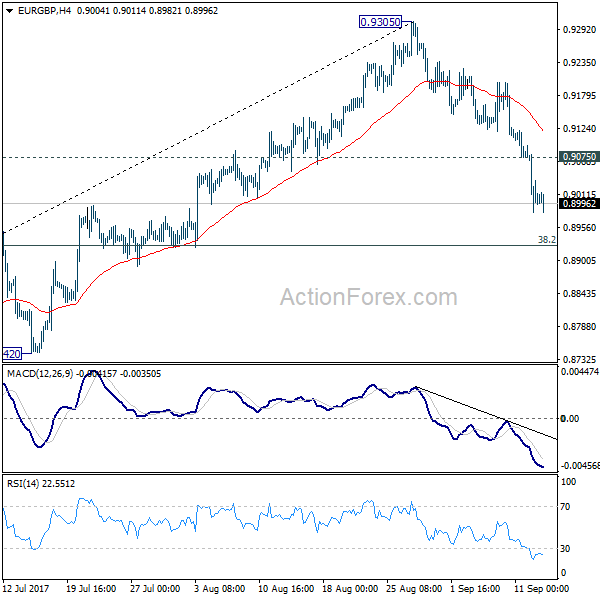
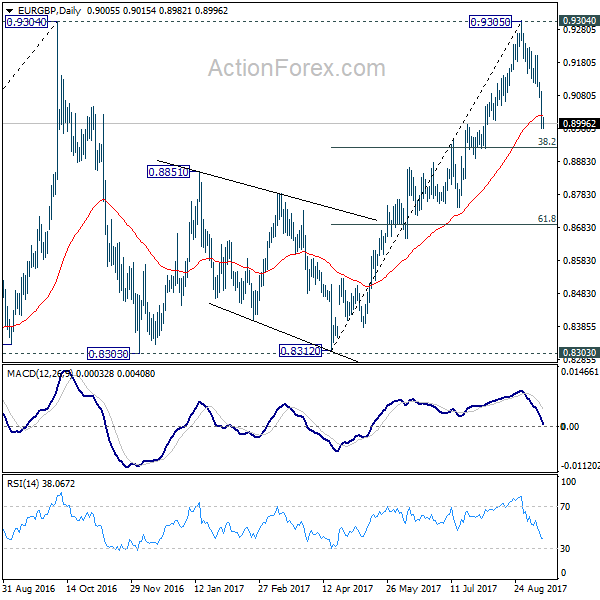
Intraday bias in EUR/GBP remains on the downside for 38.2% retracement of 0.8312 to 0.9305 at 0.8926 first. Fall from 0.9305 is likely the third leg of the consolidation from 0.9304. Break of 0.8926 will target 61.8% retracement at 8691 and below. On the upside, above 0.9075 minor resistance will turn intraday bias neutral first.
In the bigger picture, price actions from 0.9304 are viewed as a medium term corrective pattern. It's uncertain whether it is finished yet. But in case of another fall, we'd expect strong support from 0.8116 cluster support (50% retracement of 0.6935 to 0.9304 at 0.8120) to contain downside and bring rebound. Whole up trend from 0.6935 is expected to resume after consolidation from 0.9304 completes. Firm break of 0.9799 high will target 61.8% projection of 0.5680 to 0.9799 from 0.6935 at 1.1054.
NZD/USD Candlesticks and Ichimoku Analysis
Weekly
• Last Candlesticks pattern: N/A
• Time of formation: N/A
• Trend bias: Up
Daily
• Last Candlesticks pattern: Long black candlestick
• Time of formation: 1 Aug 2017
• Trend bias: Up
NZD/USD – 0.7237
Although kiwi retreated from 0.7338, as the pair found support at 0.7217 and has rebounded again, suggesting further consolidation above support at 0.7132 would be seen and upside risk remains for gain to 0.7345 (50% Fibonacci retracement of 0.7558-0.7132), however, reckon upside would be limited to 0.7395-00 (61.8% Fibonacci retracement) and bring retreat later. A break of 0.7217 would suggest the rebound from 0.7132 has ended, bring retest of this level, break there would extend the fall from 0.7558 to 0.7095-00 but loss of downward momentum should prevent sharp fall below 0.7050 and price should stay well above psychological support at 0.7000, bring rebound later.
On the upside, whilst initial recovery to 0.7345 cannot be ruled out, reckon upside would be limited to the 0.7395-00 (61.8% Fibonacci retracement of 0.7558-0.7132) and bring another decline later. A daily close above 0.7400 would risk test of resistance at 0.7455-60, break there would signal the fall from 0.7558 has ended instead, risk a stronger rebound to 0.7495-00 but upside would still be limited and price should falter well below said resistance at 0.7558, bring another retreat later.
Recommendation: Sell at 0.7395 for 0.7195 with stop below 0.7495.
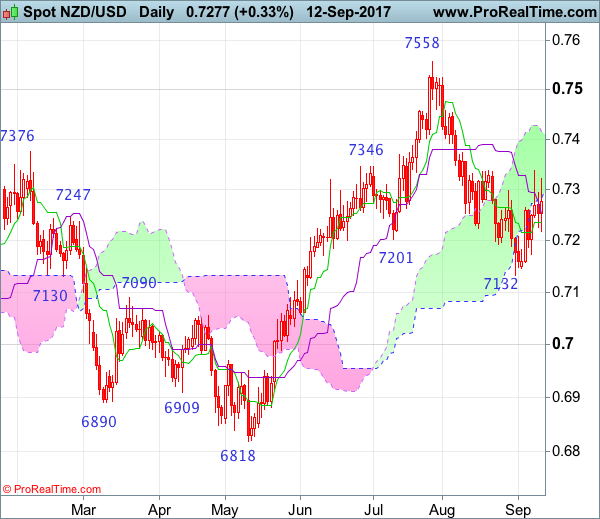
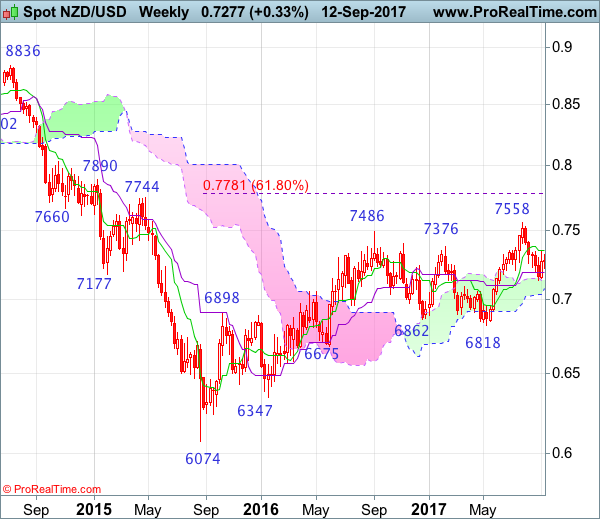
On the weekly chart, last week’s rebound formed a white candlestick, suggesting further consolidation above 0.7132 support would be seen and initial upside risk remains for recovery to 0.7395-00 (61.8% Fibonacci retracement of 0.7558-0.7132), as the sharp retreat from 0.7558 suggests top has possibly been formed there, reckon upside would be limited and bring another decline, below 0.7217 would bring retest of 0.7132 but break there is needed to retain bearishness and extend the retreat from 0.7558 for retracement of recent rise to the lower Kumo (now at 0.7077) and psychological support at 0.7000 would limit downside, kiwi shall stay above 0.6950.
On the upside, expect recovery to be limited to 0.7395-00 (61.8% Fibonacci retracement of 0.7558-0.7132) and bring another decline later. Above 0.7417 resistance would risk a stronger rebound to 0.7490-00 but still reckon said resistance at 0.7558 would limit upside and bring another retreat later. Only a break of 0.7559 would extend medium term erratic upmove from 0.6074 (2015 low) has resumed and may extend gain to 0.7690-00 (61.8% projection of 0.6074-0.7485 measuring from 0.6818) and later towards 0.7780-85 (61.8% Fibonacci retracement of 0.8836-0.6074), however, reckon upside would be limited to 0.7890 and price should falter well below resistance at 0.8035.
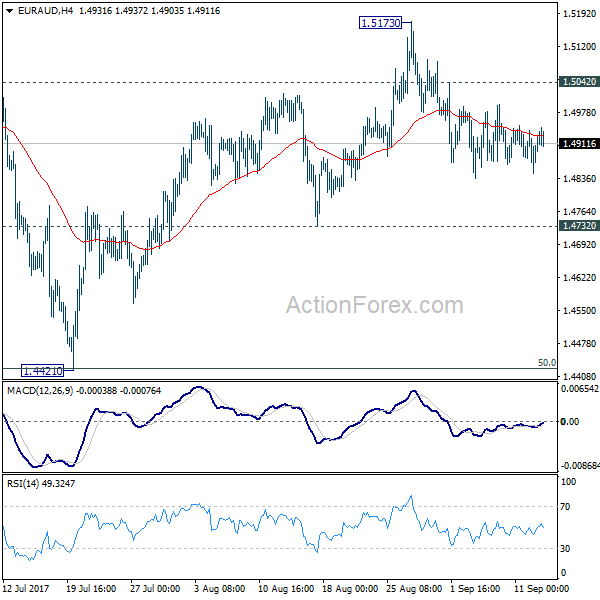
EUR/AUD Daily Outlook
Daily Pivots: (S1) 1.4863; (P) 1.4901; (R1) 1.4957; More....
Intraday bias in EUR/AUD remains neutral for the moment and outlook is unchanged. With 1.5042 minor resistance intact, deeper decline is expected to 1.4732 support. Decisive break there will confirm that fall from 1.5173 is the third leg of consolidation pattern from 1.5226. In that case, further fall should be seen to 1.4421 again. But we'd expect strong support from there to contain downside and bring rebound. On the upside, above 1.5042 minor resistance will turn bias back to the upside for 1.5173/5226 resistance zone instead.
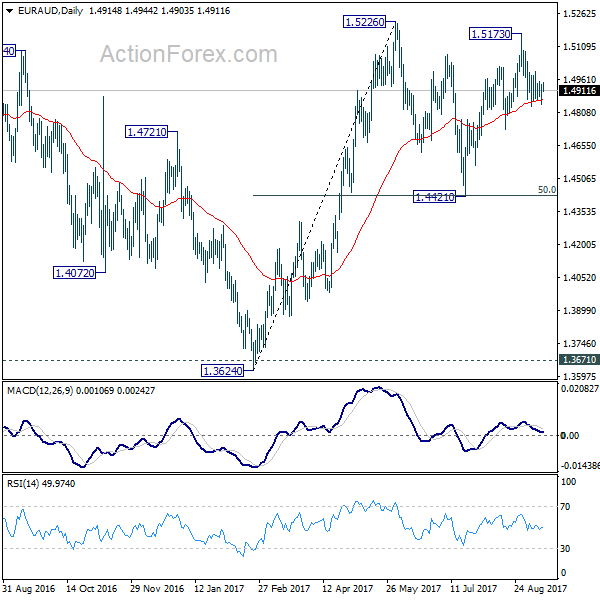
In the bigger picture, we're holding on to the view that corrective decline from 1.6587 medium term has completed at 1.3624. Rise from 1.3624 is expected to extend to retest 1.6587. The corrective structure of the price actions from 1.5226 is affirming this view. Above 1.5226 will target a test on 1.6587 key resistance. However, break of 1.4421 support will dampen our view and would drag EUR/AUD lower to retest key support zone around 1.3624.