Sample Category Title
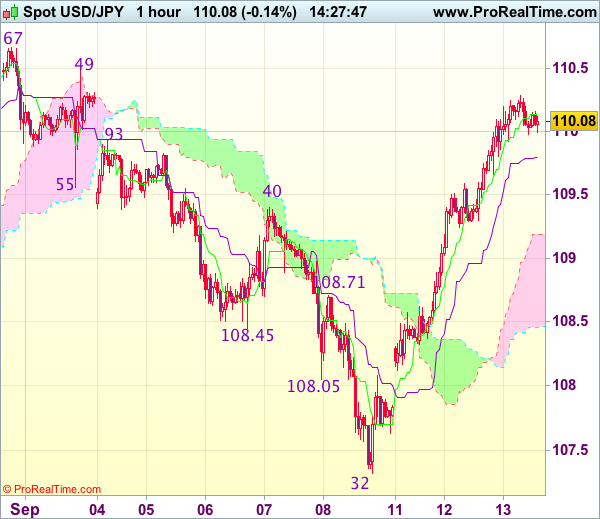
Trade Idea : USD/JPY – Buy at 109.30
USD/JPY - 110.09
Most recent candlesticks pattern : N/A
Trend : Down
Tenkan-Sen level : 110.14
Kijun-Sen level : 109.80
Ichimoku cloud top : 108.19
Ichimoku cloud bottom : 108.46
Original strategy :
Buy at 109.00, Target: 110.20, Stop: 108.65
Position : -
Target : -
Stop : -
New strategy :
Buy at 109.30, Target: 110.30, Stop: 108.95
Position : -
Target : -
Stop : -
As the greenback has maintained a firm undertone after this week’s rally, adding credence to our view that low has been formed at 107.32 last week and mild upside bias remains for the rise from there to extend further gain towards resistance at 110.49, however, near term overbought condition should limit upside to another previous resistance at 110.67 and price should falter below 111.00, risk from there has increased for a retreat to take place soon.
In view of this, would not chase this rise here and would be prudent to buy dollar on subsequent pullback as 109.25-30 should limit downside. Below 109.00 would defer and risk correction to 108.70 but still reckon downside would be limited to 108.30-35 and bring another rally later.
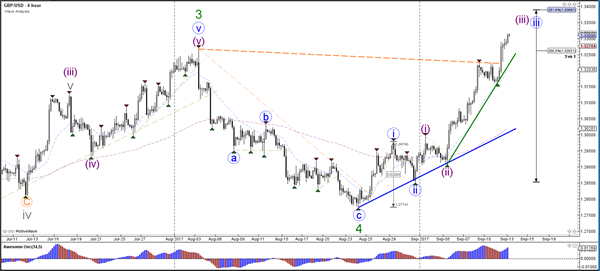
Daily Technical Analysis: GBP/USD Breaks All Resistance Levels With Wave-3 Momentum
Currency pair GBP/USD
The GBP/USD has broken above the resistance trend line (dotted orange) and previous top and is confirming its bullish momentum within waves 3 (purple and blue). A continuation of the bullish momentum seems likely even if a larger correction takes place, because that could be the wave 4 (purple) pullback.
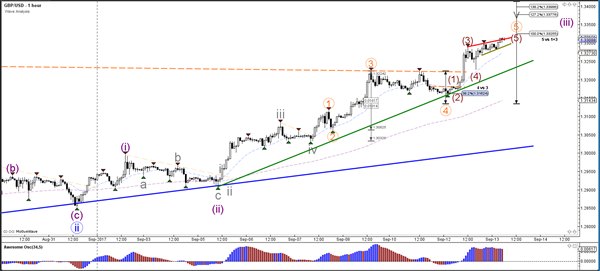
The GBP/USD is extending the bullish momentum higher and seems to be finishing waves 5 within wave 3 (purple). Eventually price could start a larger wave 4 (purple) pullback.
Currency pair EUR/USD
The EUR/USD could have completed the wave C (red) of wave 4 (blue) at the support trend line (blue) and 61.8% Fibonacci level of wave C vs A. This could be a potential bouncing spot for a continuation of wave 5 but wave C could extend lower if price breaks below the support line.
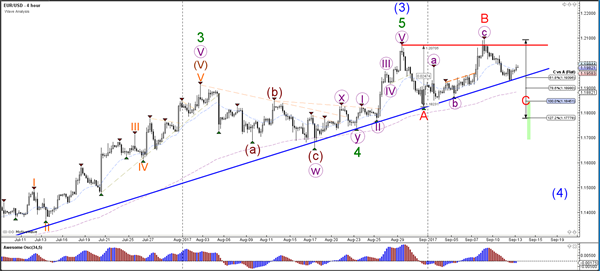
The EUR/USD seems to have completed 5 bearish waves and has broken above the resistance trend line (dotted red) which could indicate a potential bullish breakout via a wave 1-2 (purple).

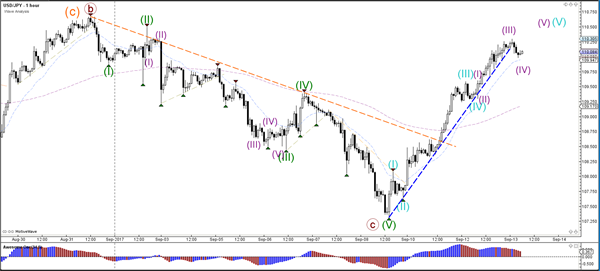
Currency pair USD/JPY
The USD/JPY bullish momentum has reached a strong resistance trend line (brown). A bearish bounce could happen here as price completes perhaps a wave 1 (brown).
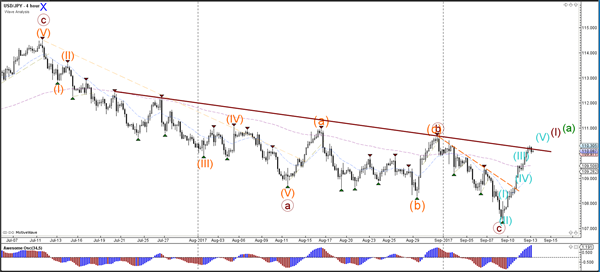
The USD/JPY is showing strong bullish momentum and seems to have built 5 waves (blue). Within wave 5 there seems to be an extension with another 5 waves (purple).
EUR/GBP Retesting Previous Daily Resistance Zone As Support
As price moves back down to retest a major zone, today’s in-play chart is EUR/GBP. But before we move onto today’s level, I want to make sure that we’re up to date with the unfolding narrative in the pair.
Each of the EUR/GBP levels that I’ve blogged about recently have all had an effect on how we got here. The way that price has stepped and reversed has been almost textbook technical behaviour and is worth a look. Go through and click each of the links to our previous EUR/GBP blogs and if you haven’t already been following along, take a look at how we got here.
First up, EUR/GBP printed a doji at resistance. As we discussed at the time, this isn’t necessarily a reversal candle, but simply indecision. But as price action unfolded, it turned out to very much be the signal that the sellers were looking for, selling each rally back into previous short term support turned resistance:
EUR/GBP Hourly:
As there weren’t any pullbacks, no matter where you were shorting the level, you really couldn’t have gone wrong… But the green lines I’ve drawn on seem to be the obvious short term support turned resistance that were sold.
So from here, price continued all the way down until settling back at the previous daily swing high resistance zone that is now conventiently looking to be turning to support:
EUR/GBP Daily:
As always in my trading, this zone is support until it is broken and therefore my bias is to be fading the level. Look for the same patterns (but inverted) as the first daily chart where in this case we’d have short term resistance being turned to support where we’d buy.
Whichever way price decides to go at this zone, this is now the EUR/GBP level that we’ll look to manage our risk around.
Market Update – Asian Session: Equities And Currencies Muted, Awaiting Notable Data Tomorrow
Asia Summary
Asian equity markets opened mixed, trading remained subdued with yields falling slightly and US dollar taking a break from its recent climb. Lithium miners in Australia, Syrah Resources, Galaxy Resources rose on the news yesterday that China could accelerate its move to non-fossil fuel burning cars. Iron ore futures on China's Dalian exchange were +2%. Crude saw little movement from the release of API data, showing a build of 6.2M.
PBOC weakened the yuan for the second consecutive day and returned to its use of 7, 14 and 28 day reverse repos. Markets look ahead to tomorrow's release of China's August industrial production and fixed asset investments and Australia's employment data. The offshore yuan overnight HIBOR was +95bps to 3.05 while the 1-week rose 66bps to 3.51%.
The kiwi fell 0.4% after a report that New Zealand National Intelligence Agency has started probe of China-born parliament member Jian Yang. Yang is in the ruling National Party; The report says the probe focuses on the time that Yang spent at military colleges in China. This could be trouble heading into elections for the ruling party.
Key economic data
(JP) JAPAN AUG PPI M/M: 0.0% V 0.1%E; Y/Y: 2.9% V 3.0%E
(JP) JAPAN Q3 BSI LARGE ALL INDUSTRY Q/Q: 5.1 V -2 PRIOR; BSI LARGE MANUFACTURING Q/Q: 9.4 V 5.0E
(AU) Australia Sept Westpac Consumer Confidence Index: 97.9 v 95.5 prior, Consumer Confidence M/M: +2.5% v -1.2% prior
Speakers and Press
China/Hong Kong
(CN) China FX Regulator SAFE: No changes to foreign currency cash withdrawal rule
(CN) President Trump has warned China to get tough on North Korea and reduce trade and financial transactions or it will target Chinese banks - FT
Korea
(KR) North Korea rejects UN adding new sanctions; to establish 'practical equilibrium' with the US; will redouble efforts to increase its strength – KCNA
(KR) Bank of Korea (BOK) Gov Lee: FX swap with China not on agenda for meeting
(KR) South Korea Nuclear Safety and Security Commission: traces of radioactive xenon gas were confirmed to be from a North Korean nuclear test earlier this month, but it was unable to conclude whether the test had been for a hydrogen bomb
Japan
(JP) Japan to start watching virtual currency exchange markets from Oct - Nikkei
Australia
(AU) RBA's Harper: Currency gains being driven by weaker USD; economic growth is too weak to justify a rate hike; AUD -0.2% on the comments before returning to +0.1%
Asian Equity Indices/Futures (00:00ET)
Nikkei +0.5%, Hang Seng -0.3%; Shanghai Composite -0.1%, ASX200 +0.2%, Kospi +0.2%
Equity Futures: S&P500 -0.1%; Nasdaq100 -0.1%, Dax -0.1%, FTSE100 -0.1%
FX ranges/Commodities/Fixed Income (00:00ET)
EUR 1.1993-1.1964; JPY 110.29-109.98; AUD 0.8039-0.8011; NZD 0.7298-0.7257
Dec Gold +0.2% at $1,335/oz; Oct Crude Oil 0.0% at $48.24/brl; Sept Copper -0.3% at $3.03/lb
GLD SPDR Gold Trust ETF daily holdings +0.4% to 838.6 metric tonnes
USD/CNY *(CN) PBOC SETS YUAN REFERENCE RATE AT: 6.5382 V 6.5277 PRIOR (2nd straight weaker yuan fix)
(CN) PBOC injects combined CNY70B in 7,14 and 28-day reverse repos v skipped prior
(AU) Australia sells A$900M in Nov 2028 bonds, avg yield 2.7414%, bid to cover 4.03x
USD/PHP Philippines Central Bank (BSP) spent PHP5B over the last 2 months defending the peso
Equities notable movers
Australia/New Zealand
SEA.AU Reports H1 (A$) Net loss 5.7M v loss 20.1M y/y; Rev 44.5M v 24.2M y/y; +5%
OIC.NZ WSP NZ raises offer to NZ$1.85/shr; Board unanimously recommends offer; +6.8%
Hong Kong/China
2020.HK UBS Raised 2020.HK to Buy from Neutral; +6.4%
066570.KR To showcase car components at German motor show; +4.6%
Japan
6502.JP Board resolved to sign MOU with Bain for chip unit; targeting final decision on board meeting next week - Nikkei; +0.3%
In The UK, The Labour Market Report For July Is due
Market movers today
In the euro area, the employment figure for Q2 is due for release on Wednesday. We estimate the improvement in the labour market continued in Q2, which has been indicated by strong PMI employment indicators throughout the quarter. Specifically, we expect employment growth of 0.4% q/q in Q2.
Today also brings data on euro area industrial production in July. We expect a small rebound in the euro area but based on the unchanged German figure in July, it should be modest. We expect the euro area figure to report 0.2% monthly growth.
In the UK, the labour market report for July is due. We expect the annual growth rate in average weekly earnings excluding bonuses (3 month average) was unchanged at 2.1% y/y but see a risk of a further decline in the unemployment rate to 4.3% from 4.4%.
Selected market news
Asian shares reached a 10-year high this morning, while the rise in USD/JPY helped boost Japanese shares. Similar record highs were reached on Wall Street yesterday, as investor concerns faded about the impact of Hurricane Irma as well as North Korean tensions, despite President Trump's demands yesterday to toughen sanctions further.
In the US, Treasury Secretary Steven Mnuchin expressed doubt on Trump's goal of cutting the corporate tax rate to 15%, citing budget issues, despite the recent deal reached on the postponement of the debt limit (see Flash Comment US: Debt limit fight postponed amid increased Fed uncertainty, 7 September). The administration is currently trying to build public support for the tax reforms, also with the Democrats. Mnuchin said he hoped that a tax plan could be enacted this year, but we still think that Republicans' will struggle to agree on tax reforms internally, as the very conservative Republicans want big tax cuts financed by big fiscal spending cuts, which more moderate Republicans cannot support. Yesterday, we also got news that Trump plans to visit China in November. We do not yet know what the topics for the visit will be, but markets will focus on trade issues and North Korea.
After Monday's inflation disappointment in Norway, yesterday's Q3 Regional Network Survey was also weaker than expected, with the aggregated output index falling to 1.11 from 1.29. With low inflation, strong NOK versus Norges Bank's forecast, a cooling housing market and lower global rates, Norges Bank could easily extend the on-hold stance at its meeting next week in our view.
In France, around 223,000 protesters marched yesterday against the government's new labour reform unveiled on 31 August. The reform included a cap on payouts for unfair dismissals and greater flexibility for companies to negotiate pay and hours. Labour unions have scuppered previous efforts to weaken France's labour code, but this time there was comfort for Macron as two other unions, including the largest CFDT, declined to join the protests. Macron is determined to move on with his reforms despite a rapid decline in approval ratings (36% in August), with a reform of the unemployment benefit scheme in 2018 next on his agenda.
USD/CAD Daily Outlook
Daily Pivots: (S1) 1.2114; (P) 1.2152; (R1) 1.2222; More....
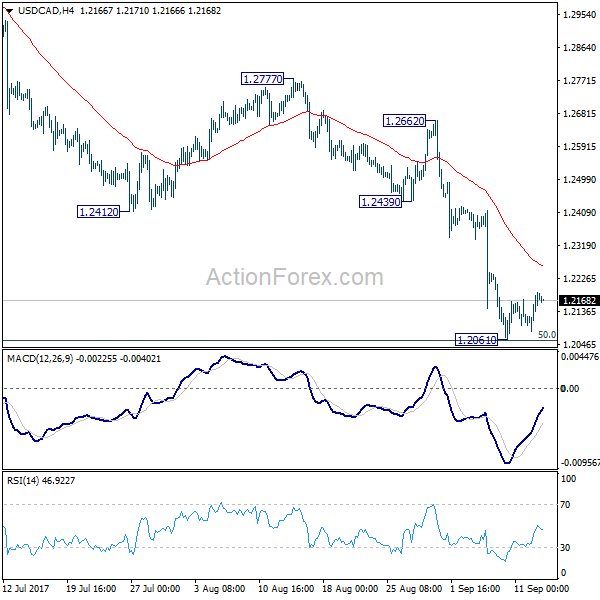
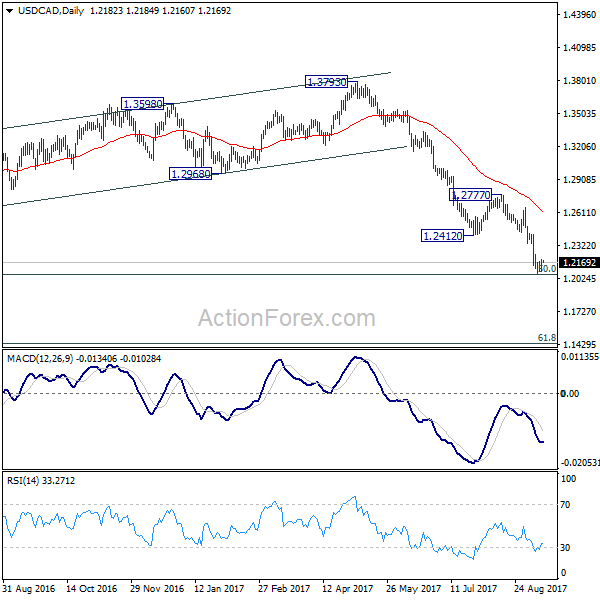
Intraday bias in USD/CAD remains neutral as consolidation from 1.2061 temporary low continues. We'll stay cautious on strong support from 1.2048 long term fibonacci level to bring sustainable rebound. But still, break of 1.2412 support turned resistance is needed to be the first sign of trend reversal. Otherwise, outlook will remain bearish. Firm break of 1.2048 will pave the way to next fibonacci level at 1.1424.
In the bigger picture, current downside acceleration is raising the chance that whole long term rise from 0.9406 (2011 low), and that from 0.9056 (2007 low) is completed at 1.4689. Focus is now on 50% retracement of 0.9406 to 1.4869 at 1.2048. As long as this level holds, we'd still favor that case that fall from 1.4689 is a correction. However, firm break of 1.2048 will indicate that fall fro 1.4689 is at least a medium term down trend and should target 61.8% retracement at 1.1424 and below.
Elliott Wave View: DXY Dollar Index Turning Lower
DXY Dollar Index Short Term Elliott Wave view suggests that the decline from 8/16 peak is unfolding as an Ending Diagonal Elliott Wave structure. Down from 8/16 high, Minor wave 1 ended at 91.62 and Minor wave 2 ended at 93.347. Minor wave 3 is unfolding as a double three Elliottwave structure. Minute wave ((w)) of 3 ended at 91.01 and Minute wave ((x)) of 3 is proposed complete at 92.08. While bounces stay below 92.08, but more importantly below 8/31 high at 93.36, Index should resume lower or at least pullback in 3 waves. If the Index breaks above 92.08, then cycle from 8/16 high has likely ended. In that case, Index should correct larger degree cycle from 8/16 high in 7 swing before the decline resumes provided pivot at 92.08 stays intact. We don’t like buying the Dollar Index.
DXY 1 Hour Elliott Wave Chart
Ending Diagonal is an Elliott wave structure that typically happens inside wave 5 of an impulse or inside wave C of a zigzag. Ending Diagonal has 5 waves subdivision and each wave is further subdivided into 3 waves. Thus Ending Diagonal has the structure of 3-3-3-3-3. When Ending Diagonal happens within wave 5, the internal wave 1 of 5 and wave 4 of 5 can overlap. The Ending diagonal also often forms a wedge shape.
North Korea Pledged to “Redouble Effort”, Markets Ignored With Strong Risk Appetite
Risk appetite remains strong in the markets. And the provocative response from North Korea on fresh sanctions is largely ignored. S&P 500 closed up 8.37 pts, or 0.34%, at 2496.48 overnight, making another record high. DOW also rose 61.49 pts, or 0.28%, to close at 2118.86, a record, even though it's short of intraday record at 22179.11. NASDAQ also scored a record close at 6454.28, up 0.34%. Sentiments are also positive in Asia with Nikkei trading up 0.5% at the time of writing. Gold continues to suffer as it struggles to regain 1340 handle. In the currency markets, British Pound remains the strongest one for the week as boosted by the CPI release yesterday. Commodity currencies are also firm together with Dollar. Meanwhile, Yen, Swiss Franc and Euro are trading as the weakest ones for the week.
North Korea pledged to "redouble effort"
North Korea has just issued an official response to the fresh sanctions approved by United Nations Security Council earlier this week. The foreign ministry condemned the sanctions as "another illegal and evil" one as "piloted by the US. It said in a statement that it aimed at "completely suffocating its state and people through full-scale economic blockade". And it "served as an occasion for the DPRK to verify that the road it chose to go down was absolutely right." North Korea pledged to "redouble the efforts to increase its strength to safeguard the country's sovereignty and right to existence." The country's ambassador to the UN, Han Tae Song, also said yesterday that the country is "ready to use a form of ultimate means". And, "the forthcoming measures ... will make the U.S. suffer the greatest pain it ever experienced in its history."
Trump criticized US proposed sanctions as "not a big deal"
On the other hand, US President Donald Trump criticized the sanctions that his own country has tabled to UNSC. He said "it's just another very small step, not a big deal." And Trump added that "I don't know if it has any impact, but certainly it was nice to get a 15-to-nothing vote, but those sanctions are nothing compared to what ultimately will have to happen." Treasury Secretary Steven Mnuchin warned that if China doesn't follow through on the sanctions on Korea, the US would "put additional sanctions on them and prevent them from accessing the U.S. and international dollar system."
Brexit negotiations delayed for a week to Sep 25
The next round of Brexit negotiation between EU and UK is originally scheduled for next week, starting September 18. But it's now be postponed by a week to September 25 to "allow more time for consultation". In a statement, UK said that "both sides settled on the date after discussions between senior officials in recognition that more time for consultation would give negotiators the flexibility to make progress in the September round." The decision came just a week after European Parliament's chief Brexit negotiator Guy Verhofstadt said UK Prime Minister Theresa May was preparing to make an "important intervention... in the coming days".
Sterling holding on to post CPI gains
Sterling is holding on to the post CPI gains and remains the strongest currency for the week. Recapping yesterday's release, headline CPI accelerated to 2.9% yoy in August, up from 2.6% yoy, and beat expectation of 2.8% yoy. That's also the highest level in a year. With re-acceleration in headline CPI, there is very little chance that hawks Michael Saunders and Ian McCafferty would change their mind. Both are very likely to continue to vote for a 25bps hike. And there is chance that chief economist Andy Haldane would finally put his hawkish words into vote. But after all, the hawks are still short of two votes to push through a hike. Still, its likely that BoE will step up its warning on rate hike, in particular the pace of the path in coming years.
German Merkel maintain wide lead in election
In Germany, Chancellor Angle Merkel's Christian Democratic Union (CDU) is maintaining solid lead over rival Social Democrats (SPD). According to the latest weekly poll by Insa, CDU is having 36.5% support while SPD is having 23.5%. Most critics consider the race for the next Chancellor over with the solid lead. The question is whether CDU and its natural coalition partner Free Democrats (FDP) are able to secure a majority. Meanwhile, it's reported that Merkel will very likely keep "Wolfgang Schaeuble" as Finance Minister after winning the election.
Japan PMI Abe offer no hint on who's the next BoJ head
In Japan, Prime Minister Shinzo Abe declined to comment on who would succeed BoJ Governor Haruhiko Kuroda after his five year terms ends in April next year. And, Abe didn't comment on whether Kuroda's term would be renewed. But he hailed that Kuroda's massive monetary stimulus has boosted employment and "created a situation where Japan was no longer in deflation." Abe emphasized that it's important to hit the 2% target and "stabilizes at that level". And, "the government expects the BOJ to continue efforts to meet the target." Meanwhile, Abe said he's still on track to raise sales tax from 8% to 10% in October 2019.
On the data front
Japan BSI large manufacturing rose to 9.4 in Q3, domestic CGPI rose 0.0% in August. Australia Westpac consumer sentiment rose 2.5% in September. German CPI final, Swiss PPI, Eurozone industrial production and employment will be released in European session. But UK data will be the focus again with employment data featured. US will release PPI later in the day.
USD/CAD Daily Outlook
Daily Pivots: (S1) 1.2114; (P) 1.2152; (R1) 1.2222; More....
Intraday bias in USD/CAD remains neutral as consolidation from 1.2061 temporary low continues. We'll stay cautious on strong support from 1.2048 long term fibonacci level to bring sustainable rebound. But still, break of 1.2412 support turned resistance is needed to be the first sign of trend reversal. Otherwise, outlook will remain bearish. Firm break of 1.2048 will pave the way to next fibonacci level at 1.1424.
In the bigger picture, current downside acceleration is raising the chance that whole long term rise from 0.9406 (2011 low), and that from 0.9056 (2007 low) is completed at 1.4689. Focus is now on 50% retracement of 0.9406 to 1.4869 at 1.2048. As long as this level holds, we'd still favor that case that fall from 1.4689 is a correction. However, firm break of 1.2048 will indicate that fall fro 1.4689 is at least a medium term down trend and should target 61.8% retracement at 1.1424 and below.
Economic Indicators Update
| GMT | Ccy | Events | Actual | Forecast | Previous | Revised |
|---|---|---|---|---|---|---|
| 23:50 | JPY | BSI Large Manufacturing Q/Q Q3 | 9.4 | -2.8 | -2.9 | |
| 23:50 | JPY | Domestic CGPI M/M Aug | 0.00% | 0.10% | 0.30% | |
| 0:30 | AUD | Westpac Consumer Confidence Sep | 2.50% | -1.20% | ||
| 6:00 | EUR | German CPI M/M Aug F | 0.10% | 0.10% | ||
| 6:00 | EUR | German CPI Y/Y Aug F | 1.80% | 1.80% | ||
| 7:15 | CHF | Producer & Import Prices M/M Aug | 0.20% | 0.00% | ||
| 7:15 | CHF | Producer & Import Prices Y/Y Aug | 0.40% | -0.10% | ||
| 8:30 | GBP | Jobless Claims Change Aug | 0.6K | -4.2K | ||
| 8:30 | GBP | Claimant Count Rate Aug | 2.30% | |||
| 8:30 | GBP | ILO Unemployment Rate 3M Jul | 4.40% | 4.40% | ||
| 8:30 | GBP | Average Weekly Earnings 3M/Y Jul | 2.30% | 2.10% | ||
| 9:00 | EUR | Eurozone Industrial Production M/M Jul | 0.10% | -0.60% | ||
| 7:00 | EUR | Eurozone Employment Q/Q Q2 | 0.30% | 0.40% | ||
| 12:30 | USD | PPI M/M Aug | 0.30% | -0.10% | ||
| 12:30 | USD | PPI Y/Y Aug | 2.50% | 1.90% | ||
| 12:30 | USD | PPI Core M/M Aug | 0.20% | -0.10% | ||
| 12:30 | USD | PPI Core Y/Y Aug | 2.10% | 1.80% | ||
| 14:30 | USD | Crude Oil Inventories | 4.6M | |||
| 18:00 | USD | Monthly Budget Statement Aug | -124.3B | -42.9B |
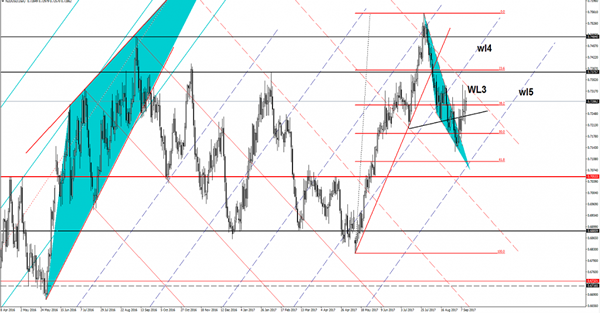
NZD/USD Losing Momentum
NZD/USD is trading in the green right now, but seems undecided after the failure to reach and retest the third warning line (WL3) of the descending pitchfork. Technically is still expected to approach and reach the WL3, but only a valid breakout will confirm a further increase in the upcoming period towards the 0.7375 level.
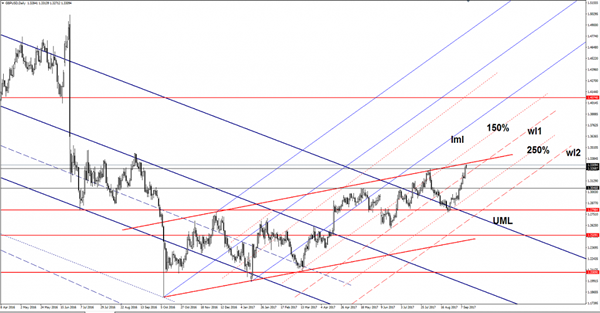
GBP/USD Breakout?
Price is trading in the green and is almost to reach the upside line of the up channel. Technically a breakout is favored, but we have to wait for a valid one before we take action. The Cable could receive support from the UK’s data once again, the Average Earnings Index, Claimant Count Change and the Unemployment Rate will be released later.
GBP/USD is trading right above the 1.3300 psychological level and above the 1.3268 broken horizontal resistance, a minor consolidation will attract more buyers.