
Sample Category Title
Daily Technical Outlook And Review: EUR/USD, GBP/USD, AUD/USD, USD/JPY, USD/CAD, USD/CHF, DOW 30, GOLD
A note on lower timeframe confirming price action...
Waiting for lower timeframe confirmation is our main tool to confirm strength within higher timeframe zones, and has really been the key to our trading success. It takes a little time to understand the subtle nuances, however, as each trade is never the same, but once you master the rhythm so to speak, you will be saved from countless unnecessary losing trades. The following is a list of what we look for:
- A break/retest of supply or demand dependent on which way you're trading.
- A trendline break/retest.
- Buying/selling tails ... essentially we look for a cluster of very obvious spikes off of lower timeframe support and resistance levels within the higher timeframe zone.
- Candlestick patterns. We tend to only stick with pin bars and engulfing bars as these have proven to be the most effective.
We typically search for lower-timeframe confirmation between the M15 and H1 timeframes, since most of our higher-timeframe areas begin with the H4. Stops are usually placed 1-3 pips beyond confirming structures.
EUR/USD
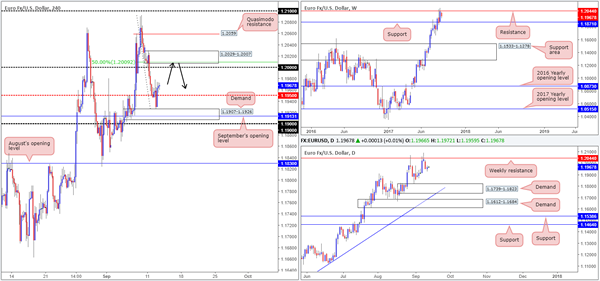
Following a breakdown through the H4 mid-level support at 1.1950, the single currency lost steam on Tuesday as price managed to find a fresh pocket of bids just ahead of H4 demand at 1.1907-1.1926. This saw the unit springboard itself back above 1.1950 to a high of 1.1973 on the day.
Looking at the weekly chart, we can clearly see that since the beginning of 2017 the EUR has been trading with a reasonably strong bias to the upside. Over the past few weeks, nevertheless, the pair finds itself tackling a resistance level pegged at 1.2044. Seeing as how weekly movement over on the USDX chart (see above) is also seen trading nearby a resistance at 11854, this may eventually translate into a dollar selloff and a bid EUR. Still, should the unit continue to decline from current price, the next support target in the firing range can be seen at 1.1871, followed closely by daily demand plotted at 1.1739-1.1823.
Suggestions: Although H4 price looks poised to extend north to shake hands with the key 1.20 level, we are wary of buying at this time given weekly selling from resistance at 1.2044. Instead, we have our beady little eye on the 1.20 region for shorts. Yes, this would mean selling against the grain, but seeing that we have a H4 supply lodged just above 1.20 at 1.2029-1.2007, coupled with a 50.0% retracement value at 1.2009 drawn from the high 1.2092, this is a relatively high-probability trade, in our humble opinion.
A pending order has been set at 1.2005, with a stop-loss order positioned at 1.2031 (will only be removed in the event of a high-impacting news event). The first area of concern, should the trade move into favor, is 1.1950, shadowed closely by the aforesaid H4 demand.
Data points to consider: US PPI data m/m at 1.30pm GMT+1.
Levels to watch/live orders:
- Buys: Flat (stop loss: N/A).
- Sells: 1.2005 ([pending order] stop loss: 1.2031).
GBP/USD
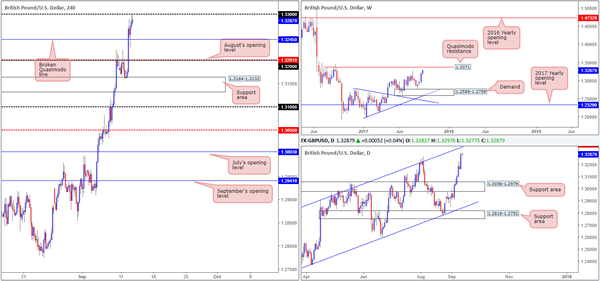
UK inflation data came in hotter than expected on Tuesday, sparking another wave of buying. Price ran through offers at the H4 Quasimodo resistance level plotted from 1.3245, and ended the day extending to a high of 1.3299. With the 1.33 handle lurking within touching distance at the moment, could this number be enough to halt further buying today? Through the lens of a simple technical trader, this is very unlikely. Why? Well, over on the daily timeframe, we have a reasonably clear run north up to a channel resistance extended from the high 1.2903. Furthermore, a little higher up on the curve, weekly price appears poised to challenge a Quasimodo resistance at 1.3371.
Basically, there is little overhead resistance seen on the bigger picture right now.
Suggestions: With both weekly and daily price showing promise to the upside, taking a short on the basis of a round number on the H4 scale would not be something we’d label high probability.
Apart from the option of selling from 1.3371, one could, however, also look to buy up to this region AFTER a H4 close has been seen beyond 1.33. A retest of this number as support, followed up with a reasonably sized H4 bull candle, preferably in the shape of a full, or near-full-bodied candle, would be ideal.
Selling from 1.3371 on the other hand, given that it is a weekly level that converges with a daily channel resistance, would not require additional confirmation, in our view. Simply set a pending sell order at 1.3371, with a stop plotted above the Quasimodo apex high at 1.3447. Yes, it is a rather large stop, but let’s remember at that point we would be dealing with higher-timeframe structures and therefore targeting higher-timeframe structures.
Data points to consider: UK Employment figures at 9.30am. US PPI data m/m at 1.30pm GMT+1.
Levels to watch/live orders:
- Buys: Watch for price to engulf 1.33 and then look to trade any retest seen thereafter ([waiting for a H4 bull candle to form following the retest is advised] stop loss: ideally beyond the candle’s tail).
- Sells: Flat (stop loss: N/A).
AUD/USD
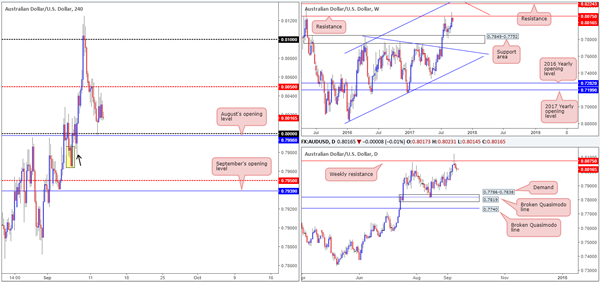
For those who read Tuesday’s report you may recall that the desk took a short position at 0.8038 and placed a stop at 0.8060 (22 pips). This was a simple setup that allowed us to take partial profits at the key 0.80 level (38 pips), before price reversed and took out our breakeven stop. Well done to any of our readers who also benefitted from this intraday move.
Going forward, we can see that despite H4 price bouncing from 0.80, the commodity currency ended the segment printing another loss. This, in our book, is likely due to weekly price trading from resistance at 0.8075, which shows room to extend as far down as the support area pegged at 0.7849-0.7752.
Suggestions: In light of the weekly picture, 0.80 may come under attack again today. Only this time it may end with price sawing its way through this level and heading down to the H4 mid-level point at 0.7950, shadowed closely by September’s opening line at 0.7939. Why we believe H4 price could trade as low as the 0.7940 neighborhood is simply because there’s a high probability that H4 demand painted in yellow at 0.7965-0.7988 has already had its orders taken by the H4 tail seen marked with a black arrow at 0.7974.
Therefore, a decisive close below 0.80, coupled with a retest as resistance would, in our technical opinion, be sufficient enough to warrant an intraday short, targeting the 0.7950/40 neighborhood.
Data points to consider: US PPI data m/m at 1.30pm GMT+1.
Levels to watch/live orders:
- Buys: Flat (stop loss: N/A).
- Sells: Watch for H4 price to engulf 0.80 and then look to trade any retest seen thereafter ([waiting for a H4 bearish candle to form following the retest – preferably in the shape of a full, or near full-bodied candle – is advised] stop loss: ideally beyond the candle’s wick).
USD/JPY
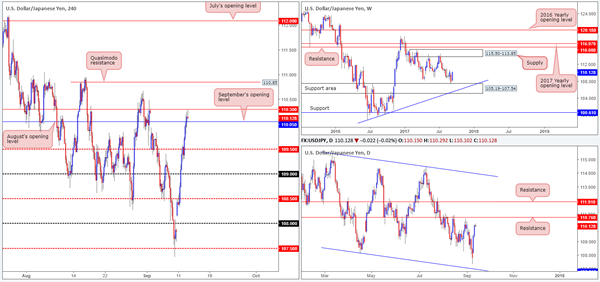
The USD/JPY, alongside US equities, continued to print recovery candles on Tuesday. This, according to our weekly drawings, should not really come as much of a surprise since the pair recently clashed with a support area penciled in at 105.19-107.54. In spite of this, the recent bull run may be tested today as daily price approaches a key resistance level sited at 110.76.
As you can see on the H4 timeframe, price concluded the session engulfing September’s opening line at 110.05 and challenged August’s opening level at 110.30, which, for now, is holding ground. Despite this, we are not keen sellers here. Both weekly and daily price show room to extend up to at least the 110.76 neighborhood, and also we have to take into account that directly below current price there sits September’s opening line which may very well act as support now.
Suggestions: Watch the H4 Quasimodo resistance at 110.85 for a potential sell trade. We like this level because it sits just above daily resistance at 110.76. However, in view of weekly bulls trading from a support area, additional candle confirmation would be required before a trade can be initiated from here. Should this trade come to realization, however, we would likely be looking to trail the position down to 110.30 as an initial take-profit zone.
Data points to consider: US PPI data m/m at 1.30pm GMT+1.
Levels to watch/live orders:
- Buys: Flat (stop loss: N/A).
- Sells: 110.85 region ([waiting for a H4 bearish candle to form – preferably in the shape of a full, or near full-bodied candle – is advised] stop loss: ideally beyond the candle’s wick).
USD/CAD
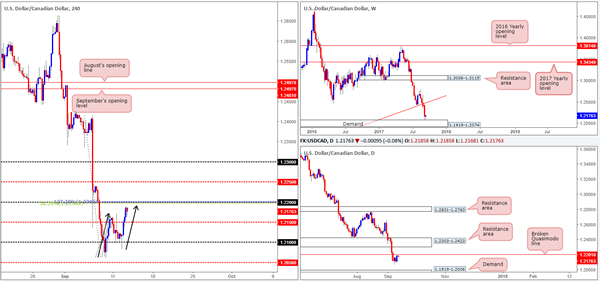
In recent activity, the US dollar pressed higher against its Canadian counterpart. Offers at the H4 mid-level resistance 1.2150 were consumed, allowing the unit to tap a high of 1.2189 into the closing bell. The important thing to consider here, however, is the H4 AB=CD bearish formation topping at 1.22 (H4 Fib ext. point at 127.2%), which boasts a H4 38.2% Fib resistance also at 1.22. This – coupled with a daily broken Quasimodo line at 1.2201, makes 1.22 a very interesting sell zone.
The only grumble we see is the fact that weekly price recently connected with demand printed at 1.1919-1.2074. While this is obviously a concern and could potentially damage a 1.22 sell, we remain biased to the downside due to the pair’s strong downtrend in play since May. In addition to this, we have a nearby weekly resistance plotted on the USDX weekly chart at 11854, which could help in pushing the dollar lower.
Suggestions: Despite weekly demand in play, we are going to sell 1.22 with a stop planted 20 pips above at 1.2220. Should this come to fruition before our EUR pending sell is triggered at 1.2005, we will cancel this order and focus on the CAD. The first area of interest, should the trade move into favor, is 1.2150.
Data points to consider: US PPI data m/m at 1.30pm. US Crude oil inventories at 3.30pm GMT+1.
Levels to watch/live orders:
- Buys: Flat (stop loss: N/A).
- Sells: 1.22 (stop loss: 1.2220).
USD/CHF
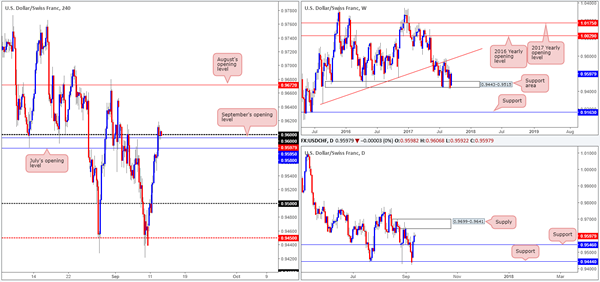
Another strong session for the USD/CHF yesterday dragged H4 price above both July and September’s opening levels at 0.9580/0.9595, as well as the 0.95 handle. Shortly after this, as you can see, the candles made a play to retest 0.96/0.9595 as support. Providing that the buyers create a floor here, the previous weekend gap will likely be filled with the possibility of price testing August’s opening level coming in at 0.9672.
From the weekly timeframe, bulls continue to reflect a bullish stance from the support area drawn in at 0.9443-0.9515. With daily resistance at 0.9546 (now acting support) out of the picture, traders likely have the daily supply at 0.9699-0.9641 in their crosshairs.
Suggestions: Traders who only focus on the H4 timeframe and below have very likely missed the nearing daily supply. So, while a long may look attractive according to the H4 scale, it is potentially quite dangerous from a daily perspective, since you really only have 40 pips (probably less once you factor in confirmation) of room to play with before possible sellers enter the equation.
Although longs could possibly work out beautifully from 0.95, our team has opted to remain on bench today and will look to reassess structure going into tomorrow’s open.
Data points to consider: US PPI data m/m at 1.30pm. CHF PPI m/m at 8.15am GMT+1.
Levels to watch/live orders:
- Buys: Flat (stop loss: N/A).
- Sells: Flat (stop loss: N/A).
DOW 30
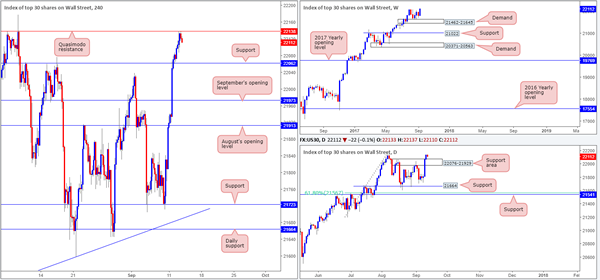
US equities extended Monday’s advance yesterday, sealing a concrete break above daily supply at 22076-21929. What this recent push higher also accomplished was bringing the H4 candles up to a Quasimodo resistance linked at 22138. This, if you ask us, is the last remaining barrier of resistance stopping the index from achieving fresh record highs. Before the bulls muster enough strength to run through this area though, it is likely that a retest of the recently broken daily supply (now acting support area) will be seen (H4 support at 22062 also seen within).
Suggestions: Keeping it Simple Simon today, we see two possible scenarios on offer:
In the event that H4 price closes above the current Quasimodo resistance, a retest of this level as support is a high-probability long trade given the lack of overhead higher-timeframe resistance in view.
A selloff from the current Quasimodo resistance will, as mentioned above, likely end with price retesting the daily support area registered at 22076-21929. Should H4 candle action tap the support level at 22062 today and hold ground (preferably printing a full, or near-full-bodied candle), then this, in our opinion, is also another strong signal to buy, targeting 22138 as an initial take-profit level.
Data points to consider: US PPI data m/m at 1.30pm GMT+1.
Levels to watch/live orders:
- Buys: Watch for H4 price to engulf 22138 and then look to trade any retest seen thereafter ([waiting for a H4 bullish candle to form following the retest – preferably in the shape of a full, or near full-bodied candle – is advised] stop loss: ideally beyond the candle’s tail). 22062 region ([waiting for a reasonably sized H4 bullish candle to form – preferably a full, or near-full-bodied candle – is advised] stop loss: ideally beyond the candle’s tail).
- Sells: Flat (stop loss: N/A).
GOLD
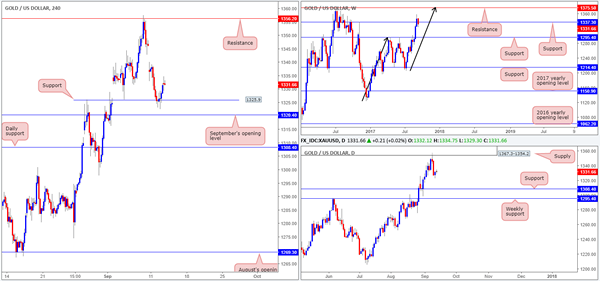
After a few earnest attempts from the sellers to push below H4 support at 1325.9 on Tuesday, the bulls finally took the wheel going into the US open and pushed north. Although price advanced to a high of 1332.1, it’s very difficult to judge how strong the buyers really are at the moment! We say this for few reasons. First, weekly price recently edged its way through support at 1337.3. Secondly, daily price shows room to stretch as far south as support lurking at 1308.4. This gives the pair a somewhat bearish tone. Bolstering the yellow metal from here, however, is weekly price on the USDX chart seen nearing resistance at 11854. As highlighted in Tuesday’s report, a dollar move up to this weekly level could see the dollar collapse and therefore push the yellow metal higher!
Suggestions: Right now, we’re not keen on this market since we clearly have conflicting signals in play right now, and feel it’s best to remain on the sidelines.
Levels to watch/live orders:
- Buys: Flat (stop loss: N/A).
- Sells: Flat (stop loss: N/A).
Daily Technical Analysis: EURUSD, GBPUSD, USDJPY, USDCHF
EURUSD
The EURUSD was indecisive yesterday. The bias is neutral in nearest term. Immediate support is seen around 1.1925. A clear break and daily close below that area could trigger further bearish pressure testing 1.1823 key support. Immediate resistance is seen around 1.2030. A clear break and daily close above that area could trigger further bullish pressure testing 1.2100 – 1.2175 region. Overall I remain bullish and any downside pullback should be seen as a good opportunity to buy.
GBPUSD
The GBPUSD had a bullish momentum yesterday close above 1.3265 key resistance. This fact activates my bullish mode. The bias is bullish in nearest term testing 1.3400 region. Immediate support is seen around 1.3265 followed by 1.3220. A clear break and daily close back below 1.3220 would reactivate my neutral mode as direction would become unclear. On the upside, a clear break and daily close above 1.3400 would expose 1.3500 region.
USDJPY
The USDJPY continued its bullish momentum yesterday topped at 110.25 and hit 110.29 earlier today in Asian session. The bias remains bullish in nearest term but as long as stay below 111.00 key resistance the H4 chart bias should remain bearish. Immediate support is seen around 109.85/50. A clear break below that area could lead price to neutral zone in nearest term testing 109.00 support area. On the upside, a clear break and daily close above 111.00 would change the H4 chart bias to a neutral condition. Overall I remain neutral.
USDCHF
The USDCHF continued its bullish momentum yesterday topped at 0.9618. The bias remains bullish in nearest term testing 0.9650 – 0.9700 area. Immediate support is seen around 0.9550/25 region. A clear break below that area could lead price to neutral zone in nearest term retesting 0.9450 key support which remains a good place to buy with a tight stop loss as a clear break below that area would reactivate my bearish mode targeting 0.9250 region.
Market Morning Briefing: Decent Bounce From 1.1925 On The Euro
STOCKS
Major indices looks bullish with strong upward momentum just now.
Dow (22118.86, +0.28%) looks bullish for the coming sessions towards 22400 where a slight pause could be seen. Interim resistance is visible at 22000 but if the upside momentum is strong, it could break on the upside this week itself.
Dax (12524.77, +0.40%) is clearly headed towards 12750-13000 in the coming sessions. While the upside momentum looks strong just now, the upward rally is likely to continue in the near term.
Nikkei (19869.82, +0.47%) is headed towards 20000, its immediate resistance above current levels. A break above 20000 if seen in the near term could take it higher towards 20200 over the medium term. Near to medium term looks bullish.
Shanghai (3373.44, -0.18%) seems to be trapped in the 3400-3350 region, 3400 being an important resistance. While below 3400, we may look for a slight corrective dip in the near term. But if the index continues to trade sideways, it could possibly be a base building for a sharp surge in the near term.
Nifty (10093.05, +0.87%) could re-test 10150, the previous high seen on 1st Aug’17. If 10150 hold, we could see a corrective fall towards 10000 or lower again; else a rise past 10150 could turn bullish for the coming sessions.
COMMODITIES
Gold (1336) moved higher and trading within the range of 1327-1363.We will remain on the buying side while it is trading above 1325-27 regions. Only a close below 1325 could open up 1303 levels. Silver (17.93) was almost unchanged and trading within the range of 17.40-18.05.Only a close above 18.05 could open up higher resistances of 18.17 and 18.50 respectively.
Copper (3.03) has also come down in line with our expectation and trading within the range of 3.00-3.16 and a daily close below 3.00 could open up 2.90 levels as well.
No directional move had been seen in Brent (54.16) as it is hovering around the pivot of its near term trading range of 53.30-55.60.Only a close below 53.30 could open up 51 regions, otherwise it might move up towards 55. WTI (48.26) is also trading within its narrow range of 47.22-50-48.70. Only above 48.70, the higher resistance of 50.20 can come into consideration. Today we have U.S. crude oil inventory data at 8.00 pm with an expectation of a surplus of 4.1MB.
FOREX
Decent bounce from 1.1925 on the Euro (1.1980), just above our Support level of 1.1900. Look for a slow rise towards 1.2050 over the next few days.
Dollar-Yen (110.05) rose to 110.29 contrary to the expectation of stalling between 109-110. If it breaks above immediate Resistance at 110.50 now, it may well see 111+. If so, the Euro-Yen (131.85) which has also moved up sharply to test our target of 132, might break above the near-term Resistance at 132.25-50. Failure to break above 110.50 in Dollar-Yen could lead to consolidation between 110.50 and 109.50.
As it turns out, the Pound (1.3310) was able to break above 1.3270 convincingly and may test 1.3400-20 in another few days. Note, however, that the 1.34-45 region is a good long-term Resistance zone and may therefore run into good selling there.
The Aussie (0.8032) saw only a minor dip to 0.7996 yesterday, well above our Support at 0.7965. Look for further rise to 0.8070 in a few days. Our target 0.82 is still valid, but may take a couple of weeks to achieve.
Dollar-Yuan (USDCNY = 6.5286) has dipped a bit after testing 6.55. Need to see if it will start moving up again today towards our target of 6.5750.
Dollar-Rupee trades near 64.00, slambang in the middle of the 63.80-64.20 range. Dollar Index (91.80) may still move up towards 92.25 over the next few days.
INTEREST RATES
The benchmark US 10Yr yield (2.16%) moved higher and trading close to its immediate resistance of 2.16-18% regions. Only a close above that could open up much higher level of 2.22-25%.
EUR/USD was almost unchanged as the German-US 2 Yr Spread (-2.08%) and the German-US 10Yr Spread (-1.76%) moved lower.
The Japanese yields has rebound after hovering around their respective areas of supports. The Japan 10Yr yield shoot up at 0.02% levels along with the 30Yr (0.82%) and the 5Yr (-0.12%) respectively.
UK Gilts yields also moved higher as UK 5Yr and 20Yr Gilt Yields (5Yr 0.47% and 20Yr 1.58%) are up by 2-3 pips. The UK 10Yr (1.04%)is also moved higher with an immediate resistance poised at 1.07% regions.
GBP/JPY Heading Towards Major Resistance
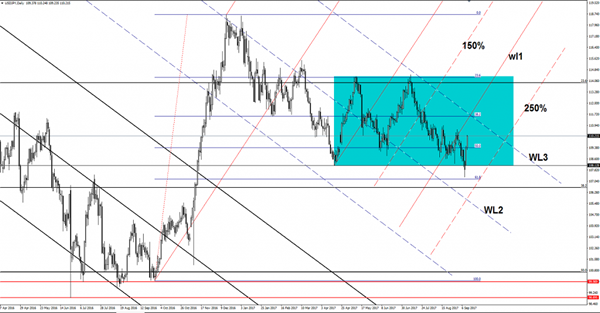
GBP/JPY rallies and approaches next upside targets. Price increased more than 250 pips today as the Cable received a helping hand from the UK’s inflation data. The figures have come in better than expected and have boosted the price. Price is approaching the red line, where he could find temporary resistance again. Could be attracted also by the 150% Fibonacci line (ascending dotted line).
Brent Oil Breakout Needs Confirmation
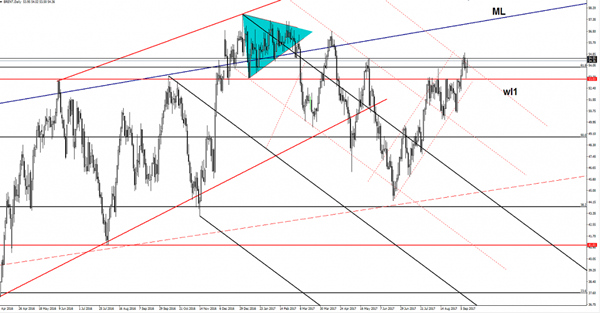
The Brent remains bullish and tries once again to take out the dynamic resistance from the warning line (wl1). Is trading in the green after the failure to retest the 53.03 static support (resistance turned into support). Price is approaching the 54.55 horizontal resistance, where he could find temporary resistance again.
A valid breakout above the warning line (wl1) will confirm a further increase towards the $57 per barrel.
USD/JPY Edges Higher
Price goes higher very fast as the Yen is punished by the Nikkei’s amazing rally. USD/JPY resumed the yesterday’s immense bullish candle and approaches the 110.66 previous high. The pair rallied even if the dollar index has failed to stay above the 92.00 yesterday’s high.
The USDX increased as much as 92.09 today, but now is trading below the 91.92 static resistance (support turned into resistance). USDX rebounded because it was too oversold to drop much deeper on the short term, only an accumulation will signal a potential broader rebound.
The Yen is into a corrective phase on the short term as the JP225 index seems unstoppable on the short term. The index has ignored the 19700 horizontal resistance and is heading towards the 20058 static resistance, where he could find resistance again.
A further increase will send the Yen into agony, right now only the fundamental factors could turn it to the downside again.
Price moves in range on the daily chart and most likely will continue this extended sideways movement in the upcoming period. USD/JPY rallies after the false breakdown below the 108.12 level and after the failure to reach the 61.8% retracement level. Resistance can be found higher at the third warning line (WL3) of the major descending pitchfork, at the 38.2% retracement level and at the warning line (wl1) of the ascending pitchfork.
It’s hard to believe that we’ll have a sharp rally that will reach the confluence area formed between the mentioned resistance levels.

Uncertainty Reigns
Uncertainty Reigns
The uptick in rising US yields is underpinning USDJPY, but it was the gains in equities as all three major U.S. stock indexes clocked in all-time closing highs that provided the major overnight sentiment gauge. Ultimately this buoyant risk sentiment should be cheered, but FX traders remain in the Nervous Nellie camp waiting for the next chaotic patch given the evolving narratives. A word of caution to those enjoying this unexpected sea of tranquillity, the next few weeks and months come with significant risk
It's incredible just how quickly the sentiment around the USD has changed this week as deeply ingrained attitudes to fade the dollar rallies has given way to traders awaiting a deeper position squeeze on short dollar positioning. But from my seat, however, it feels like the bulk of the squeeze has occurred and that this current resounding risk rally is stoking the USDJPY fires as CrossJPY continues to race higher. But indeed, the large short dollar positions into the weekend and the surging US yields on Monday provided the primary drivers behind this remarkable USD revival.
However, the long dollar position is not without considerable risk as Fed market positioning suggests this dollar revival is little more than a respite.Tepid wage and inflation numbers are posing a conundrum for the Fed and of course, the dollar will remain an endangered species as dealers await the next Trump administration gaff.
One issue that is being discussed in market circles is that as far as US economic data is concerned, the Hurricane effect may give rise for the Feds to look through inflation data as the storm surges has likely stretched the feds window to dismiss data
The only things that appear certain today is uncertainty itself
The Euro
In the absence of any Euro particular set of drivers and lieu of the current dollar correction, the shooting star reversal is not all that surprising.But despite the sell off from massively overbought levels above 1.2000 the Euro bulls are not giving up the game quickly and remain firm buyers on dips
The Yen
From here, all roads lead to the US CPI on Thursday, which has been a key driver of dollar sentiment all year. ON a solid print the dollar rally extends to 111.25, but on a wrong impression we're quickly back to the 109's as there should be a massive wave of USD selling across the board
Chinese Yuan
After all that has been said and done the logical explanation for the Reserve Requirement shift was that the Pboc are concerned about the pace of depreciation of USD/China. The authorities intend to create more two way flows as hedger will now come back to cover USD exposures with as the authorities hope that more price stability will naturally occur. But from my seat, I think this recent move will provide an excellent opportunity to increase RMB exposure as all things China continues to look Rosy
EM Asia
USDAsia has stuck in a range bound rut despite general USD strength in the market. The market positioning remains relatively light on either side of the coin after Friday rally and subsequent correction Monday. But so far the Asia EMfx has been somewhat immune to the recent USD rally as risk appetite is buttressing local sentiment.
Pound Soars, USD Gains Further
A surprise rise in UK inflation put a BOE hike back on the table while the US dollar bounce continued. The pound was the top performer while the yen lagged. Japanese PPI and the quarter business conditions index is due up next. Our GBPUSD Premium trade is +200 pips in the green, while the GBPJPY was stopped out due to combination of rapid JPY weakness and run-away GBP strength. A new Premium video focusing on yesterday's new trade balances time and price.
The pound showed what a sliver of inflation can do after CPI rose 3.9% y/y compared to 3.7% expected on Tuesday. Cable climbed 120 pips and GBP/JPY rose nearly 250 pips. The rally in GBP/USD broke the August high and 1.3298 was the best in nearly a year. Wednesday's UK jobs figures could help sway Thursday's MPC voting from 2 to 3 hawkish dissenters.
The BOC showed what can happen to a currency when a central bank changes gears and the suspicion in markets is that Carney may finally get to hike rates. The BoE's OIS market is now pricing a 35% chance of a November hike, climbing to 44% in December.
In economic news, US JOLTS job openings were at 6.17m compared to 6.00m expected in another sliver of good economic news for the United States. The main drivers of dollar strength continued to be relief about Irma and momentum.
USD/JPY is now flat on the month after a brutal start, but more broadly it's a mixed picture. The dollar is struggling to hold gains against the euro and cable begins to gain momentum.
Looking ahead, the Asia-Pacific calendar sports a few highlights including Japanese PPI for August. It's expected to rise a healthy 3.0% when it's released at 2350 GMT. In a release at the same time, the MoF's survey of large manufacturers for Q3 is forecast at +5.0 from -2.9.
Gold Pauses After Sharp Losses Kick Off Week
Gold is unchanged in the Tuesday session, after starting the week with considerable losses. In the North American session, the spot price for an ounce of gold is $1327.47, up 0.07%. On the release front, JOLTS Job Openings improved to 6.17 million, easily beating the forecast of 5.96 million. On Wednesday, the US will publish PPI, which is expected to improve to 0.3%.
As one of the most popular safe-haven assets, gold prices have moved higher in recent weeks, as tensions have ratcheted upwards over North Korea's nuclear program. The country has launched missiles over Japan and tested a hydrogen bomb, which has send nervous investors flocking to gold as risk appetite as waned. The markets were prepared for more fireworks over the weekend, as North Korea celebrated its independence day, raising fears that Pyongyang would use the occasion to flex some muscle and test a nuclear bomb or missile. Last year, the country celebrated its anniversary by exploding its fifth nuclear test. With the crisis appearing to ease, stock markets are up and gold prices are down this week, as investors have regained their appetite for risk.
The US economy has generally looked positive in the second quarter of 2017. Preliminary GDP came in at a sizzling 3.0%, and the labor market remains close to capacity. Still, the Achilles heel of the economy remains stubbornly low inflation levels. Wage pressure has been limited, despite the fact that many businesses cannot fill job openings. Weak inflation has hampered the Fed's plans to raise interest rates a third time this year, and the odds of a December hike have dipped to just 31%, as the markets are increasingly doubtful that the Fed will make a move before next year. Will the inflation picture improve? We could see better numbers this week for August inflation – PPI is expected to improve to 0.3% on Tuesday, and the same gain is forecast for CPI on Wednesday. Both estimates are higher than the July readings.
Dollar Rally Continues as North Korea Tensions Ease
USD/JPY has posted gains in the Tuesday session, continuing the upward movement which started the week. In North American trade, the pair is trading at 109.98, up 0.54% on the day. In the US, JOLTS Job Openings improved to 6.17 million, easily beating the forecast of 5.96 million. Later in the day, Japan releases manufacturing and inflation reports. On Wednesday, the US will publish PPI, which is expected to improve to 0.3%.
After a week of increased tensions in the Korean peninsula, an easing in the crisis between North Korea and neighboring Japan and South Korea has seen an exit from safe-haven assets, such as the Japanese yen. USD/JPY has jumped 1.6% this week, erasing last week's losses. With North Korea celebrating its 69th anniversary of its founding, there were concerns that Pyongyang would use the occasion to flex some muscle and test a nuclear bomb or missile. North Korea marked last year's anniversary by exploding its fifth nuclear test. There were no incidents over the weekend, although the US, along with its allies Japan and South Korea, remain on alert for further provocations from the north. The volatility which has marked the Japanese currency is testament to its safe-haven status, as investors have snapped up the yen when the North Korean crisis, one of the world's geopolitical hot spots, heats up.
The US economy has been performing well in the second quarter. Preliminary GDP came in at a sizzling 3.0%, and the labor market remains close to capacity. Still, the Achilles heel of the economy remains stubbornly low inflation levels. Wage pressure has been limited, despite the fact that many businesses cannot fill job openings. Weak inflation has hampered the Fed's plans to raise interest rates a third time this year, and the odds of a December hike have dipped to just 31%, as the markets are increasingly doubtful that the Fed will make a move before next year. Will the inflation picture improve? We could see better numbers this week for August inflation – PPI is expected to improve to 0.3% on Tuesday, and the same gain is forecast for CPI on Wednesday. Both estimates are higher than the July readings.