Sample Category Title
GBP/JPY Mid-Day Outlook
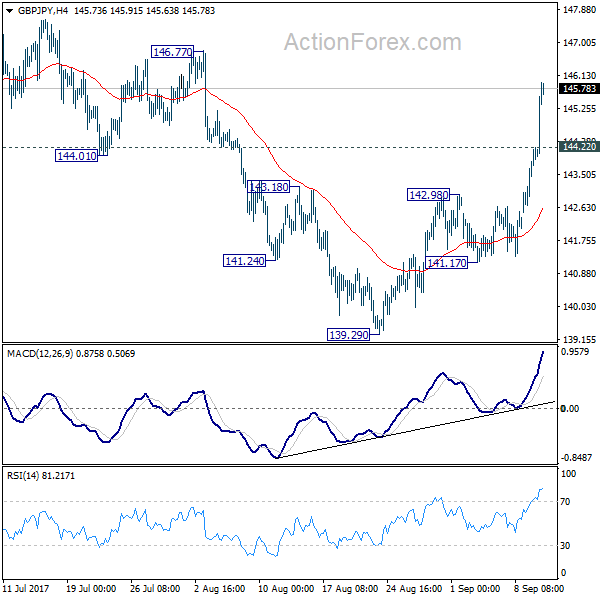
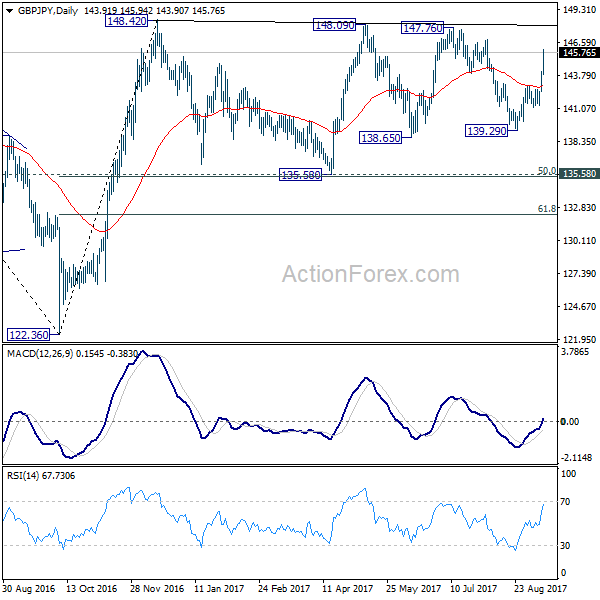
Daily Pivots: (S1) 142.90; (P) 143.53; (R1) 144.60; More
GBP/JPY surges to as high as 145.94 today and intraday bias remains on the upside. Current rise from 139.29 should target a test on 147.76/148.42 resistance zone. Decisive break there will confirm resumption of medium term rebound from 122.36. On the downside, below 144.22 minor support will turn intraday bias neutral first. Overall, for the moment, GBP/JPY is still bounded in sideway consolidation pattern from 148.42.
In the bigger picture, the sideway pattern from 148.42 is still unfolding. In case of deeper fall, we'd expect strong support from 135.58 and 50% retracement of 122.36 to 148.42 at 135.39 to contain downside. Medium term rise from 122.36 is expected to resume later. And break of 38.2% retracement of 196.85 to 122.36 at 150.43 will carry long term bullish implications. However, firm break of 135.58/39 will dampen the bullish view and turn focus back to 122.36 low.
EUR/USD Mid-Day Outlook
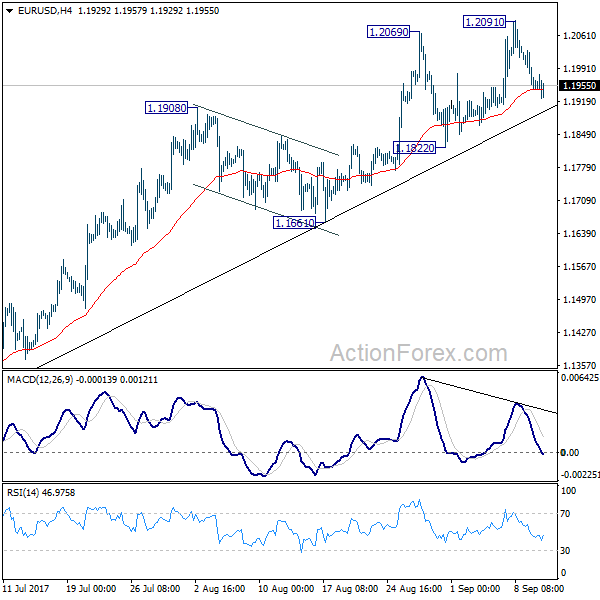
Daily Pivots: (S1) 1.1923; (P) 1.1976 (R1) 1.2005; More...
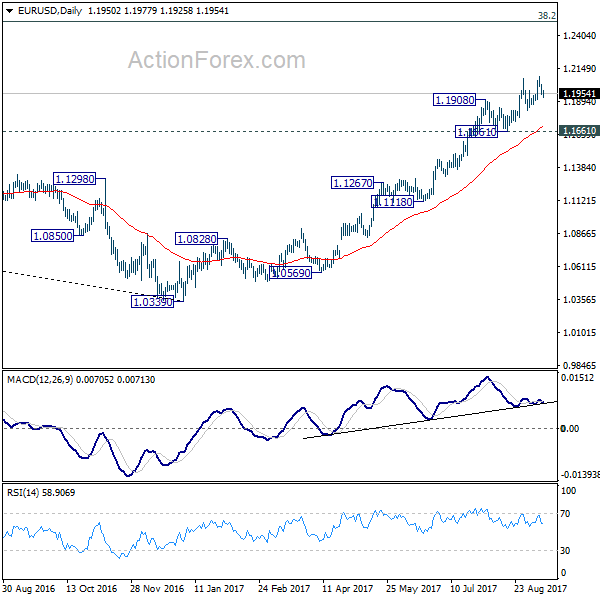
Intraday bias in EUR/USD remains neutral at this point. Overall, outlook remains bullish as long as 1.1822 support holds. Above 1.2091 will extend larger rise fro 1.0339 and target next key fibonacci level at 1.2516. But considering bearish divergence condition in 4 hour MACD, break of 1.1822 will confirm short term topping and bring deeper fall back to 1.1661 support and below.
In the bigger picture, rise from medium term bottom at 1.0339 is still in progress for 38.2% retracement of 1.6039 (2008 high) to 1.0339 (2017 low) at 1.2516. However, it should be noted that there is no confirmation of trend reversal yet. That is, such rebound from 1.0399 could be a correction. And the long term fall fro 1.6039 (2008 high) could resume. Hence, we'd be cautious on strong resistance from 1.2516 to limit upside. But after all, break of 1.1661 is needed to indicate medium term topping. Otherwise, outlook will remain bullish in case of pull back.
Trade Idea: EUR/GBP – Sell at 0.9065
EUR/GBP - 0.9011
Original strategy :
Sell at 0.9130, Target: 0.9000, Stop: 0.9170
Position : -
Target : -
Stop : -
New strategy :
Sell at 0.9065, Target: 0.8955, Stop: 0.9105
Position : -
Target : -
Stop : -
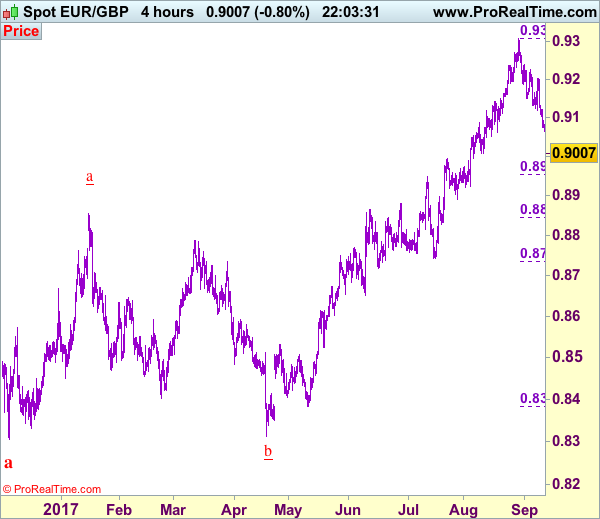
As euro’s decline has accelerated today, adding credence to our view that top has been formed at 0.9307 and bearishness remains for the fall from there to bring retracement of recent upmove, hence downside bias remains for further weakness to 0.8950-55 (38.2% Fibonacci retracement of 0.8384-0.9307), below there would extend weakness to 0.8920-25 but reckon near term oversold condition would limit downside and 0.8890-00 would hold from here.
In view of this, would not chase this fall here and we are looking to sell euro on recovery as 0.9065-70 should limit upside Above 0.9100 would defer and bring a stronger rebound to 0.9135-40, however, still reckon upside would be limited to 0.9170 and resistance at 0.9203 should remain intact, bring another decline later.
Our preferred count is that, after forming a major top at 0.9805 (wave V), (A)-(B)-(C) correction is unfolding with (A) leg ended at 0.8400 (A: 0.8637, B: 0.9491 and 5-waver C ended at 0.8400. Wave (B) has ended at 0.9413 and impulsive wave (C) has either ended at 0.8067 or may extend one more fall to 0.8000 before prospect of another rally. Current breach of indicated resistance at 0.9043 confirms our view that the (C) leg has ended and bring stronger rebound towards 0.9150/54, then towards 0.9240/50.
USD/CHF Mid-Day Outlook
Daily Pivots: (S1) 0.9491; (P) 0.9529; (R1) 0.9603; More....
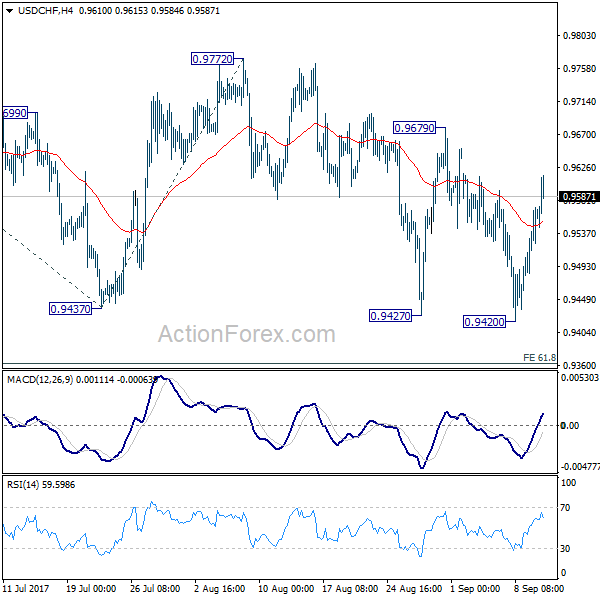
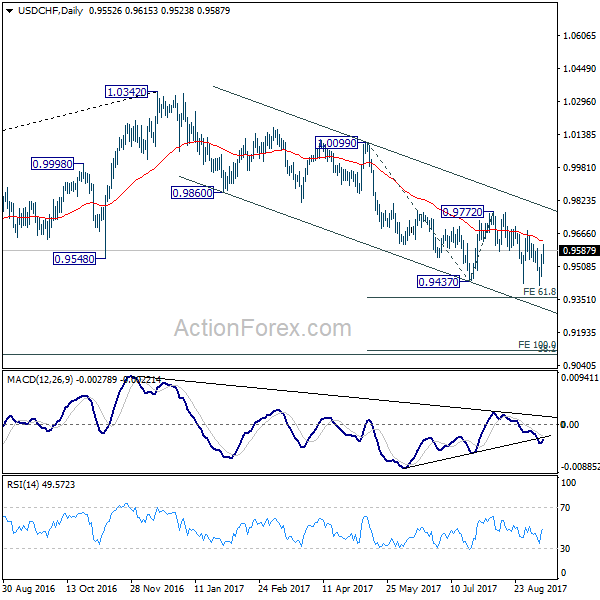
With 0.9679 resistance intact, outlook stays bearish even though rebound from 0.9420 is strong. Another fall is still expected. Sustained break of 0.9420 will target 61.8% projection of 1.0099 to 0.9437 from 0.9772 at 0.9363 first. Break will target 100% projection at 0.9110 next. However, break of 0.9679 will indicate near term reversal and turn bias to the upside for 0.9772 resistance for confirmation.
In the bigger picture, current development suggests that 0.9443 key support (2016 low) could be taken out firmly as down trend form 1.0342 extends. There are various interpretation of the price actions. But in any case, medium term outlook will stay bearish as long as 0.9772 resistance holds. Current down trend could extend to 38.2% retracement of 0.7065 (2011 low) to 1.0342 (2016 high) at 0.9090. However, break of 0.9772 will indicate that USD/CHF has successfully defended 0.9443 again and turn outlook bullish for 1.0099 resistance.
USD/JPY Mid-Day Outlook
Daily Pivots: (S1) 108.47; (P) 108.99; (R1) 109.88; More...
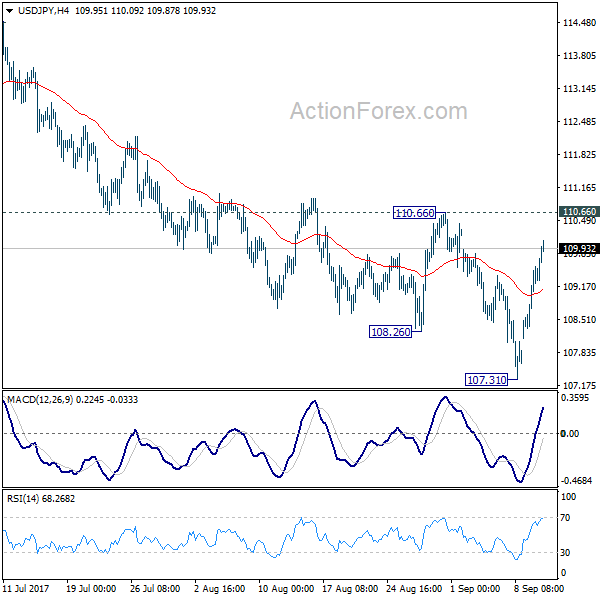
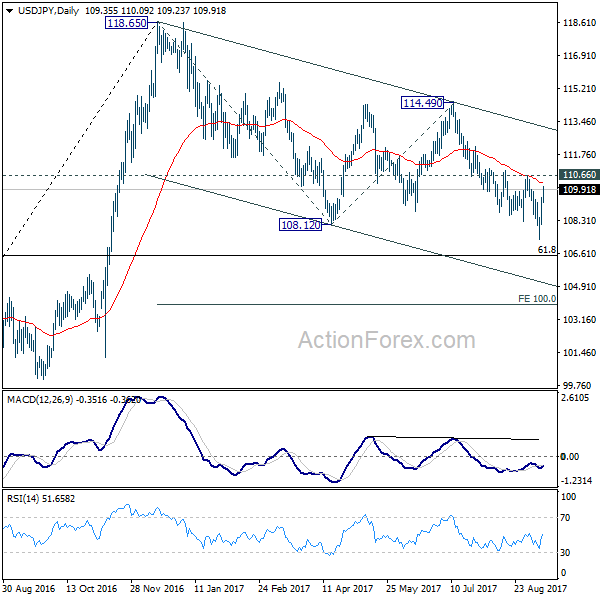
No change in USD/JPY's outlook. While the rebound from 107.31 is strong, it's limited below 110.66 resistance so far. Outlook remains bearish and another fall is still expected. Break of 107.31 will extend the whole fall from 118.65 to 61.8% retracement of 98.97 to 118.65 at 106.48 first. We'd look for support from there to bring rebound. But firm break of 106.48 will extend the decline to 100% projection of 118.65 to 108.12 from 114.49 at 103.96 or below. On the upside, firm break of 110.66 will confirm short term bottoming and turn bias back to the upside.
In the bigger picture, rise from 98.97 (2016 low) is now seen as the second leg of the corrective pattern from 125.85 (2015 high). It's unclear whether this this second leg has completed at 118.65 or not. But medium term outlook will be mildly bearish as long as 114.49 resistance holds. And, there is prospect of breaking 98.97 ahead. Meanwhile, break of 114.49 will bring retest of 125.85 high. But even in that case, we don't expect a break there on first attempt.
Trade Idea: USD/CAD – Sell at 1.2240
USD/CAD - 1.2145
Trend: Down
Original strategy :
Sell at 1.2240, Target: 1.2080, Stop: 1.2300
Position: -
Target: -
Stop: -
New strategy :
Sell at 1.2240, Target: 1.2080, Stop: 1.2300
Position: -
Target: -
Stop:-
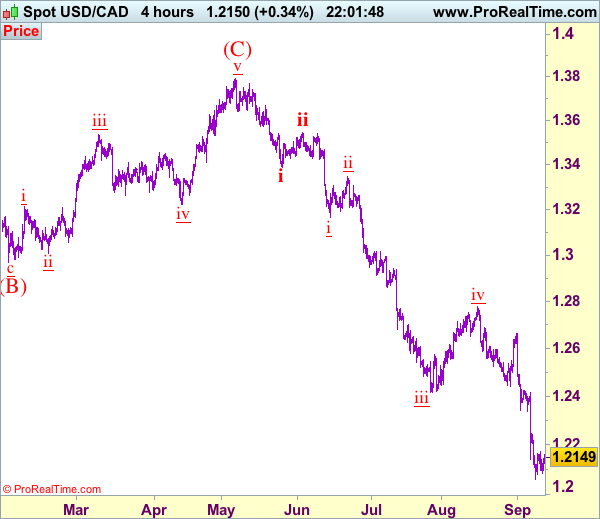
As the greenback has recovered again after finding support at 1.2082, retaining our view that further consolidation above last week’s low at 1.2061 would take place and another bounce to 1.2200 cannot be ruled out, however, reckon resistance at 1.2245 would limit upside and bring another decline later, below 1.2097 would bring a retest of said support at 1.2061, break there would signal recent decline is still in progress and may extend further weakness towards psychological support at 1.2000 but loss of downward momentum should prevent sharp fall below 1.1950-60, bring rebound later. We are keeping our count that wave v as well as wave (C) ended at 1.3794 and impulsive wave (i ii, i ii) is now unfolding with minor wave iii ended at 1.2414, followed by wave iv correction ended at 1.2778, wave v has reached our indicated downside target at 1.2100 and may extend to 1.2000.
In view o this, would not chase this fall here and would be prudent to sell on recovery as 1.2245 should limit upside. Above 1.2300 would would defer and risk a stronger rebound to 1.2335-40 but only break of resistance at 1.2429 would signal low is formed, bring retracement of recent decline to 1.2490-00.
To recap, wave B from 1.3066 is unfolding as an a-b-c and is sub-divided as a: 1.2192, b: 1.2716 and wave c is a 5-waver with i: 1.1983, ii: 1.2506, extended wave iii with minor iii at 1.0206, wave iv ended at 1.0781 and wave v as well as wave iii has ended at 0.9931, hence the subsequent choppy trading is the wave iv which is unfolding as (a)-(b)-(c) with (a) leg of iv ended at 1.0854, followed by (b) leg at 1.0108 and (c) leg as well as the wave iv ended at 1.0674. The wave v is sub-divided by minor wave (i): 0.9980, (ii): 1.0374, (iii): 0.9446, (iv): 0.9913 and (v) as well as v has possibly ended at 0.9407, therefore, consolidation with upside bias is seen for major correction, indicated target at 1.3700 and 1.4000 had been met and further gain to 1.4700 would be seen later.
Pound Surges to 1-Year High Versus Dollar as UK Inflation Approaches 3%
The pound climbed by almost 1% on Tuesday during the European trading hours, hitting a one-year high against the greenback and extending gains versus the euro after the widely expected UK inflation figures for the month of August came in stronger than expected. With consumer prices rising to a four-year high reached first on May, BOE policymakers will consider seriously whether to deliver a rate hike on Thursday as inflation continues growing above the central bank's target but wages remain subdued.
According to the National Office for Statistics, consumer prices rose by 2.9% on a yearly basis in August, above the forecast of 2.8% and July's mark of 2.6%. Month-on-month, inflation turned positive to 0.6% from a negative 0.1% seen in the previous month, posting the highest increase in six months. The pickup in inflation emerged as households spent more on clothing and footwear ahead of the autumn season, with the sector experiencing the biggest increase in prices in almost 30 years. Particularly, clothing and footwear prices rose by 2.4% m/m and 4.6% y/y. Moreover, the pound's depreciation following the Brexit vote in June 2016, lifted import costs and consequently drove the CPI index higher.
Excluding energy and food items, the yearly core CPI index jumped by 0.3 percentage points to 2.7%, exceeding the expectations for a rise of 2.5%.
In another report, UK producer prices jumped surprisingly higher in August as well due to the exchange rate's weakness and increased fuel costs. The cost of inputs, which are mainly imported, bounced up by 7.6% y/y from a 6.2% gain seen in July (downwardly revised from 6.5%), surpassing the forecast of 7.3%. The monthly rate was up by 1.6%, above the 1.3% expected and the negative 0.2% observed in the previous month (downwardly revised from 0.0%).
Regarding the cost of outputs, this climbed by 0.2 percentage points to 3.4% y/y, surprising analysts who anticipated the rate to increase to 3.1%. The monthly change stood at 0.3 percentage points with the output PPI jumping from 0.1% in July to 0.4%.
Even though the above inflation numbers are seen encouraging a rate hike, as prices continue to hover above the Bank of England's target of 2% since February, BOE policymakers will feel their hands tied when they look at wage growth. British average earnings excluding bonuses grew by 2.1% in June, far below the inflation rate, and are expected to climb slowly to 2.2% in July. Nevertheless, the government's passage of the EU withdrawal bill voted yesterday, which removed a layer of political uncertainty, will probably provide some relief to BOE members who are expected to gather tomorrow to decide on interest rates.
Looking at forex markets, pound/dollar hit a one-year high of 1.3287 before it slipped to 1.3274, while euro/pound extended its losses made earlier touching a fresh one-month low below 90 pence at 0.8981.
Gold Continues to Corrects Lower
Gold prices continued to pull back during the European day Tuesday, extending their losses from Monday, as investors' risk appetite returned with a vengeance. This recent shift in market sentiment may be owed primarily to two factors: the absence of any further escalation of the North Korean crisis, and the fact that Hurricane Irma has been less severe than expected, at least thus far. In brief, some major risks that investors may have anticipated did not actually materialize. Therefore, moving forward, we see the case for the recent price action to continue for a while. Gold and other safe haven assets may retreat further, while riskier assets, such as equities, may continue to recover.
Looking further ahead, even though the latest market action suggests that geopolitical risks have dissipated, we have to sound a note of caution. All it would take to 'spoil the party' would be another unforeseen missile launch from North Korea that escalates tensions again. Something like that is not at all unlikely as North Korea warned the US it will face the "greatest pain" it has ever experienced for leading the effort to impose fresh UN sanctions on the regime.
Gold opened with a negative gap on Monday, and continued trading south on Tuesday to dip slightly below the support (now turned into resistance) barrier of 1325 (R1). Given that the price structure on the 4-hour chart remains higher peaks and higher troughs above the uptrend line taken from the low of the 10th of July, we believe that the short-term outlook is still positive. However, for now we see the case for the latest retreat to continue, perhaps to test the 1315 (S1) support line or the aforementioned uptrend line. Our short-term oscillators support the case for the correction to continue for a while. The RSI edged lower and now looks ready to challenge its 30 line, while the MACD stands below both its zero and trigger lines and points down.
Zooming out to the daily chart, we see that the 1300 (S2) zone acted as the upper bound of the wide range the yellow metal has been trading within since the 31st of January, between that hurdle and the 1200 territory. Its break turned the medium-term outlook positive, evident by the subsequent rally and thus, as long as the latest decline remains limited above that key territory, we would treat it as a corrective phase.
USD/JPY Recovery After V Shaped Reversal Pattern
Despite strong Core Machinery Orders in Japan today, signaling strength in their manufacturing sector; UJ continues to move bullish after this weekend's gap up, and this is largely as a result of risk-on sentiments across the risky assets such as Equities. The retracement has started after a V shaped reversal pattern and the intraday/week trend turned to bullish.
Technically, the USD/JPY is still in downtrend but it has a strong recovery, and the gap hasn't been closed yet. 109.25-109.40 is the POC(b) buy zone (order block, W H4, ATR pivot) and 110.45-110.65 is POC(s) sell zone. At this point price is in no man's land. If the price retraces to POC(b) we could see a bounce towards 110.13 and 110.50. If we see the price within the POC(s) then targets are 110.15 and 109.75. Above 110.75 we could see a stronger recovery. Watch for these zones.
- W L3 - Weekly Camarilla Pivot (Weekly Interim Support)
- W H3 - Weekly Camarilla Pivot (Weekly Interim Resistance)
- W H4 - Weekly Camarilla Pivot (Strong Weekly Resistance)
- D H4 - Daily Camarilla Pivot (Very Strong Daily Resistance)
- D L3 - Daily Camarilla Pivot (Daily Support)
- D L4 - Daily H4 Camarilla (Very Strong Daily Support)
- POC - Point Of Confluence (The zone where we expect price to react aka entry zone)
Elliott Wave Analysis: GBPUSD Trading Bullish
Good day traders! Today we are going to take a better look at GBPUSD price structure.
GBPUSD is trading bullish since end of August and is displaying an impulsive structure. We see current price action trading at the end of wave 3, that is now touching some significant turning point zones. We are talking about Fibonacci ratio of 261.8, where wave 3 can end and a new three-wave move lower into wave 4 can come in play. Support for the following wave 4 can later be around the former wave iv at the 1.3159 level.
GBPUSD, 1H