Sample Category Title
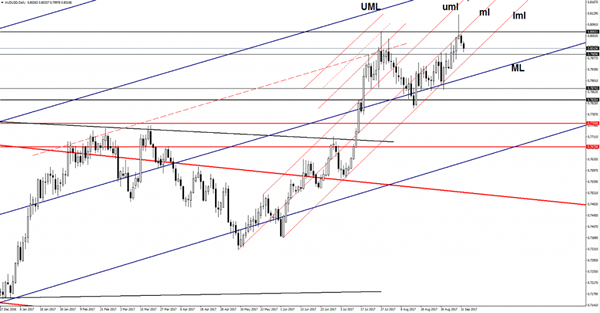
AUD/USD Turned To The Downside
AUD/USD dropped further after the yesterday's bearish candle and should hit fresh new lows very soon. Price has found strong resistance, so the current drop is natural. The USD has taken the lead again as the USDX has rallied in the yesterday's session.
We'll see what will happen on the dollar index because the rebound could be only temporary. As you already know, the USDX remains under massive selling pressure despite the current bounce back. Only an accumulation could signal a reversal on the USDX.
The Aussie goes down also because the NAB Business Confidence was reported at 5 points in August, much below 12 points in the previous reading period. The economic indicator has reached the lowest level since December 2016. We'll see how the pair will react after the release of the US data, the JOLTS Job Openings are expected to drop from 6.16M to 5.96M, while the NFIB Small Business Index decreased from 105.2 to 104.8 points.
The pair has turned to the downside after the false breakout above the 0.8065 horizontal resistance and above the median line (ml) of the minor ascending pitchfork. The next downside target will be at the lower median line (lml) of the minor ascending pitchfork. A breakdown from the pitchfork's body will send the rate towards the median line (ML) of the major ascending pitchfork, where he could find support again.
Market Morning Briefing: The Aussie Is Testing The Support At 0.8000
STOCKS
Major stock indices have shot up yesterday. Dow and Dax have rallied up and Nikkei has opened at higher levels. Shanghai may be in a pause mode for some time. Nifty looks bullish for the week.
Dow (22057.37, +1.19%) has been trading sideways since mid-Aug only to build base and gather more momentum for a sharp surge as seen yesterday. Immediate resistance is seen near 22100 which is likely to break on the upside targeting 22400 soon.
Dax (12475.24, +1.39%) also opened with a gap up and rose higher. The bullish momentum looks strong just now and could take the index to levels near 12750-12800 again in few sessions.
Nikkei (19742.20, +1.00%) opened today with a sharp gap up above our immediate resistance near 19600. A test of 19900-20200 levels is on the cards for the near term.
3400 could act out as a decent resistance for Shanghai (3375.37, -0.03%) in the next few sessions. A slight fall in the near term could be helpful to gain some more momentum to resume the longer term uptrend. If not an immediate fall, we could see some sideways consolidation between 3400-3300 zone.
Nifty (10006.05, +0.72%) could re-test 10100 or higher in the coming sessions while immediate support near 9900 holds. Thereafter a slight corrective dip is possible.
COMMODITIES
Gold (1329) moved lower in line with our short term bearish view due to overbought condition and renewed strength in Dollar Index. Immediate trading range for Gold is now 1327-1363 and a close below 1327 could open up 1303 levels as well. Similarly Silver (17.75) has also moved lower and trading within the range of 17.40-18.01.
Copper (3.03) has also come down in line with our expectation and trading within the range of 3.00-3.16 and a daily close below 3.00 could open up 2.90 levels as well.
No directional move had been seen in Brent (53.80) as it is hovering around the support of its near term trading range of 53.30-55.60.Only a close below 53.30 could open up 51 regions, otherwise it might move up towards 55. WTI (48.06) is also trading at yesterday's level, within its narrow range of 47.22-50-48.70. Only above 48.70, the higher resistance of 50.20 can come into consideration.
FOREX
As it turns out, Dollar-Yen (109.36) has broken above the 108.70-90 region, bringing it back into the earlier 108-111 range. However, the market may stall for a while between 109.00-110.00 for a couple of days. A break above 110 is needed to propel the market to higher levels.
The Euro-Yen (130.74) has risen along with Dollar-Yen, within an overall uptrend that can target 132+. This might also help Euro-Dollar (1.1960) to maintain its overall uptrend by remaining above trend Support at 1.1900.
The Pound (1.3177) has done well for itself by rising from 1.28 since 23rd August. We have been looking for further upside to 1.3270 as well. But, it could run into profit-taking soon if it is unable to move up to 1.3270 immediately, say today itself.
The Aussie (0.8011) is testing the Support at 0.8000. Deeper Support seen near 0.7965 as well. While these hold, we continue to be bullish overall, targeting 0.82. At the same time, we acknowledge the chances of a near term dip to 0.7965 as well.
Further short-covering being seen in the Dollar-Yuan (USDCNY = 6.5439). Chances of seeing 6.5750 now.
Dollar-Rupee closed at 63.86 yesterday, but trades near 63.99/64.03 on the NDF market, following the rise in the Dollar Index (91.875), which might move up to 92.00-20 this week. If so, Dollar-Rupee could see 64.20.
INTEREST RATES
The benchmark US 10Yr yield (2.12%) moved higher as it is trading above 2.08% regions. It is trading within a bearish channel since 10th of July 2017 and only a daily close above 2.16-18% regions could help to get out of the same.
EUR/USD moved lower due to lack of upside momentum in both German-US 2 Yr Spread (-2.03%) and the German-US 10Yr Spread (-1.73%).
Muted price action has been seen in across all the Japanese Bond yields. Japan 10Yr yield hovering around at 0.00% levels while the 30Yr (0.81%) and the 5Yr (-0.14%) are almost unchanged.
UK Gilts yields has rebound marginally as UK 5Yr and 30Yr Gilt Yields (5Yr 0.45% and 20Yr 1.55%) are up by 2-3 pips. The UK 10Yr (1.02%)is also moved higher with an immediate resistance at 1.07% regions.
USD/JPY Breaks Support But Is Immediately Bought With Vigour
I'm back in the office after a long weekend and just want to take my time today easing myself back into the price action that I missed.
Take a look at the unfolding USD/JPY price narrative that we've been following on the blog with price lunging below the major daily support level that we've been talking about…
USD/JPY Daily:
…but nope, that certainly didn't last long. The buyers stepped in and price immediately reversed with some serious vigour.
The momentum in the bounce back is highlighted by the fact that price didn't even pause at the retest of short term support. It's all about that higher time frame support level right now.
Now take a step into the intraday chart and take a look at how price actually reacted to the level…
USD/JPY Hourly:
So here we can see that price actually gapped back through the level on Monday's open. From there, momentum has taken hold and we can see why the cliche of not stepping in front of a moving train to pick a top is said so often.
USD & Indices Rally After Hurricanes
US and global indices rallied across the board as fears of widespread damage from Hurricanes Harvey and Irma have ebbed slightly. Lack testing activity from Pyongyang also helped appease markets. The Hurricanes will weigh on Q3 GDP by 0.3%-0.4%, while the rebuilding boost may lift Q4 to as high as 3.5% from an expeccted 2.0% in Q3. Our DAX short was stopped out. A new Premium trade has been issued with detailed charts highlighting a crucial analog.
USD/JPY soared 150 pips to 109.50 from a Friday's low of 107.36 on Friday. The bounce brings the pair back above a few critical support levels, including the April low of 108.13. That one will be critical in the day ahead.
Estimates to the Hurricanes damage range from as high as $200 billion to $50 billion but in order for both storms to surpass the magnitude as a percentage of GDP as that reached in 2005, their combined damage would have to exceed $220 billion.
CFTC Commitments of Traders
Speculative net futures trader positions as of the close on Tuesday. Net short denoted by - long by +.
EUR +96K vs +87K prior GBP -54K vs -52K prior JPY -74K vs -69K prior CHF -2K vs -2K prior CAD +54K vs +53K prior AUD +65K vs +67K prior NZD +15K vs +19K prior
The overall moves were modest, likely as the market hunkered down ahead of the BOC and ECB, but the increase in the euro net long was enough to push it to the highest since May 2011.
A Big Sigh Of Relief
A Big Sigh of Relief
New York traders breathed a huge sigh of relief after the Dollar deftly sidestepped a gaping chasm when North Korea didn’t test H-bombs or launch ICBM’s and the devastation from hurricane Irma was not of the Apocalyptic scale some had anticipated
On cue, the US equity markets rocketed higher with the S&P closing in record territory while the US 10y yields pumped four bp’s higher to close at 2.13 Now that the ” storm has passed” and North Korea played the good man over their 69th anniversary, the question now is whats next for the beleaguered dollar as some key themes are developing in the background beyond the current NK risk play and dovish Fed narrative.
A relief rally or not the Green back has dodged the bullet once again.
Japanese Yen
Predictably USDJPY was the biggest beneficiary, rising from 108. 25 at yesterday’s Singapore open to 109.49 taking out last Wednesday high due to the unwinding of risk-aversion trades. It’s safe to say that haven trades were a bit stretched as traders could not get enough yen to whet their appetite last week when aversion trades were the rage so the unwind is not too surprising given the lack of Geo escalation over the weekend.
Investors in the JPY space will likely look favourably on the fact the UN Security Council has voted unanimously to step up sanctions against North Korea even if it’s watered down version of the US proposal but it does have the decisive support from both Russia and China.
However, the fate of USDJPY extension will be Thursdays US CPI and given we may have seen our high water mark for US inflation; a tepid CPI print will pressure USDJPY lower
Euro
After opening in Singapore yesterday at 1.2025 and flirting with 1.2035 in London, the Euro prices headed straight down as traders started fretting about the lack of top side follow through as arguably stretched USD dollar short position made trader nervous. Also and the fact that USDCNH found a base after rallying hard on Friday when the Pboc reduced forward hedging margins cooled the greenback sell off. But traders started trimming Euro longs aggressively when a Reuters article surfaced that a report, written by six European Central Bank members, supported a very very gradual roll back of the QE program. The Dovish ECB narrative has always been an impediment to gains above the 1.200 level as the Doves are not happy with the rapid appreciation of the Euro more so given that the EU is still in recovery mode and a strong Euro hurts productivity
Australian Dollar
The Aussie is slipping lower on the back of the USD recovery overnight. As for the regional sentiment, the Greenback was also buttressed by a rebound in USDCNH after the pair rallied from a multi year low when PBoC reduced the onshore FX risk reserve requirement from 20% to 0%. While this does not signal or is intended to curb the RMB appreciation, it gave rise to consolidation and traders were more apt to book profits amid crowded positions. Similarly, extended long Aussie positioning also turned for the exits
Elliott Wave Trade Ideas Performance Update
3 positions were entered last week with total profit of 10 points and the positions are listed below.
7 Sep : EUR/JPY - Short at 130.25, exited at 130.15 (+ 10 points)
11 Sep : AUD/USD - Long at 0.8050, exited at 0.8050 ( 0 point)
11 Sep : EUR/JPY - Short at 130.20,
| AUD EUR/JPY EUR/GBP CAD GBP GBPJPY
Jan - 15 -275 - 35 -120
Feb + 140 -17 - 40 +11
Mar - 20 +115 +132 - 19
Apr + 30 - 40 +120 + 45
May - 55 +100 - 6 -65 -60
Jun + 81 +150 - 10 +185 -120 +205
Jul - 40 - 60
Aug +155 +200 + 100 + 195 -45 - 50
Sep +10 +10
Oct
Nov
Dec
Y-T-D + 371 +128 +167 +658 -230 +90
Candlesticks and Ichimoku Trade Ideas Performance Update
3 positions were entered among all 4 currency pairs with total loss of 35 points and the positions are listed below:
7 Sep : EUR/USD - Short at 1.1980, exited at 1.2015 (- 35 points)
8 Sep : USD/CHF - Long at 0.9450,
11 Sep: EUR/USD - Long at 1.1985,
| JPY EUR CHF GBP
Jan + 167 - 85 - 10 + 50
Feb + 200 +150 +93 - 59
Mar -23 -70 -23 - 35
Apr + 65 + 93 + 50 - 40
May - 65 - 35 + 100 -175
Jun -100 -10 - 10 +175
Jul + 85 - 35 - 8
Aug + 35 +210 + 35 +65
Sep + 44 + 65
Oct
Nov
Dec
Y-T-D + 407 +278 +227 - 9
Increased Interest in USD
The trading week started on a positive note with traders in a good mood thanks to the absence of any new missile launches or nuclear tests in North Korea. However, it comes as no surprise as North Korea celebrated their 69th year of founding. As a result we saw a fall in demand for defensive assets like gold, the Japanese yen and Swiss franc. The greenback also benefited from Chinese banks easing their restrictions on US dollar purchases.
The central event for the US currency during this week will be the data release on the consumer price index on Thursday. Considering the recent depreciation of dollar, the cost of imports increased which will support inflation growth and that in turn may result in more hawkish rhetoric by Fed officials concerning the possibility of another rate hike before the end of the year.
The USD/JPY grew today due to stronger demand for risky assets like the US dollar and this offset positive statistics from Japan on machine tools orders that according to preliminary data increased in August by 36.6% compared to the same period of the previous year.
The news from Canada on the growth in the number of housing starts to 223,000 in August that is 9,000 more than expected was not able to compensate the pressure from US dollar appreciation and the fall of crude oil prices that traditionally have a significant impact on the price of USD/CAD.
EUR/USD
The EUR/USD, after some consolidation above the important 1.2000 mark, resumed negative dynamics and may soon reach the inclined support line. If it breaks through, we may see a change to the local rising trend to negative. In this case the next targets will be at 1.1825 and 1.1750. Upside potential is limited by the nearest high around 1.2100.
USD/JPY
The USD/JPY could not fix below 108.05 and is showing confident rising dynamics. Recently quotes have overcome the upper limit of the local descending channel and reached the 108.85 line, gaining a foothold above this line may become a trigger for massive purchases with the nearest targets at 109.60 and 110.30. The closest support range in case of the fall resuming will be at 108.00-108.05.
USD/CAD
The USD/CAD did not reach the psychologically important 1.2000 mark and is now correcting upwards within the descending channel. In case of price fixing above 1.2200 we may see further growth up to 1.2365 and 1.2550. Recent crossing of the zero point by the MACD signal line is in favour of this positive scenario. The strong support line is still located at 1.2000.
Euro Pulls Back as ECB’s Coeure Questions Inflation Path; Pound Holds onto Gains ahead of a Busy Week
While investors were looking for riskier purchases after North Korea confounded rumors of an intercontinental ballistic missile test on Saturday, the euro retreated following the dovish remarks made by ECB member, Benoit Coeure, in Frankfurt. Meanwhile, the pound drifted higher during the European trading ahead of a busy data week and before the BOE policy meeting on Thursday.
The dollar continued gaining against its rivals in Europe as geopolitical risks eased on Monday. However, investors were focused on the outcome of the UN National Security Council meeting today, which will vote whether to impose stricter sanctions on North Korea. The isolated regime, which seems to defy global calls for termination of its nuclear programs, warned the US early on Monday of a counter-military attack if the US continues threatening the country with further sanctions.
Meanwhile, in the US, authorities were counting the damage caused by the ongoing Hurricane Irma, a week before the Fed policymakers meet to decide on interest rates. Although expectations are for the central bank to keep rates unchanged, as recent inflation data came in weaker than expected, the financial impact of the deadly natural disasters has wiped out any chance of another rate hike this year. Besides that, Trump said on Saturday that he would ask Congress to speed up the efforts to reform the US tax code given the costly damage from Hurricanes Irma and Harvey. On Friday, the President also recommended congressional policymakers to proceed with tax reforms before the end of September.
The dollar index was up by 0.28% on the day at 91.64. Dollar/yen and dollar/swissie reversed Friday's losses rising to 108.76 and 0.9526 respectively.
The safe-haven gold tumbled by 0.86% to $1,335 per ounce.
In contrast, the euro was pressured against the greenback during the European session as ECB member, Benoit Coeure, said on Monday in Frankfurt that the "medium-term period", in which inflation is said to approach the ECB target of 2%, might last longer if exogenous shocks to the strengthening exchange rate persist. Though Coeure added that the impact of the exchange rate on the block's economic growth might be softer than the one after the recent financial crisis, as the region's expansion is mainly based on higher domestic demand. The common currency dived into losses after the comments, falling to $1.1982.
Elsewhere, Britain's House of Commons will put the EU repeal bill, which aims to attach European laws into Britain's legal framework, on the table later today. Despite expectations being for the government to win the vote, the paper might find obstacles to turn into law when it passes to the second stage in front of the committees, where ministers might propose amendments.
Moreover, a stream of economic data out of the UK, including inflation and unemployment rate figures, will be eyed during the week before the Bank of England's policy meeting on Thursday.
The pound managed to climb near the one-month high of $1.3223 it touched on Friday, but it slipped to $1.3193 afterwards.
Looking at energy markets, Saudi Arabia's discussions with Venezuela and the non-OPEC member Kazakhstan to extend global supply cuts beyond March 2018 failed to lift oil prices further. The markets were mostly worried that Hurricane Irma hitting densely populated areas in Florida, could dampen oil demand in the US, the world's largest oil-consuming nation in the world.
WTI crude dropped by 0.80% to trade at $47.10 per barrel during afternoon European trading hours, while Brent fell by 1.30% to $53.08.
The loonie lost ground against its US counterpart amid declining oil prices and a strengthening dollar despite Canadian housing starts for the month of August coming in better than expected. Dollar/loonie jumped to an intra-day high of 1.2158 before sliding to 1.2143.
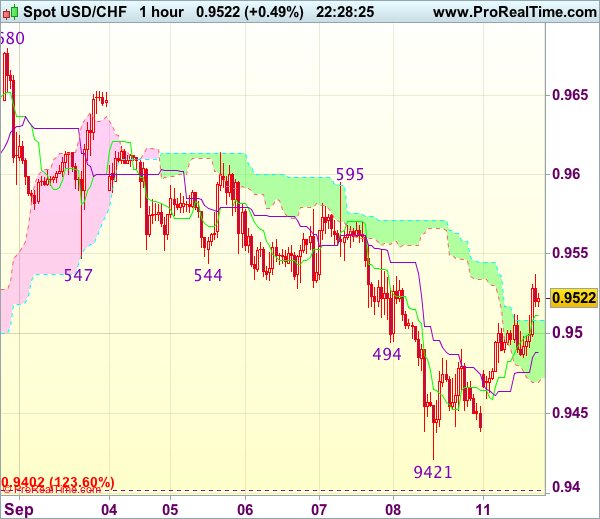
Trade Idea Wrap-up: USD/CHF – Hold long entered at 0.9450
USD/CHF - 0.9521
Most recent candlesticks pattern : N/A
Trend : Down
Tenkan-Sen level : 0.9511
Kijun-Sen level : 0.9488
Ichimoku cloud top : 0.9508
Ichimoku cloud bottom : 0.9470
Original strategy :
Bought at 0.9450, Target: 0.9550, Stop: 0.9480
Position : - Long at 0.9450
Target : - 0.9550
Stop : - 0.9480
New strategy :
Hold long entered at 0.9450, Target: 0.9550, Stop: 0.9480
Position : - Long at 0.9450
Target : - 0.9550
Stop : - 0.9480
As the greenback found support at 0.9439 and has rebounded, retaining our view that low is possibly formed at 0.9421 on Friday and consolidation with mild upside bias remains for retracement of recent decline, hence gain to 0.9550-55 would be seen, however, break above there is needed to add credence to this view, bring a stronger rebound towards resistance at 0.9595 which is likely to hold from here.
In view of this, we are holding on to our long position entered at 0.9450. Below said support at 0.9421 would risk weakness to 0.9390-00, having said that, further sharp fall below 0.9370-75 should not be repeated and reckon 0.9350 would hold from here, bring rebound later.