Sample Category Title
Trade Idea Wrap-up: USD/CHF – Hold long entered at 0.9450
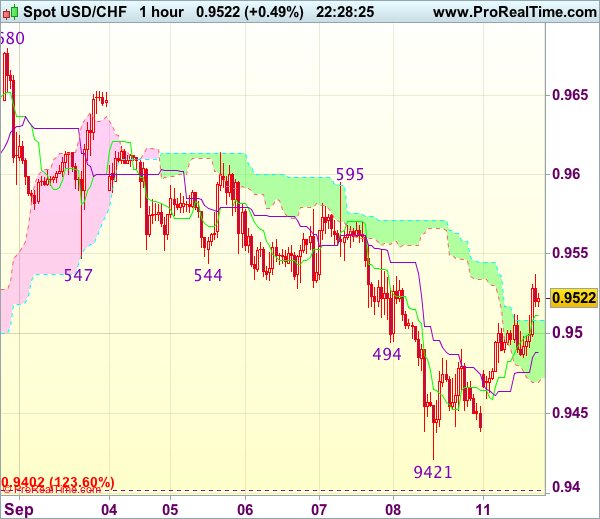
USD/CHF - 0.9521
Most recent candlesticks pattern : N/A
Trend : Down
Tenkan-Sen level : 0.9511
Kijun-Sen level : 0.9488
Ichimoku cloud top : 0.9508
Ichimoku cloud bottom : 0.9470
Original strategy :
Bought at 0.9450, Target: 0.9550, Stop: 0.9480
Position : - Long at 0.9450
Target : - 0.9550
Stop : - 0.9480
New strategy :
Hold long entered at 0.9450, Target: 0.9550, Stop: 0.9480
Position : - Long at 0.9450
Target : - 0.9550
Stop : - 0.9480
As the greenback found support at 0.9439 and has rebounded, retaining our view that low is possibly formed at 0.9421 on Friday and consolidation with mild upside bias remains for retracement of recent decline, hence gain to 0.9550-55 would be seen, however, break above there is needed to add credence to this view, bring a stronger rebound towards resistance at 0.9595 which is likely to hold from here.
In view of this, we are holding on to our long position entered at 0.9450. Below said support at 0.9421 would risk weakness to 0.9390-00, having said that, further sharp fall below 0.9370-75 should not be repeated and reckon 0.9350 would hold from here, bring rebound later.
Trade Idea Wrap-up: GBP/USD – Buy at 1.3125
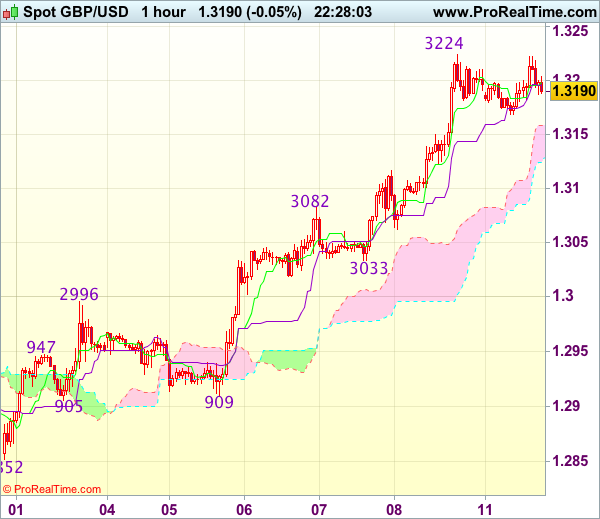
GBP/USD - 1.3185
Most recent candlesticks pattern : N/A
Trend : Near term up
Tenkan-Sen level : 1.3198
Kijun-Sen level : 1.3195
Ichimoku cloud top : 1.3158
Ichimoku cloud bottom : 1.3124
Original strategy :
Buy at 1.3125, Target: 1.3225, Stop: 1.3090
Position : -
Target : -
Stop : -
New strategy :
Buy at 1.3125, Target: 1.3225, Stop: 1.3090
Position : -
Target : -
Stop : -
Last week’s rally to 1.3224 adds credence to our bullish view that recent upmove from 1.2774 is still in progress and upside bias remains for further gain to 1.3225-30, then towards 1.3250, however, loss of near term upward momentum should prevent sharp move beyond latter level and price should falter below recent high at 1.3269, bring retreat later.
In view of this, would not chase this rise at current level and would be prudent to buy cable on subsequent pullback as 1.3120-25 should limit downside. Only below 1.3082 (previous resistance turned support) would abort ad suggest top is possibly formed, risk test of 1.3062 but reckon support at 1.3033 would hold.
Trade Idea Wrap-up: EUR/USD – Hold long entered at 1.1985
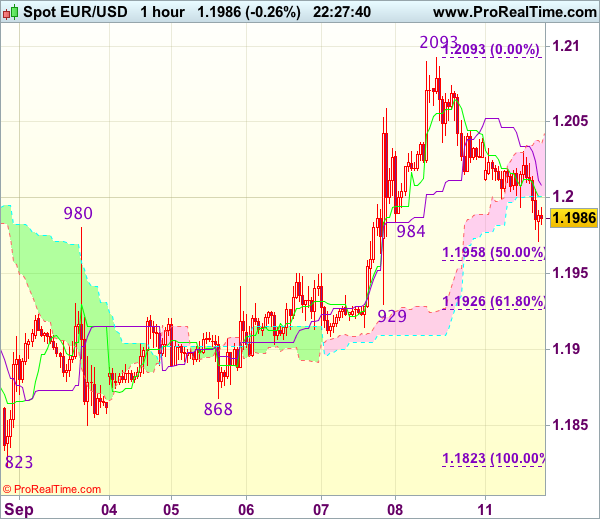
EUR/USD - 1.1984
Most recent candlesticks pattern : N/A
Trend : Up
Tenkan-Sen level : 1.2001
Kijun-Sen level : 1.2008
Ichimoku cloud top : 1.2035
Ichimoku cloud bottom : 1.2001
Original strategy :
Bought at 1.1985, Target: 1.2090, Stop: 1.1950
Position : - Long at 1.1985
Target : - 1.2090
Stop : - 1.1950
New strategy :
Hold long entered at 1.1985, Target: 1.2090, Stop: 1.1950
Position : - Long at 1.1985
Target : - 1.2090
Stop : - 1.1950
Euro’s retreat after rising to 1.2093 late last week suggests consolidation below this level would be seen and marginal weakness from here cannot be ruled out, however, reckon downside would be limited and bring another rise later, above 1.2030 would suggest an intra-day low is formed, bring test of 1.2070-75, break there would signal the pullback from 1.2093 has ended, then retest of this resistance would follow but break there is needed to extend recent upmove towards 1.2150-55 (61.8% projection of 1.1119-1.1910 measuring from 1.1662).
In view of this, we are holding on to our long position entered at 1.1985. Below 1.1950 (previous resistance turned support) would signal a temporary top is formed instead bring weakness to 1.1925-30 first.
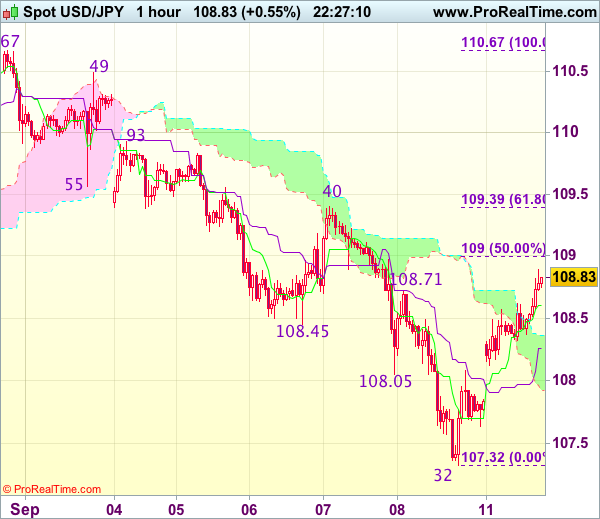
Trade Idea Wrap-up: USD/JPY – Sell at 109.35
USD/JPY - 108.85
Most recent candlesticks pattern : N/A
Trend : Down
Tenkan-Sen level : 108.61
Kijun-Sen level : 108.26
Ichimoku cloud top : 108.36
Ichimoku cloud bottom : 107.92
Original strategy :
Sell at 109.35, Target: 108.35, Stop: 109.70
Position : -
Target : -
Stop : -
New strategy :
Sell at 109.35, Target: 108.35, Stop: 109.70
Position : -
Target : -
Stop : -
As the greenback opened higher today and has edged higher, suggesting near term upside risk remains for the rebound from last week’s low of 107.32 to extend gain to 109.00 (50% Fibonacci retracement of 110.67-107.32), however, still reckon upside would be limited to 109.39-40 (61.8% Fibonacci retracement and previous resistance) and bring retreat later, below the Kijun-Sen (now at 108.26) would suggest the rebound from 107.32 has possibly ended but break of 107.60-65 is needed to confirm and bring retest of 107.32.
In view of this, we are still looking to sell dollar on further recovery as 109.35-40 should limit upside, bring retreat later. Above 109.55 would defer and signal low has been formed, bring a stronger rebound towards resistance at 108.93 which is likely to hold from here due to near term overbought condition.
Dollar Rebounds. USD/JPY Takes the Lead
- European equity indices (+1%) and US stock-index futures rallied as investors sought risk assets after a feared missile launch from North Korea never materialized and Irma was downgraded. Treasuries, gold and the yen dropped.
- ECB Coeuré said that the exchange rate doesn't weigh on growth the way it once did, offering some comfort to those worried about whether a strong currency would undermine the eurozone's growth outlook.
- Euro bulls, who have a pretty good year so far, are positioning for further gains, with long bets sitting at their highest level in six years. Speculators were holding the biggest net long position on the euro against the dollar since May 2011 ahead of last week's ECB meeting, according to data from the US Commodity Futures Trading Commission.
- Britain faces a chaotic exit from the EU if lawmakers vote against legislation designed to sever political, financial and legal ties with the bloc, Britain's Brexit minister David Davis said before a key parliamentary vote.
- China is reversing a range of measures it had put in place to support its currency, a response to a recent surge in the value of the yuan that has hurt Chinese exporters and added to the country's economic headwinds. Starting today, the PBoC scraps a two-year-old rule that made it more expensive for traders to bet the yuan will fall in value.
Rates
US yields retest lost support
Global core bonds lost ground today. The majority of the losses occurred in the opening, though the decline accelerates at the start of US dealings following a sideways European session. Investors were anxious ahead of the weekend because of uncertainty surrounding North Korea (ICBM test on founding day?) and hurricane Irma. The worst case scenario was twice avoided, triggering a turn in risk sentiment. Second tier eco calendars on both sides of the Atlantic played no role. ECB Coeure said that ECB policy will remain accommodative for longer than in previous cases of demand shocks, likely limiting the negative impact of the euro's appreciation. His comments suggest that the ECB isn't too worried about the rise of the euro (go ahead for policy normalisation), but markets didn't react. Upcoming US supply weighted on US Treasuries as well. The US Treasury starts its mid-month refinancing operation tonight with a $24B 3-yr Note auction. Currently, the WI trades around 1.43%. The auction is followed by a $20B 10-yr Note auction tomorrow and a $12B 30-yr Bond auction on Wednesday.
At the time of writing, US yields increase by 4 bps (2-yr) to 6.6 bps (10-yr). The US 30-yr yield trades back above last week's broken support (2.68%) while the US 5-yr yield (1.7%) and US 10-yr (2.1%) are currently testing similar levels. A rebreak would imply that we've entered a sort of consolidation phase near the current lows. The German yield curve bear steepens with yields 1.2 bps (2-yr) to 2.7 bps (30-yr) higher. On intra-EMU bond markets, 10-yr yield spread changes range between -1 bp and +1 bp.
Currencies
Dollar rebounds. USD/JPY takes the lead
Investors left their defensive bias from the end last week as the damage of hurricane Irma might be less than feared. Core/USD yields and the dollar reversed a small part of last week's slide. However, the (technical) picture hasn't changed in any profound way. Recent lows of the dollar remain nearby. EUR/USD tries to return below the 1.20 barrier. USD/JPY is changing hands in the 108.85 area.
Risk sentiment improved materially in Asia this morning. The damage of Hurricane Irma is very substantial, but markets assume that the impact on the US economy is manageable. The tensions between the US and North Korea are not out of the way, but the impact on markets ebbed away. US bond yields opened higher, easing some pressure on the dollar after last week's sell-off. USD/JPY returned north of 108. The gains of the dollar against the euro were modest with EUR/USD trading in the low 1.20 area.
European markets joined the global post-weekend equity rebound. However, the impact on core bonds and on the dollar remained limited. ECB's Coeure elaborated on the value of the euro. He sees the recent rise as no immediate source of concern as it is supported by a recovery in domestic demand. At the same time, he warned that a rise of the euro due to an exogenous shocks could lead to an unwarranted tightening of momentary conditions. The reaction of the euro to Coeure's comments was negligible. EUR/USD held a tight intraday range close to, mostly just north of 1.20. The yield differential between the dollar and the euro widened at the open but stabilized soon. USD/JPY also didn't make further progress despite the overall positive risk sentiment.
US yields and the dollar tried to extend their rise at the start of US trading. EUR/USD initially struggled to break below 1.20, but trades currently in the 1.1975 area. USD/JPY made some further headway and trades at around 108.85. The dollar moves a bit further away from last week's lows, but it's too early to cry victory on a USD comeback. The extremes in USD/JPY and in particular in EUR/USD remain within reach if the newsflow would again turn USD-negative.
GBP well bid as BoE meeting looms
Since end August, sterling succeeded a good rebound against the euro and the dollar. This trend continued. Admittedly, additional sterling gains were modest today. The debate on the UK Brexit law continues, but provided little impetus for sterling. Later this week, the focus for sterling trading might gradually turn to the UK eco data (including the CPI tomorrow and labour market data on Wednesday) and the BoE policy decision on Thursday. Prepositioning on a slightly less dovish BoE perhaps kept sterling well bid. EUR/GBP trades in the 0.9080 area. Cable hovers near the 1.32 big figure.
Dow Future Jumped Near 22000 Mark
Dow Jones future contract for September delivery jumped near 22000 mark after Wall Street opened higher on Monday. US stocks received strong support on easing fears over North Korea and weakening of Hurricane Irma, which did not have expected catastrophic impact, as it was expected.
The Dow is establishing in fresh direction to the upside after being entrenched within the range in past three days. Also, two long-legged Dojis, left in past two days, confirmed strong indecision. Fresh rally broke above 21921 (Fibo 61.8% of 22131/21580 pullback signals that corrective phase may be over. Confirmation of such scenario requires close above 21921 pivot, as fresh acceleration higher also broke above the upper boundary of triangular consolidation, developed on pullback from 22131 peak.
Next barriers lay at 22000 (Fibo 76.4%) and 22035 (01 Sep Shooting Star high) break of which would open way for retest of new all-time high at 22131 (posted on 08 Aug) and possible extension towards Fibo projection at 22341 on break.
Larger bulls which were on hold on recent corrective pullback are regaining traction and underpinned by newly formed daily Tenkan-sen/Kijun-sen bull-cross.
Broken Fibo 61.8% barrier now acts as initial support at 21921, followed by rising daily Tenkan-sen (21869) also today's low.
Res: 22000; 22035; 22066; 22131
Sup: 21921; 21869; 21845; 21741
Canada: Home Starts Surprise to the Upside in August, as Ontario Homebuilding Rebounds
Canadian housing starts ticked up a hair (+1k) to 223k in August, well above expectations for a pull-back to 216k. This marks the third consecutive month of increases and the second highest level since March's blockbuster quarter-million print.
The single family segment (-2k) pulled back a touch while multifamily (+4k) homebuilding in large CMAs experienced an uptick on the month. Rural homebuilding was largely unchanged (-400) .
Provincially, the gains were all in Ontario (+16k), which had the second best month since January, while Quebec (+500) was largely flat. On the other hand, B.C. (-8k), Prairies (-3k) and Atlantic Canada (-1.5k) saw slower pace of homebuilding. In the Prairies, the losses in Alberta were nearly offset by gains in the other two provinces, while in Atlantic Canada the declines were across the board.
Activity in Toronto, the country's most closely-watched housing market, rose by nearly 10k to 54k - the fastest pace in a year and a half. On the other hand, starts in other major metros were mostly lower, with Vancouver and Montreal both down 7k to 21k and 14k, respectively.
Key Implications
This was a good report that suggests that the Canadian housing market remains quite strong after the wobble it suffered in the second quarter and the uncertainty of regulatory changes in Ontario and rising interest rates. In fact, the August print marks the second best month this year while the six-month moving average is nearing the 220k mark - the fastest pace since late-2012.
Ontario was behind much of the weakness in during Q2 after the provincial Fair Housing Plan, which implemented a broad set of policies designed to remove some froth from the market, injected significant uncertainty, and motivated homebuilders to sit back as the market digested the newly implemented policies. At this point, it would appear as if they're done sitting back, with strong demand owing to a robust economy motivating builders to ramp up production to compensate for the Q2 slowdown, and making Ontario the source of strength in the third quarter
All in all, we expect Canadian housing starts to remain relatively healthy in the coming months, but begin to trend lower as the effects of rising interest rates (another BoC hike likely later this year) and potential new regulation (the new B20 guidelines) gradually take a bite out of demand. Ultimately, starts should hold near the current levels in the next month or two, but trend towards the 200k level into early-2018 and fall below that threshold the year after.
Elliott Wave Analysis: USDCAD and Gold Intra-day View
Good day traders! Let's take a better look at USDCAD and Gold.
USD is looking for some support today, now also moving up against commodity currencies, as metals and oil prices come lower. We are looking at USDCAD which can be moving up now within wave 4 bounce that can face limited upside this week around 1.2238.
USDCAD, 1H
Decline on gold is quite sharp from end of last week; it looks impulsive so we are wondering if deeper correction is in play. Ideally that's wave A as part of a wave 4. If we are on the right track then there is room for a drop down to 1310/1315 this week, but after a short-term rally up in wave B.
GOLD, 1H
GBP/JPY Mid-Day Outlook
Daily Pivots: (S1) 141.52; (P) 142.03; (R1) 142.73; More
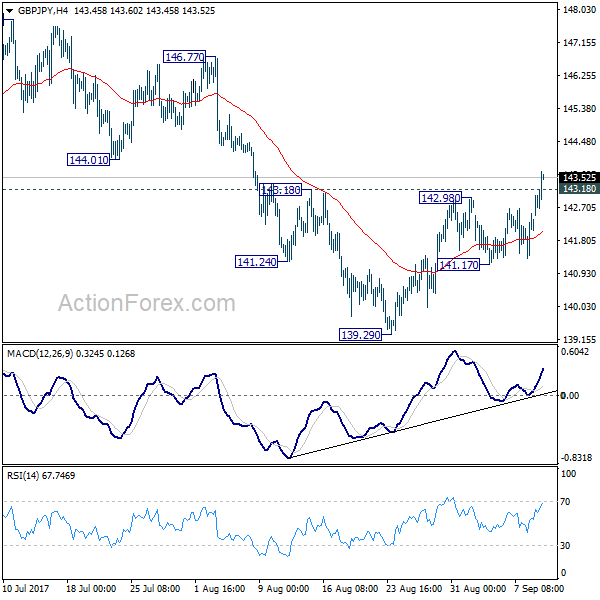
The break of 143.18 resistance in GBP/JPY indicates that fall from 147.76 has completed at 139.29 already, on bullish convergence condition in 4 hour MACD. Intraday bias is now turned back to the upside for 147.76/148.42 resistance zone. Overall, price actions from 148.42 are seen as a sideway consolidation pattern. Break of 141.17 support will turn bias to the downside and bring another fall. But downside should be contained by 135.58 cluster support to bring rebound.
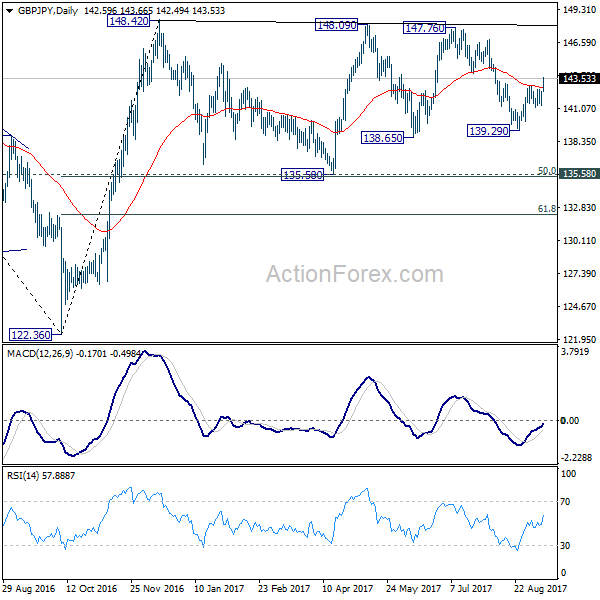
In the bigger picture, the sideway pattern from 148.42 is still unfolding. In case of deeper fall, we'd expect strong support from 135.58 and 50% retracement of 122.36 to 148.42 at 135.39 to contain downside. Medium term rise from 122.36 is expected to resume later. And break of 38.2% retracement of 196.85 to 122.36 at 150.43 will carry long term bullish implications. However, firm break of 135.58/39 will dampen the bullish view and turn focus back to 122.36 low.
Trade Idea: EUR/GBP – Sell at 0.9130
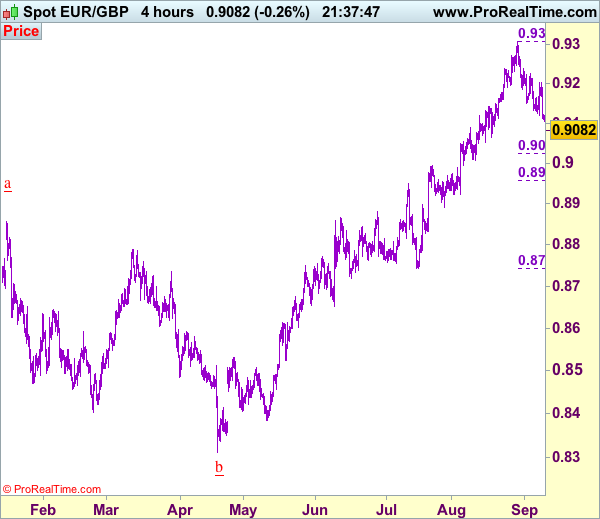
EUR/GBP - 0.9081
Original strategy :
Sell at 0.9200, Target: 0.9060, Stop: 0.9240
Position : -
Target : -
Stop : -
New strategy :
Sell at 0.9130, Target: 0.9000, Stop: 0.9170
Position : -
Target : -
Stop : -
As the single currency has fallen again after brief recovery, adding credence to our view that the fall from 0.9307 is still in progress and mild downside bias remains for this move from temporary top of 0.9307 to bring retracement of recent upmove to 0.9050 (61.8% Fibonacci retracement of 0.8892-0.9307), then towards 0.9025 (50% Fibonacci retracement of 0.8743-0.9307), however, near term oversold condition should prevent sharp fall below support at 0.9008l and price should stay well above 0.8955-60 (61.8% Fibonacci retracement), bring rebound later.
In view of this, we are inclined to sell euro on recovery as 0.9130-35 should limit upside. Above 0.9160-70 would defer and risk rebound to resistance at 0.9203, break there would suggest low is formed instead, bring a stronger rebound to 0.9235-40 but price should falter well below said resistance at 0.9307.
Our preferred count is that, after forming a major top at 0.9805 (wave V), (A)-(B)-(C) correction is unfolding with (A) leg ended at 0.8400 (A: 0.8637, B: 0.9491 and 5-waver C ended at 0.8400. Wave (B) has ended at 0.9413 and impulsive wave (C) has either ended at 0.8067 or may extend one more fall to 0.8000 before prospect of another rally. Current breach of indicated resistance at 0.9043 confirms our view that the (C) leg has ended and bring stronger rebound towards 0.9150/54, then towards 0.9240/50.