Sample Category Title
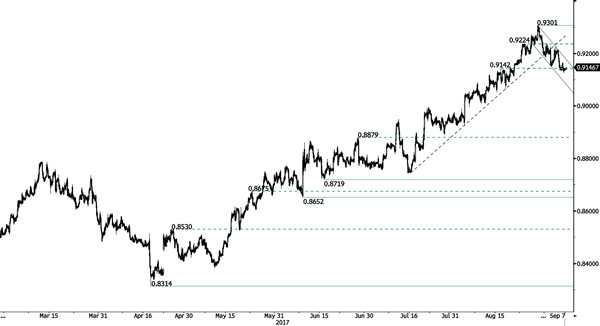
EUR/GBP Consolidating
EUR/GBP has consolidating near the support at 10.9142. However, as long as prices remain below the resistance at 0.9176 (declining trendline), the short-term technical structure is biased to the downside. Hourly support is given at 0.9141 (07/09/2017). Resistance lies at 0.9176 then 0.9306 (29/07/2017 high).
In the long-term, the pair has largely recovered from recent lows in 2015. The technical structure suggests a growing upside momentum. The pair is trading above from its 200 DMA. Strong resistance can be found at 0.9500 (psychological level).
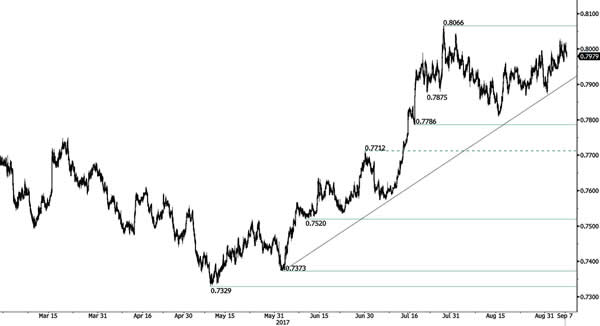
AUD/USD Drifting Higher
AUD/USD continue to trade above rising trendline. Hourly support can be found at 0.7946 (05/09/2017 low). Strong resistance is given at 0.8066 (27/07/2017 high). Expected to further consolidate.
In the long-term, the trend is largely negative since 2011. Key supports stands at 0.6009 (31/10/2008 low) . A break of the key resistance at 0.8295 (15/01/2015 high) is needed to invalidate our long-term bearish view.
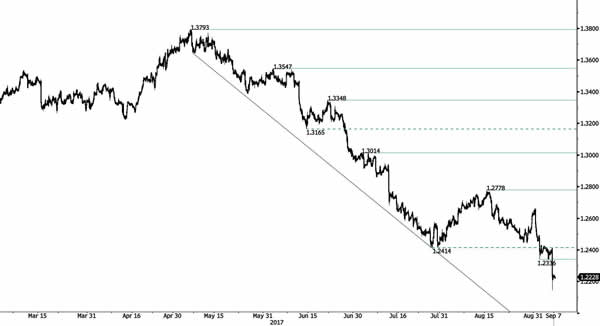
USD/CAD Moving Lower
USD/CAD is moving lower, confirming an underlying declining trend. Hourly support is located at 1.2146 (intraday low). Resistance is now given at a distance at 1.2778 (15/08/2017 low). Expected to show continued short-term bearish pressures if resistance at 1.2778 holds.
In the longer term, the pair has broken longterm support that can be found at 1.2461 (16/03/2015 low). Strong resistance is given at 1.4690 (22/01/2016 high). The pair is likely to head further lower.
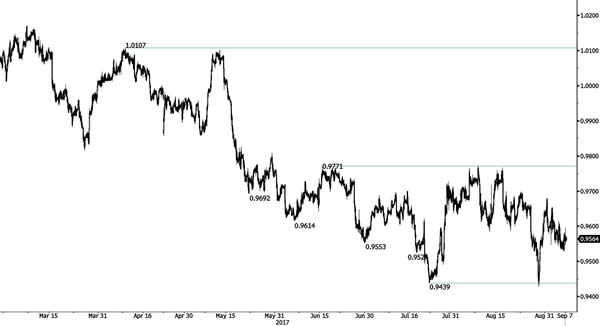
USD/CHF Trying To Bounce
USD/CHF is trying to bounce. Strong resistance is given at 0.9771 (15/06/2017 high). The pair is likely to head further lower below 0.9500. Expected to show renewed bearish pressures.
In the long-term, the pair is still trading in range since 2011 despite some turmoil when the SNB unpegged the CHF. Key support can be found 0.8986 (30/01/2015 low). The technical structure favours nonetheless a long term bullish bias since the unpeg in January 2015.
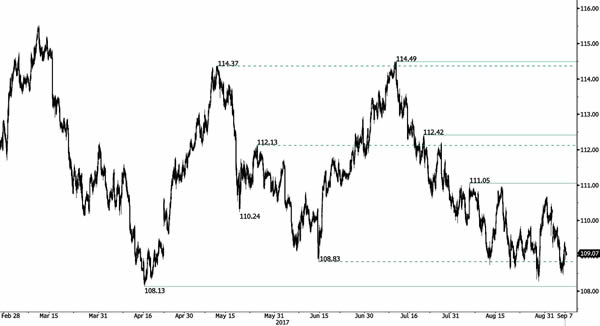
USD/JPY Bouncing
USD/JPY moving lower confirming persistant selling pressure. The pair has failed to test resistance at 111.05 (04/08/2017 high). Support is located at 108.13 (14/06/2017 low). Expected to show further downside pressures.
We favor a long-term bearish bias. Support is now given at 99.02 (10/08/2013 low). A gradual rise towards the major resistance at 125.86 (05/06/2015 high) seems unlikely. Expected to decline further support at 93.79 (13/06/2013 low).
GBP/USD Monitor The Key Resistance At 1.3069
GBP/USD is recovering after its recent massive sell-off. Monitor the key resistance at 1.3069 (rising trendline). Hourly support is given at 1.2774 (24/08/2017 high). Expected to show short-term bullish pressures.
The long-term technical pattern is even more negative since the Brexit vote has paved the way for further decline. Long-term support can be found at 1.1841 (07/10/2017 low). Long-term resistance is given around 1.35 and would indicate a long-term reversal in the negative trend. Yet, it is very unlikely at the moment.

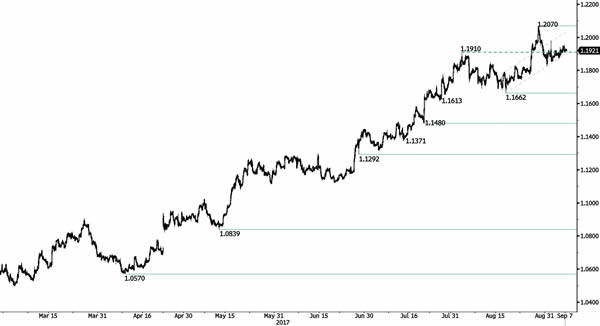
EUR/USD Drifting
EURUSD has drifted higher above the support at 1.1910. However, as long as prices remain above the resistance at 1.1840 (rising trendline), the short-term technical structure is biased to the downside. Hourly resistance can be found at 1.2070 (29/08/2017 high) while hourly support lies at 1.1820 (31/08/2017 low). Stronger support is given at a distance at 1.1662 (17/08/2017 low). Expected to show renewed bullish pressures.
In the longer term, the momentum is now turning largely positive. We favour a continued bullish bias. Key resistance is holding at 1.2252 (25/12/2014 high) while strong support lies at 1.0341 (03/01/2017 low).
Elliott Wave Analysis: EURUSD And USDCHF Intra-Day View
Market is awaiting ECB press conference when Draghi may bring more news about QE tapering. What can be really important for todays price action is that ECB does not like strong EUR, which means that any comments on that topic can be bearish for EURUSD ticker. Technically, we definitely expect lower EURUSD because of that five wave decline from the highs and a three wave rise, so there is room for a drop to 1.1770, especially once 1.1866 is broken.
EURUSD, 1H
In fact, there are more USD pairs that suggests stronger US currency in the near-term. USDCHF per example has a nice pattern; a five wave bounce followed by a three wave set-back so uptrend may resume back to 0.9700.
USDCHF, 1H
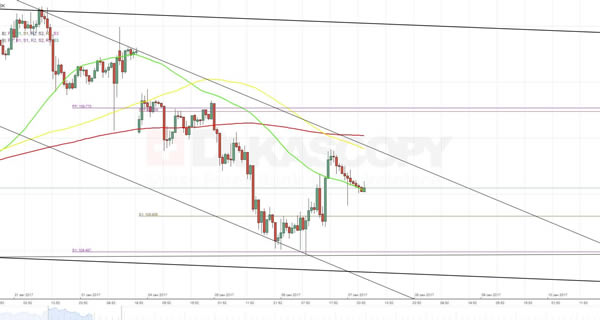
XAUUSD Analysis: Moves Along 100-Hour SMA
Instead of trying to reach the monthly R1 at 1,348.36, using the 55-hour SMA as a springboard, the exchange rate stuck at the weekly R1 at 1,339.42 and stayed there until a release of data on the US ISM Non-Manufacturing PMI. The American figures appeared to be positive and dragged the pair down by 0.5%. Fortunately for the gold, the 100-hour SMA managed to neutralize the further fall. For this reason, the yellow metal has a good basis to try to get back at least to the above weekly R1.
On the other hand, there is a need to take into account that below the 100-hour SMA there is an empty zone up until the junior ascending channel’s bottom trend-line and the 200-hour SMA.
USDJPY Analysis: Rebounds From Monthly S1 At 108.48
In accordance with expectations, most of the previous trading day the currency rate spent in an upward movement, using the weekly and monthly S1, as trampolines. Despite such rebound, the further road to the north is still obstructed by the 100- and 200-hour SMAs and then by the weekly and monthly PP. For this reason, today the pair is expected to resume the fall and once again to try to break through the above weekly S1 at 108.80. In the meantime, there is a need to take into account a certain effect that might appear after publication of data on the Japan’s Final GDP at 23:50 GMT. Finally, there is also a need to remember that the rate is simultaneously moving in a senior descending channel and still hasn’t formed a new reaction low.