Sample Category Title
Technical Outlook: WTI Oil May Come Under Pressure On Fears Of Hurricane Irma Impact, Rising Oil Inventories
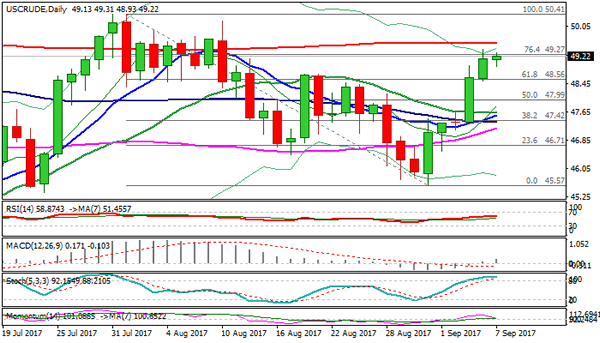
WTI oil price is consolidating in early Thursday’s trading after strong bullish acceleration in past two days peaked at $49.40.
Strong recovery rally from $45.57 low retraced 76.4% of $50.41/$45.57 pullback, as oil price received strong boost on increased demand after Texas refineries were restarted.
Technical studies on daily chart are in strong bullish setup but overbought slow stochastic suggests oil price may show hesitation ahead of key barriers at $49.65 (200SMA) and psychological $50.00 barrier.
Oil is awaiting release of EIA crude stocks data today (release was delayed for one day due to US Labor Day holiday on Monday) which may pressure the oil price as forecast for today shows a build of oil inventories by 4 million barrels after series of strong draws in previous few weeks.
On the other side, release of API crude stocks data on Tuesday showed build of 2.8 million barrels last week, compared to forecasted build of 4.0 million barrels.
Rising oil inventories signal lower price and the oil price may come under increased pressure on rising fears on impact from Hurricane Irma which is approaching the US coast and may interrupt oil shipments in and out the US.
Session low at $48.93 marks initial support followed by former highs at $48.72 and broken Fibo 61.8% barrier at $48.56.
Res: 49.40, 49.65, 50.00, 50.20
Sup: 48.93, 48.72, 48.56, 47.89
Technical Outlook: AUDUSD – Extended Hesitation At 0.8000 But Bulls Remain Intact
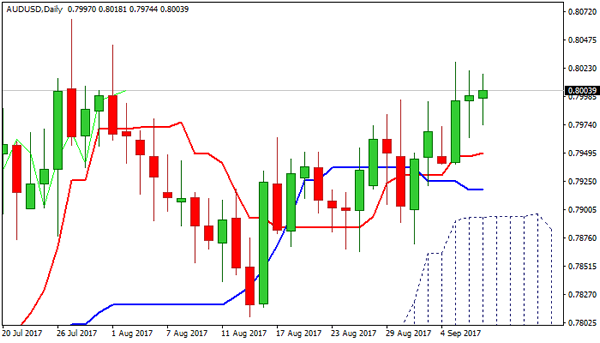
The Aussie dollar remains bid but show strong hesitation at 0.8000 resistance which was dented on Tue/Wed's spikes to 0.8028/20 but so far without close above. In addition, long-legged Doji that was left on Wednesday supports the notion. The pair came under pressure overnight after Australian Retail Sales miss (0.0% in July vs 0.3% forecast) but dips were limited so far at 0.7974, keeping intact rising 10SMA (currently at 0.7960) which marks initial support. Daily techs are in full bullish setup and supportive for further advance, but close above 0.8000 is required to generate bullish signal for extension towards key barrier at 0.8065 (23 July new 26-month high) and extension of broader uptrend on break. On the other side, repeated failure at 0.8000 would risk extended consolidation which needs to hold above 0.7960/50 supports (10SMA/daily Tenkan-sen) and keep immediate bulls intact. Otherwise, break lower would signal recovery stall and stronger pullback which would expose daily Kijun-sen (0.7918) and daily cloud top (0.7894)
Res: 0.8028, 0.8042, 0.8065, 0.8100
Sup: 0.7974, 0.7960, 0.7950, 0.7918
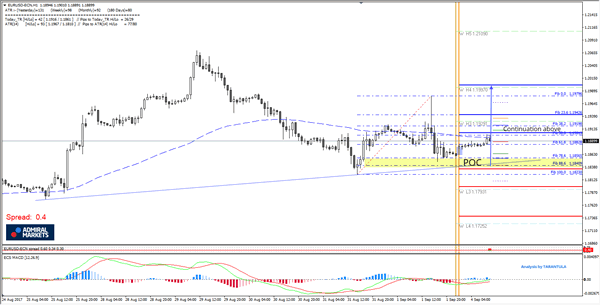
Daily Technical Analysis: USDCAD Down After An Unexpected Rate Hike
As we have seen tightening in the US by the Fed over the past year, there usually is a correlation with other Western economies following the US lead in returning Monetary Policy to historical levels. In this case, the BoC had increased their rate for the second time in recent months largely following an improvement in GDP Growth, along with price stability in their major export Oil and Gas. Needless to say, BoC is somewhat hamstrung with its ability to continue hiking due to its high household debt levels along with real estate prices in Toronto having dropped 20% since April 2017.
At this point the USD/CAD is trapped below the POC zone 1.2308-1.2336 (order block, trend line, D H3, W L3, 61.8, EMA89) and we could see another rejection if the price retraces to the zone. The MACD is way below the 0 line, while histograms are up so we might see a retracement. However 4h or strong 1h candle close below 1.2148 should target 1.2070 that is a both a weekly and daily support.
W L3 - Weekly Camarilla Pivot (Weekly Interim Support)
W H3 - Weekly Camarilla Pivot (Weekly Interim Resistance)
W H4 - Weekly Camarilla Pivot (Strong Weekly Resistance)
D H4 - Daily Camarilla Pivot (Very Strong Daily Resistance)
D L3 – Daily Camarilla Pivot (Daily Support)
D L4 – Daily H4 Camarilla (Very Strong Daily Support)
POC - Point Of Confluence (The zone where we expect price to react aka entry zone)
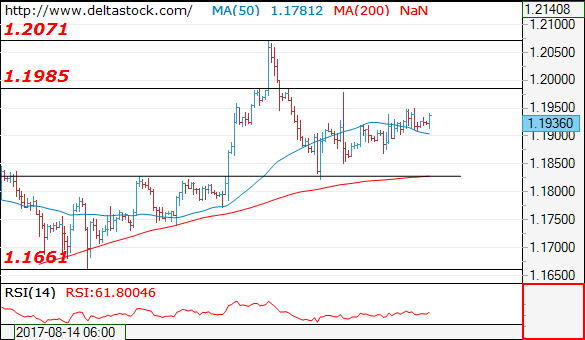
Forex Technical Analysis: EUR/USD, USD/JPY, GBP/USD
EUR/USD
Current level - 1.1936
The intraday bias is slightly positive, for a test of 1.1985 resistance area and the latter is expected to cap the upside, for another leg downwards, to 1.1830. A violation of the latter will challenge 1.1660.
| Resistance | Support | ||
| intraday | intraweek | intraday | intraweek |
| 1.1980 | 1.2070 | 1.1830 | 1.1830 |
| 1.2070 | 1.2160 | 1.1740 | 1.1660 |
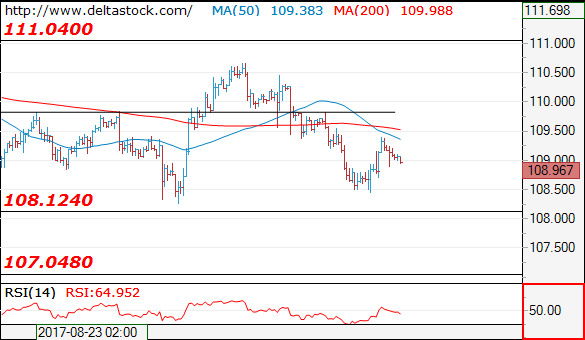
USD/JPY
Current level - 108.96
Current rebound should be considered corrective, preceding a break through 108.10, towards 107.00 area. Initial intraday resistance lies at 109.80.
| Resistance | Support | ||
| intraday | intraweek | intraday | intraweek |
| 109.80 | 111.00 | 108.10 | 108.10 |
| 110.60 | 112.20 | 108.10 | 107.00 |
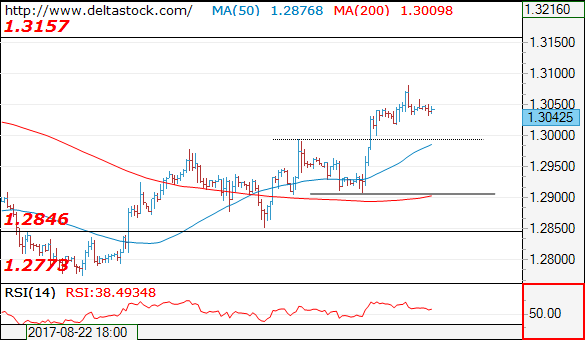
GBP/USD
Current level - 1.3042
The bias is still positive above 1.2990, for a possible test of 1.3150 area. Crucial on the downside is 1.2910 is a violation of that area will challenge 1.2770 low again.
| Resistance | Support | ||
| intraday | intraweek | intraday | intraweek |
| 1.3080 | 1.3157 | 1.2990 | 1.2773 |
| 1.3157 | 1.3260 | 1.2907 | 1.2606 |
EUR Strengthens Ahead Of ECB Meeting
Euro traps Draghi
Investors are bracing for an event heavy day. The highlight will clearly be the European central banks. However, the substantives information on monetary policy strategy path from this meeting is unlikely. We had originally penciled in a comments outlining the path towards normalization. The recent strength in Euro will keep the ECB focused on exchange rates and likely water down any discussion on extension of the Asset Purchase Program. While economic data has improved significantly in the EU, a slight delay to measure the market’s reaction to any Fed actions won’t meaningfully risk a surge in inflation outlook.
Yet, titillating the markets with hints of cutting QE purchases (even buffered with minimal extension) could send EURUSD back above 1.20. We don’t think Draghi will take the risk. There is a case that Draghi is only delaying the inevitable and should start announce an QE extension today to prepare the market for eventual trimming of size. Markets will likely dissect every sentence causing EUR vol to increase, but the longer-term outlook indicates that the ECB need to start tighten policy. The Euro has become less sensitive to short-end yield movements; beneficial yields spread will send EURUSD higher. Europe has enjoyed the benefits of a weaker Euro, judging from the improvement in German industrial production (4.0% from 2.7% y/y) exports will need to adjust to a strong Euro moving forward.
Long SEK Riksbank delay
Elsewhere the Riksbank will keep to the sidelines in their rate decision today. Sweden central banks is likely to prefer to let the ECB to move first on normalization. The Riksbank today will likely copy Draghi trick of balancing acknowledging stronger economic growth without shifting policy strategy. However, as with Euro traders the market sis not fooled by the delay. Sweden’s above trend in growth and inflations indicates that policy needs to tighten. In addition, as with the ECB asset purchase program technicalities could be actually preventing the Riksbank from purchasing more assets. Any suggestion that market liquidity could handle further intervention would be a marginally dovish outcome and negative SEK. However, most logical path for the Riksback are slow and steady removal of emergence measures and strong SEK.
Donald and Democrats deal
Finally, Wall Street is celebrating the removal of the immediate threat of the debt ceiling. However, the real news was Trump working with Democrats with a clear success. In rare bipartisan deal Trump, republicans with democrats extended the U.S. debt limit and provide government funding until Dec. 15th. Should the Republican-led Congress pass the bill, the 3-month deal would prevent an extraordinary default on U.S. government debt, preserve the government funded for the fiscal year starting Oct. 1. This was a massive first step. True it was clipped to a money for victims of Hurricane Harvey but still. The path towards meaningful tax reform just got a little less steep (an potentially other stimulus). As a desk we were early to write off the Trump pro-growth, reflation story, however a shift to the center, highlighted by this 3-month extension, could the start of something real. A unified US government could have profound effects on our market outlook.
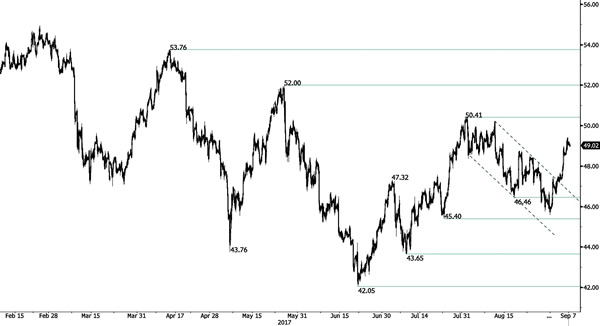
CRUDE OIL Drifting Higher
Crude oil is showing further buying interest since bouncing off key support at 45.40. Strong resistance can be found at 50.41 (31/07/2017). Hourly support is given at 45.40 (17/08/2017 high). Expected to show continued short-term bearish move.
In the long-term, crude oil has recovered after its sharp decline last year. However, we consider that further weakness are very likely. Strong support lies at 35.24 (05/04/2016) while resistance can now be found at 55.24 (03/01/2017 high).
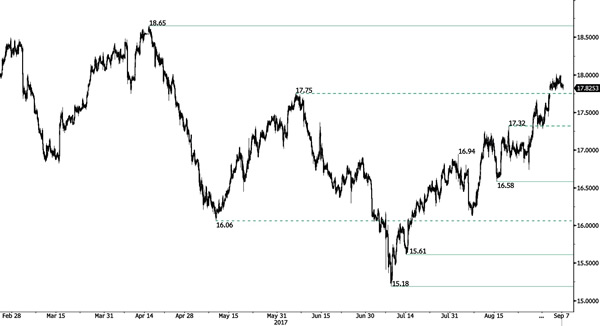
SILVER Pause
Silver has broken its key resistance at 17.75 opening the way for a test of the strong resistance at 18.65 (17/04/2017 high) while support can be found at 16.58 (15/08/2017 high). The commodity lies in an uptrend channel. Expected to show another leg higher.
In the long-term, the trend is rater negative. Further downsides are very likely. Resistance is located at 25.11 (28/08/2013 high). Strong support can be found at 11.75 (20/04/2009).
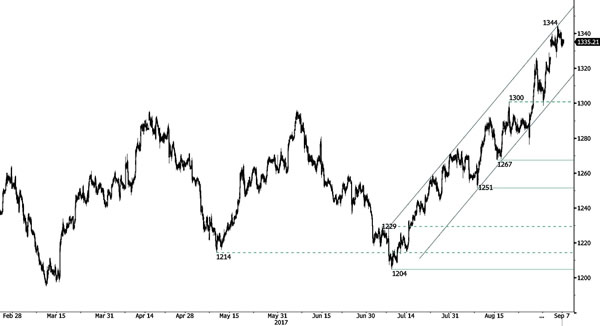
GOLD Pullback
Gold failed to break rising trendline. Hourly support is given at a distance 1326 (gap low). Stronger support lies at 1204 (10/07/2017 high). Expected to show continued increase.
In the long-term, the technical structure suggests that there is a growing upside momentum. A break of 1392 (17/03/2014) is necessary ton confirm it, A major support can be found at 1045 (05/02/2010 low)
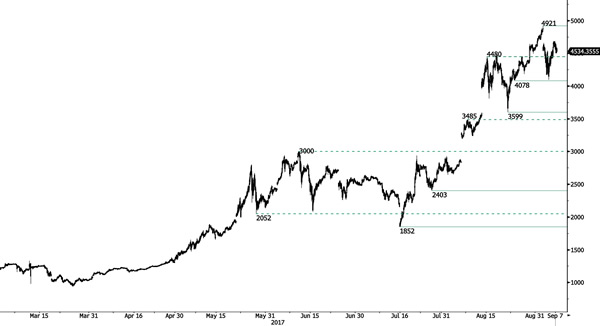
BITCOIN Recovery Bounce Stalled
Bitcoin has set a new all-time high but since declined confirming increasing selling pressures. However, technical picture remain bullish as long as key support hold. Monitor the key support at 4478. Strong support lies very far at 3599 (22/08/2017 low). Key resistance can be located at 4921.
In the long-term, the digital currency has had an exponential growth. There are decent likelihood that the asset will reach $10'000.
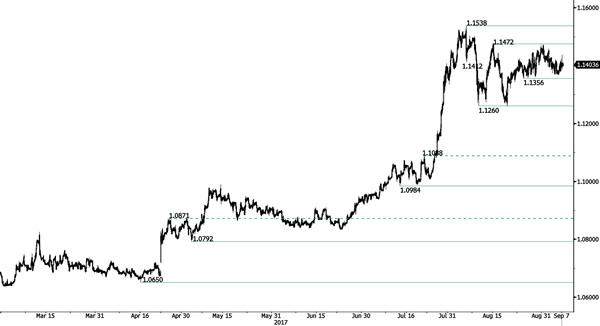
EUR/CHF Bouncing
EUR/CHF showing increasing short-term buying interest near the key support at 1.1356 Hourly resistance lies at 1.1538 (04/08/2017 high). Hourly support is located at 1.1362 (25/08/2017 base low). Expected to show further bearishness.
In the longer term, the technical structure has reversed. Strong resistance is given at 1.20 (level before the unpeg). Yet, the ECB's QE programme is likely to cause persistent selling pressures on the euro, which should weigh on EUR/CHF. Supports can be found at 1.0184 (28/01/2015 low) and 1.0082 (27/01/2015 low).