Sample Category Title
USD/CHF Mid-Day Outlook
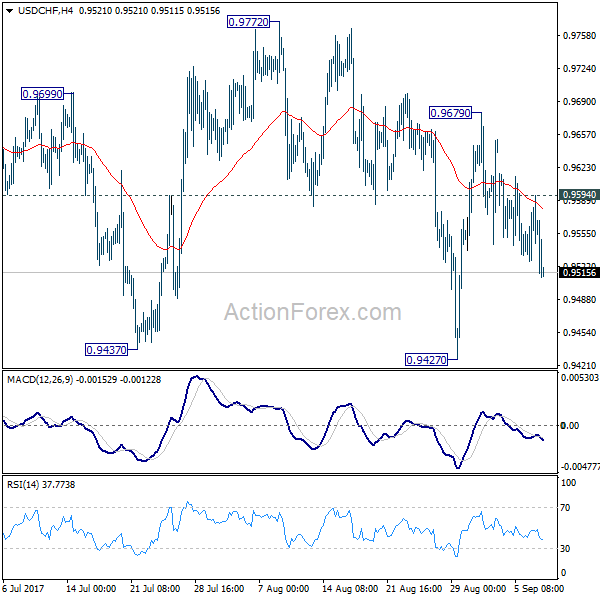
Daily Pivots: (S1) 0.9535; (P) 0.9559; (R1) 0.9590; More....
USD/CHF's break of 0.9527 minor support suggests that fall from 0.9679 is going to extend lower. Intraday bias is turned back to the downside for 0.9427 low. Break of 0.9427 will resume whole decline from 1.3042. On the upside, above 0.9594 minor resistance will turn intraday bias neutral again. Also, noted that USD/CHF is close to to 0.9443 key support, consolidation from 0.9427 might extend further. But still, break of 0.9772 resistance is needed to confirm near term reversal. Otherwise, outlook stays bearish for another decline.
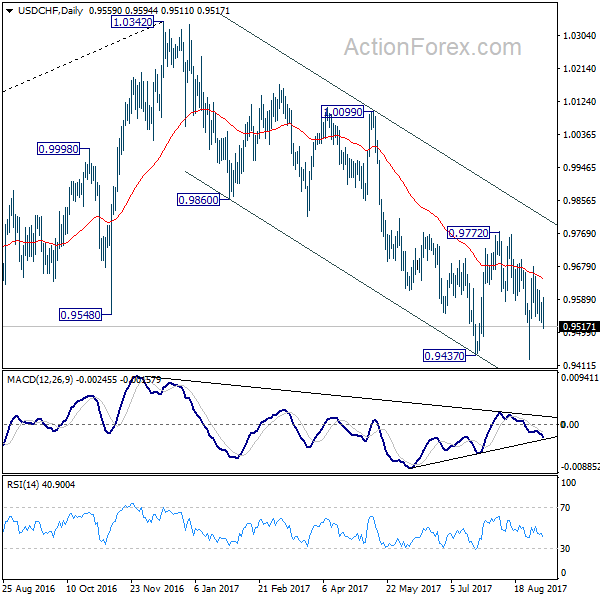
In the bigger picture, current development suggests that 0.9443 key support (2016 low) could be taken out firmly as down trend form 1.0342 extends. There are various interpretation of the price actions. But in any case, medium term outlook will stay bearish as long as 0.9772 resistance holds. Current down trend could extend to 38.2% retracement of 0.7065 (2011 low) to 1.0342 (2016 high) at 0.9090. However, break of 0.9772 will indicate that USD/CHF has successfully defended 0.9443 again and turn outlook bullish for 1.0099 resistance.
GBP/USD Mid-Day Outlook
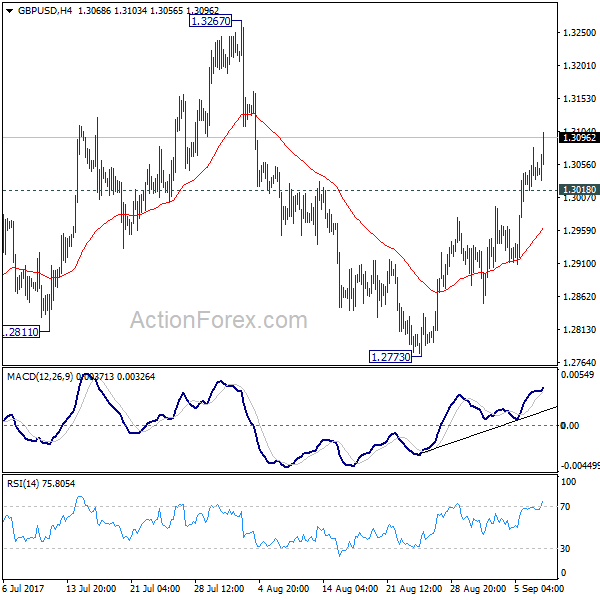
Daily Pivots: (S1) 1.3013; (P) 1.3047; (R1) 1.3077; More...
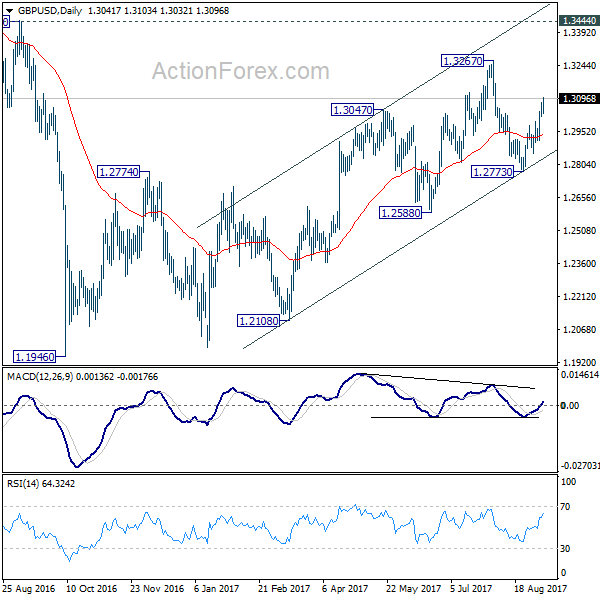
GBP/USD's rebound from 1.2773 extends to as high as 1.3103 so far today. Intraday bias remains on the upside for 1.3267 resistance. Break will target 1.3444 key resistance level next. Price actions from 1.1946 are still seen as a corrective pattern. Hence, we'd expect strong resistance from 1.3444 to limit upside to bring larger down trend reversal eventually. On the downside, below 1.3018 minor support will turn intraday bias neutral first.
In the bigger picture, overall, price actions from 1.1946 medium term low are seen as a corrective pattern. While further rise cannot be ruled out, larger outlook remains bearish as long as 1.3444 key resistance holds. Down trend from 1.7190 (2014 high) is expected to resume later after the correction completes. And break of 1.2588 will indicate that such down trend is resuming.
USD/JPY Mid-Day Outlook
Daily Pivots: (S1) 108.65; (P) 109.02; (R1) 109.60; More...
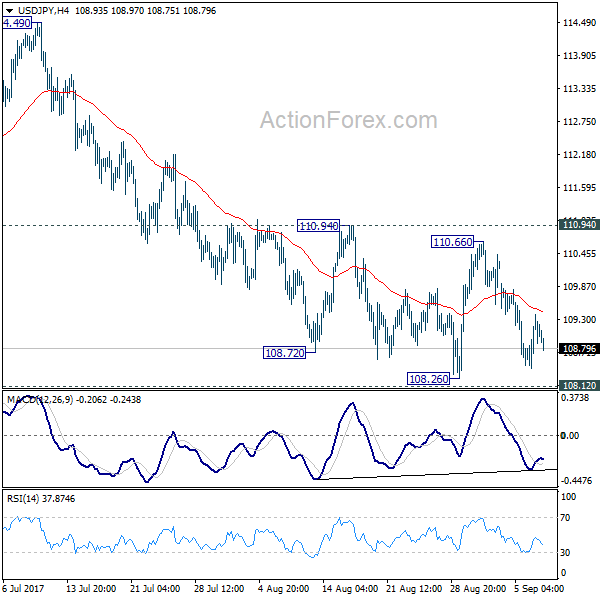
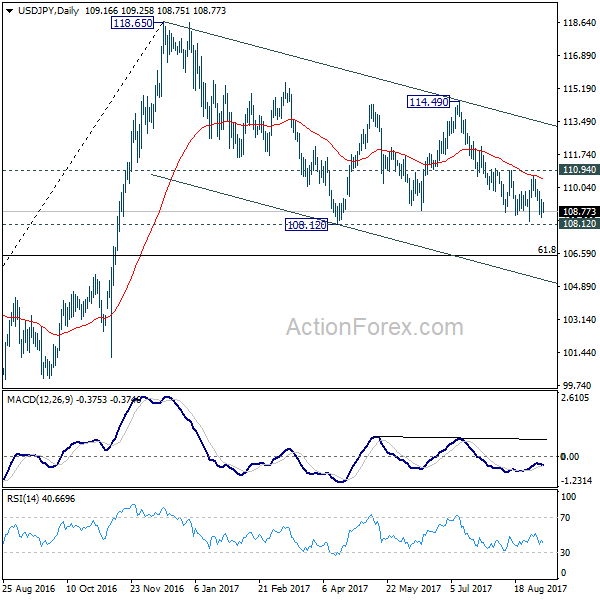
Intraday bias in USD/JPY remains neutral for the moment and more consolidations could be seen. But still, in any case, outlook will remain cautiously bearish as long as 110.94 resistance holds. On the downside, decisive break of 108.12 will resume the whole corrective decline from 118.65. Next target will be 61.8% retracement of 98.97 to 118.65 at 106.48.
In the bigger picture, the corrective structure of the fall from 118.65 suggests that rise from 98.97 is not completed yet. Break of 118.65 will target a test on 125.85 high. At this point, it's uncertain whether rise from 98.97 is resuming the long term up trend from 75.56, or it's a leg in the consolidation from 125.85. Hence, we'll be cautious on topping as it approaches 125.85. If fall from 118.65 extends lower, downside should be contained by 61.8% retracement of 98.97 to 118.65 at 106.48 and bring rebound.
(ECB) Introductory Statement to the Press Conference
Mario Draghi, President of the ECB,
Vítor Constâncio, Vice-President of the ECB,
Frankfurt am Main, 7 September 2017
Ladies and gentlemen, the Vice-President and I are very pleased to welcome you to our press conference. We will now report on the outcome of today's meeting of the Governing Council.
Based on our regular economic and monetary analyses, we decided to keep the key ECB interest rates unchanged. We expect them to remain at their present levels for an extended period of time, and well past the horizon of our net asset purchases. Regarding non-standard monetary policy measures, we confirm that our net asset purchases, at the current monthly pace of €60 billion, are intended to run until the end of December 2017, or beyond, if necessary, and in any case until the Governing Council sees a sustained adjustment in the path of inflation consistent with its inflation aim. The net purchases are made alongside reinvestments of the principal payments from maturing securities purchased under the asset purchase programme.
The incoming information, including our new staff projections, confirms a broadly unchanged medium-term outlook for euro area economic growth and inflation. The economic expansion, which accelerated more than expected in the first half of 2017, continues to be solid and broad-based across countries and sectors. At the same time, the recent volatility in the exchange rate represents a source of uncertainty which requires monitoring with regard to its possible implications for the medium-term outlook for price stability.
While the ongoing economic expansion provides confidence that inflation will gradually head to levels in line with our inflation aim, it has yet to translate sufficiently into stronger inflation dynamics. Measures of underlying inflation have ticked up slightly in recent months but, overall, remain at subdued levels. Therefore, a very substantial degree of monetary accommodation is still needed for underlying inflation pressures to gradually build up and support headline inflation developments in the medium term. If the outlook becomes less favourable, or if financial conditions become inconsistent with further progress towards a sustained adjustment in the path of inflation, we stand ready to increase our asset purchase programme in terms of size and/or duration. This autumn we will decide on the calibration of our policy instruments beyond the end of the year, taking into account the expected path of inflation and the financial conditions needed for a sustained return of inflation rates towards levels that are below, but close to, 2%.
Let me now explain our assessment in greater detail, starting with the economic analysis. Euro area real GDP increased by 0.6%, quarter on quarter, in the second quarter of 2017, after 0.5% in the first quarter. Survey data point to continued broad-based growth in the period ahead. Our monetary policy measures are supporting domestic demand and have facilitated the deleveraging process. Private consumption is underpinned by employment gains, which are also benefiting from past labour market reforms, and by increasing household wealth. The recovery in investment continues to benefit from very favourable financing conditions and improvements in corporate profitability. Moreover, the broad-based global recovery will support euro area exports.
This assessment is broadly reflected in the September 2017 ECB staff macroeconomic projections for the euro area. These projections foresee annual real GDP increasing by 2.2% in 2017, by 1.8% in 2018 and by 1.7% in 2019. Compared with the June 2017 Eurosystem staff macroeconomic projections, the outlook for real GDP growth has been revised up for 2017, reflecting the recent stronger growth momentum, and is broadly unchanged thereafter.
Risks surrounding the euro area growth outlook remain broadly balanced. On the one hand, the current positive cyclical momentum increases the chances of a stronger than expected economic upswing. On the other hand, downside risks continue to exist, primarily relating to global factors and developments in foreign exchange markets.
Euro area annual HICP inflation was 1.5% in August. Looking ahead, on the basis of current futures prices for oil, annual rates of headline inflation are likely to temporarily decline towards the turn of the year, mainly reflecting base effects in energy prices. At the same time, measures of underlying inflation have ticked up moderately in recent months, but have yet to show convincing signs of a sustained upward trend. Domestic cost pressures, notably from labour markets, are still subdued. Underlying inflation in the euro area is expected to rise gradually over the medium term, supported by our monetary policy measures, the continuing economic expansion, the corresponding gradual absorption of economic slack and rising wages.
This assessment is also broadly reflected in the September 2017 ECB staff macroeconomic projections for the euro area, which foresee annual HICP inflation at 1.5% in 2017, 1.2% in 2018 and 1.5% in 2019. Compared with the June 2017 Eurosystem staff macroeconomic projections, the outlook for headline HICP inflation has been revised down slightly, mainly reflecting the recent appreciation of the euro exchange rate.
Turning to the monetary analysis, broad money (M3), despite some monthly volatility, continues to expand at a robust pace, with an annual rate of growth of 4.5% in July 2017, after 5.0% in June. As in previous months, annual growth in M3 was mainly supported by its most liquid components, with the narrow monetary aggregate M1 expanding at an annual rate of 9.1% in July 2017, down from 9.7% in June.
The recovery in the growth of loans to the private sector observed since the beginning of 2014 is proceeding. The annual growth rate of loans to non-financial corporations increased to 2.4% in July 2017, up from 2.0% in June, while the annual growth rate of loans to households remained stable at 2.6%. The pass-through of the monetary policy measures put in place since June 2014 continues to significantly support borrowing conditions for firms and households, access to financing ‒ notably for small and medium-sized enterprises ‒ and credit flows across the euro area.
To sum up, a cross-check of the outcome of the economic analysis with the signals coming from the monetary analysis confirmed the need for a continued very substantial degree of monetary accommodation to secure a sustained return of inflation rates towards levels that are below, but close to, 2%.
In order to reap the full benefits from our monetary policy measures, other policy areas must contribute decisively to strengthening the longer-term growth potential and reducing vulnerabilities. The implementation of structural reforms needs to be substantially stepped up to increase resilience, reduce structural unemployment and boost euro area growth potential and productivity. Regarding fiscal policies, all countries would benefit from intensifying efforts towards achieving a more growth-friendly composition of public finances. A full, transparent and consistent implementation of the Stability and Growth Pact and of the macroeconomic imbalances procedure over time and across countries remains essential to bolster the resilience of the euro area economy. Strengthening Economic and Monetary Union remains a priority. The Governing Council welcomes the ongoing discussions on further enhancing the institutional architecture of our Economic and Monetary Union.
We are now at your disposal for questions.
>
(ECB) Monetary Policy Decisions
At today's meeting the Governing Council of the ECB decided that the interest rate on the main refinancing operations and the interest rates on the marginal lending facility and the deposit facility will remain unchanged at 0.00%, 0.25% and -0.40% respectively. The Governing Council expects the key ECB interest rates to remain at their present levels for an extended period of time, and well past the horizon of the net asset purchases.
Regarding non-standard monetary policy measures, the Governing Council confirms that the net asset purchases, at the current monthly pace of €60 billion, are intended to run until the end of December 2017, or beyond, if necessary, and in any case until the Governing Council sees a sustained adjustment in the path of inflation consistent with its inflation aim. The net purchases are made alongside reinvestments of the principal payments from maturing securities purchased under the asset purchase programme. If the outlook becomes less favourable, or if financial conditions become inconsistent with further progress towards a sustained adjustment in the path of inflation, the Governing Council stands ready to increase the programme in terms of size and/or duration.
The President of the ECB will comment on the considerations underlying these decisions at a press conference starting at 14:30 CET today.
CAC Gains Ground Despite Dovish ECB Statement
The CAC index has posted considerable gains in the Thursday session, continuing the upward movement which we saw on Wednesday. Currently, the index is at 5,136.50, up 0.69% on the day. On the release front, France's trade deficit widened to EUR 6.0 billion, much higher than the estimate of EUR 4.5 billion. Eurozone Revised GDP rose 0.6% in the second quarter, matching the estimate. The ECB held interest rates at 0.00%, and the rate statement indicated that the ECB would maintain its asset purchases program. On Friday, France releases the Government Budget Balance and Industrial Production.
The ECB rate statement was more dovish than expected, surprising many analysts. The ECB said that it was maintaining its quantitative easing program to December, adding that it could increase purchases if necessary. The statement said that if the economic outlook became "less favourable", the bank was prepared to increase QE in terms of size or duration. Given that the eurozone economy has rebounded in 2017, there were expectations that the ECB would take a more hawkish stance, and hint at a tapering of QE in early 2018. The ECB has yet to decide what to do next, and analysts do not expect the details of the new program to be announced until October or possibly December. ECB policymakers must weigh competing interests – Germany would like nothing more than the ECB to simply exit the program, which was brought in as an emergency measure to begin with. However, France and other eurozone members, which are not enjoying German-style growth, favor a gradual tapering of the program, perhaps lowering monthly asset purchases from EUR 60 billion to EUR 45 billion. The markets will be monitoring ECB President Mario Draghi's follow-up press conference, looking for some details about its plans for the QE program.
Britain's departure from the European Union promises to have a significant impact on the Eurozone financial sector, and stock markets will also be affected. One issue under discussion relates to clearing houses based in Britain, specifically over euro-denominated trades. The European Commission is working on a draft law that would see joint supervision between the EU and Britain over such transactions, but France wants the European Securities and Markets Authority (ESMA) to have greater authority, such as a veto, over these transactions. This is one more example of the immense difficulty in untangling the British financial sector from the continent, and there will likely be intense wrangling between the two sides at the Brexit negotiations, as Britain tries to minimize the damage to London, which is set to lose its status as the premier financial hub in Europe.
GBP/USD Strongly Bullish
GBP/USD edges higher on the Daily chart and is expected to reach new upside targets very soon. Price increases as the USDX drop aggressively again and approach the 91.64 previous low. The index will drop towards fresh new lows if will close below the mentioned static support.
USDX is trading in the red ahead of the ECB and ahead of the high impact US data. The greenback needs a strong support from the United States economy to be able to climb higher and to recover after the immense drop.
The ECB Press Conference will have an impact on the USD as well, a dovish speech will boost the USD and will punish the Euro. We'll have to be patient to see what impact will have the US figures, the Unemployment Claims could increase from 236K to 245K in the previous week, the Revised Nonfarm Productivity may increase by 1.3% in the second quarter, beating the 0.9% estimate, while the Revised unit Labor Costs indicator is expected to increase by 0.3%.
Price goes higher as expected, the perspective is bullish and should hit new highs in the upcoming days. The next upside target will be at the first warning line (wl1) of the minor ascending pitchfork, where he may find temporary resistance again. We have a breakout underway, has managed to pass beyond the 1.3046 level, signaling that the buyers are very strong.
USD/CHF On A Declining Path
USD/CHF extends the bearish movement as the dollar index drops further. Price is going down after the retest of the warning line (up sloping red line) and the 0.9634 level. Now is approaching the 0.9498 static support, a valid breakdown will confirm a drop towards the lower median line (lml) of the descending pitchfork and towards the 0.9440 horizontal downside obstacle. Only a rebound will send it towards the median line (ml) again.
EUR/CHF Another Breakout Attempt
EUR/CHF resumed the yesterday's bullish candle and climbed above the WL2 and the WL4, but failed to stay there. Price had lost altitude in the last hours, so a false breakout will signal an overbought and a potential drop at least till will reach the upper median line (uml).
I've said in another article that the rate could resume the upside movement if will jump and will stabilize above the 1.1415 level.
US: Debt Limit Fight Postponed amid Increased Fed Uncertainty
- Yesterday was a very eventful day, as Donald Trump struck a deal with the Democrats on Harvey aid, government funding until December and a suspension of the debt limit until mid-December.
- In our view, this is just kicking the can down the road, as we now risk a government shutdown in December and/or a government default at some pint early next year.
- Yesterday, the Fed's Vice Chair Stanley Fischer announced that he will step down on or around 13 October, leaving four empty seats in the Board of Governors.
- The Wall Street Journal reports that President Trump is unlikely to nominate Gary Cohn as the next Fed Chair. This has increased the probability of the reappointment of Janet Yellen but Trump is known for wanting his own people in key positions.
- The many empty seats mean that it is difficult to say what direction the Fed will take next year. The Republicans may use the opportunity to shift the Fed in a more hawkish and rule-based direction.
Debt limit suspended until mid-December
Despite Republican House Speaker Paul Ryan saying that the Democratic proposal to suspend the debt limit for months was 'ridiculous and disgraceful', President Trump sided with the Democrats. This means that we now have a bipartisan deal on Harvey aid, funding for the government for three months and a suspension of the debt limit until mid-December. The deal came earlier than we had expected, as we thought (in line with Republican members of Congress) the Trump administration would be willing to fight harder for a longer lasting solution to the debt limit. Basically, the deal means the risk of a government shutdown has only been postponed from the end of this month to December. Republicans still need a budget for the fiscal year 2018 (lasting from 1 October 2017 to 30 September 2018), eventually allowing them to avoid filibusters in the Senate through budget reconciliation. However, the main problem for the Republicans remains the internal disagreement between the fiscal hawks and the more moderate Republicans. The former, unlike the latter, wants to make major cuts in fiscal spending.
While the suspension of the debt limit expires in mid-December, the stricter deadline is likely some months afterwards, as the Treasury can now 'refill' some of the extraordinary measures it has exhausted in recent months. This means there is still a risk of a government default at some point in 2018. It is not an option only to increase the Treasury's cash buffer at the Federal Reserve, as it needs to be back at the current level when the suspension of the debt limit expires in mid-December.
The suspension of the debt limit also means that the US Treasury can increase its debt issuance again.
Vice Chair Fischer steps down, four out of seven seats are now vacant
In addition, Fed Vice Chair Stanley Fischer has written a resignation letter to President Trump due to personal circumstances. Fischer will step down on or around 13 October, leaving four vacant seats at the Fed. While this move caught everyone by surprise, most believed Trump would not reappoint Fischer anyway when his term expired in June next year, so markets barely moved on the announcement.
With four out of seven seats at the Fed Board of Governors currently vacant - and possibly soon five, as it is not our base case that Trump will reappoint Janet Yellen as Fed Chair (see more below) - Trump has the power to shape the Federal Reserve in the way he wants (although the Senate has to approve his nominations). This makes it more difficult to say what the Fed will do next year, as it is difficult to say in which direction the Fed will go. Trump has not said much about monetary policy but he has said a few mutually contradicting things: (1) he says he wants higher rates but is a 'low interest rate guy' and (2) he says a strong USD is a sign of strength but that a weak USD is good for US exports. In other words, it is difficult to say whether the Fed will turn more hawkish or more dovish, as Trump does not really seem interested in monetary policy, as he thinks of economic policy in terms of trade policy and tax reform/deregulation/infrastructure investments. While President Trump does not seem very interested in monetary policy and the Fed, the Republican Party certainly is, as many Republicans are dissatisfied with the Fed's low-rate policy. Many Republicans want a more rule-based Fed, which bases its monetary policy decisions on a policy rule. Based on a simple Taylor rule, which links the Fed funds rate to inflation and unemployment, the Fed funds rate should be around 3% now. In other words, we might see a more hawkish and rule-based Fed next year but the uncertainty is high. For more, see what we wrote back in February: Research US: Trump to nominate three Fed governors - Tarullo resigns, 13 February. Overall, it seems fair to say, the Fed's independence may come under greater pressure.
Trump has already nominated Randal K. Quarles, as former Treasury Department official, to serve as Fed Vice Chair for Supervision (see NY Times). Quarles is considered more dovish on financial regulation than Daniel Tarullo, who was previously in charge of supervision (at least in practice).
Trump's economic adviser Gary Cohn was favourite to succeed Yellen as Fed Chair but The Wall Street Journal reports that Trump is unlikely to nominate him due to Cohn's criticism after Charlottesville. According to PredictIt, the most likely scenario is now that Yellen will be reappointed but this is not our base case.