Sample Category Title
Dovish Draghi Fooling No One
EURUSD Rallies as Draghi Leaves Tapering Door Wide Open
ECB President Mario Draghi did everything he could today to put a dovish slant on a central bank that's actively pursuing less monetary stimulus but as we've seen before, traders were not interested in what he had to say, it's what he didn't say that was important.
The euro was already rallying in the lead up to the ECBs monetary policy announcement and Draghi's press conference, displaying a confidence in how both would play out. Once again today, the ECB was keen to stress that QE could be increased in both size and duration should the economic outlook warrant it, rather than stating what is likely to happen under the current circumstances.
It's clear, as Draghi repeatedly mentioned, that policy makers are concerned about the strong and rapid appreciation that the currency has experienced, which is probably preventing them from making a tapering announcement at this time. The problem they face is, in not talking about tapering or, more importantly, suggesting that the program could be extended as it is beyond the end of the year, they are effectively confirming that tapering will happen. Or at least, that's how traders are perceiving it.
What's interesting is that, once the volatility passed – and we saw extreme volatility in the opening minutes of Draghi's press conference – the euro rallied as high as 1.2059 against the dollar, just shy of the 29 August high, before profit taking set in. The failure to make a new high is a sign of an overheated market. At the same time, the pair has since fallen back to trade below 1.20 which could be another sign that the rally has run its course for now.
Another failure to end the day above 1.20, despite having traded significantly above there on two occasions, would strongly suggest the psychological resistance is in play. Draghi may have failed to convince traders that the ECB is in fact dovish but he may have stumbled upon a natural barrier to the upside in the process, at least for now.
Yen Moves Higher as US Jobless Claims Leaps
USD/JPY has posted losses on Thursday, erasing the gains which marked the Wednesday session. In North American trade, the pair is trading at 108.70, down 0.44% on the day. In the US, unemployment claims jumped to 298 thousand, well above the estimate of 245 thousand. Later in the day, Japan releases Final GDP for the second quarter, with an estimate of 0.7%. As well, the current account surplus is expected to climb to 1.65 trillion yen.
US employment numbers continue to disappoint. Unemployment claims jumped to 298 thousand last week, the highest level since April 2015. This follows weak readings in July for nonfarm payrolls and wage growth. However, the jump in jobless claims can be attributed to Hurricane Harvey, which led to thousands of displaced workers in Texas filing for unemployment benefits. Unemployment numbers could remain high in upcoming weeks, until flooded areas are able to get on their feet and rebuilding efforts pick up steam.
The Japanese currency has enjoyed a strong start in September, gaining 1.1% against the US dollar. Much of the yen's appreciation is a direct result of the ongoing North Korean crisis, as the safe-haven yen has been in demand following missile launches by North Korea, which has raised tensions in the area. Earlier this week, the yen improved sharply following North Korea's announcement that it had tested a hydrogen bomb which could be used in a missile strike. North Korea's actions have alarmed South Korea, as well as the US and Japan, with South Korean President Moon Jae-in warning that the situation risked becoming "uncontrollable". If the situation in the Korean peninsula continues to deteriorate, jittery investors could continue to snap up the yen.
The Federal Reserve released its Beige Book report on Wednesday, and the survey found that wage pressure remains limited, despite the fact that many businesses cannot fill job openings. The lack of wage growth has been an important factor in ongoing weak inflation levels, despite moderate economic growth and a very strong labor market. Weak inflation has hampered the Fed's plans to raise interest rates a third time this year, and the odds of a December hike have dipped to just 31%, as the markets are increasingly doubtful that the Fed will make a move before next year.
Trade Idea Update: USD/CHF – Buy at 0.9465
USD/CHF - 0.9525
Original strategy :
Buy at 0.9500, Target: 0.9600, Stop: 0.9465
Position : -
Target : -
Stop : -
New strategy :
Buy at 0.9465, Target: 0.9590, Stop: 0.9430
Position : -
Target : -
Stop : -
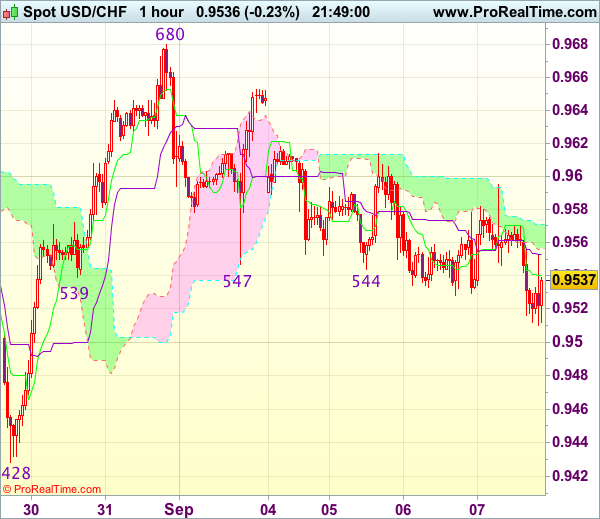
As the greenback has continued trading within familiar range, further sideways trading is in store and although initial downside risk remains for weakness to 0.9500, if our view that low has been formed at 0.9428 last week is correct, downside would be limited to 0.9460-65 and bring another rebound later. Above 0.9595-00 would suggest low is possibly formed, bring test of 0.9653-55 resistance, break there would bring another rise to 0.9680 but break there is needed to add credence to this view and extend gain to resistance at 0.9698-99.
In view of this, we are inclined to buy dollar on further subsequent decline. Below 0.9450 would risk weakness towards said support at 0.9428 but break there is needed to signal recent decline has resumed and extend further fall to 0.9390-00 first.
Trade Idea Update: GBP/USD – Buy at 1.3000
GBP/USD - 1.3084
Original strategy :
Buy at 1.2980, Target: 1.3080, Stop: 1.2945
Position : -
Target : -
Stop : -
New strategy :
Buy at 1.3000, Target: 1.3120, Stop: 1.2965
Position : -
Target : -
Stop : -
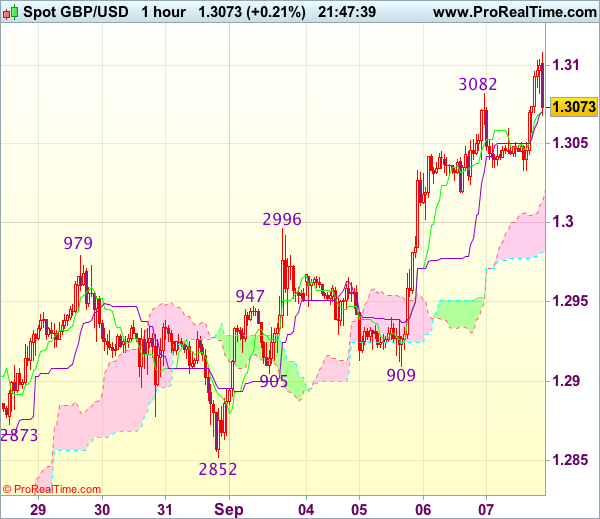
Although cable has risen again in NY morning, loss of near term upward momentum should prevent sharp move beyond 1.3140-50 and reckon 1.3175-80 would hold from here, risk from there has increased for a much needed correction to take place later today or tomorrow.
In view of this, would not chase this rise at current level and would be prudent to buy cable on subsequent pullback, below 1.3050 would bring minor correction to 1.3030-35 but reckon previous resistance at 1.2996 (now support) would limit downside and bring another rise. Only below the lower Kumo (now at 1.2983) would abort and signal top is formed instead, bring weakness to 1.2950 first.
Trade Idea Update: EUR/USD – Stand aside
EUR/USD - 1.1998
Original strategy :
Sold at 1.1980, stopped at 1.2015
Position : - Short at 1.1980
Target : -
Stop : - 1.2015
New strategy :
Stand aside
Position : -
Target : -
Stop : -
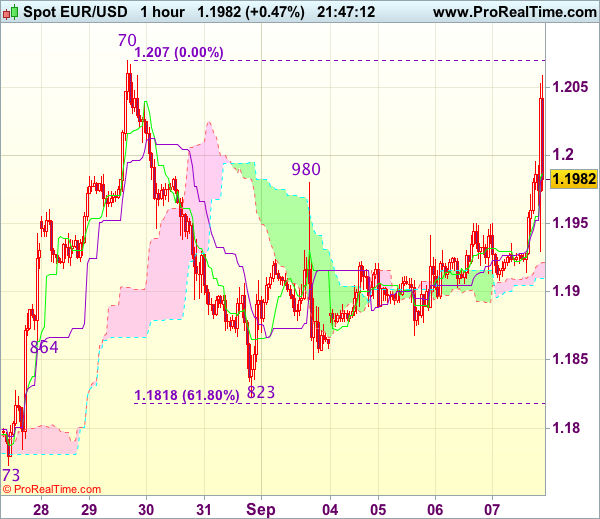
Euro’s intra-day brief rally has dampened our bearishness and gain to resistance at 1.2070 (last week’s high) cannot be ruled out, however, break there there is needed to revive bullishness and signal recent upmove has finally resumed and extend gain to 1.2100, then towards 1.2130-40 but near term overbought condition should limit upside today.
In view of this, would not chase this rise here and would be prudent to stand aside in the meantime. Below 1.1960-65 would prolong consolidation and weakness to 1.1925-30 cannot be ruled out but break there is needed to signal an intra-day high is formed, bring weakness to 1.1900, then towards 1.1865-70 later.
Trade Idea Update: USD/JPY – Sell at 109.55
USD/JPY - 108.90
Original strategy :
Sell at 109.55, Target: 108.55, Stop: 109.90
Position : -
Target : -
Stop : -
New strategy :
Sell at 109.55, Target: 108.55, Stop: 109.90
Position : -
Target : -
Stop : -
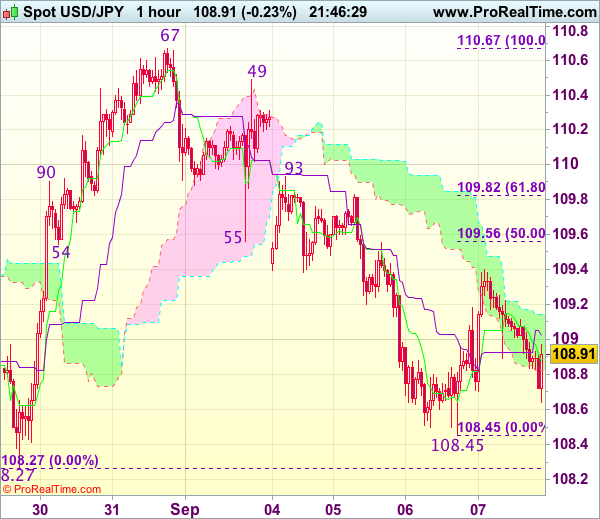
Dollar’s rebound after falling to 108.45 yesterday suggests consolidation above this level would be seen and corrective bounce to 109.40 is likely, however, reckon upside would be limited to 109.55-60 (50% Fibonacci retracement of 110.67-108.45) and bring another decline, below said support at 108.45 would extend weakness towards last week’s low at 108.27 but break there is needed to retain bearishness and extend the fall from 114.50 to another previous chart support at 108.13, having said that, the greenback needs to penetrate this chart support to confirm early selloff from 118.66 has resumed for subsequent weakness to 107.70-75 which is likely to hold from here.
In view of this, we are looking to sell dollar on further subsequent recovery as 109.55-60 should limit upside and bring another decline later. Above 109.82-83 (61.8% Fibonacci retracement of 110.67-108.45 and previous resistance) would abort and signal low is formed instead, bring a stronger rebound to 110.00-05 but price should falter well below resistance at 110.49.
Euro Surges as ECB Draghi Acknowledges “Solid and Broad-Based” Growth, Promises “Bulk of Decisions” in October
Euro jumps as ECB President Mario Draghi acknowledged in the post meeting press conference that growth in the Eurozone is solid and broad-based. At the same time Draghi also promised to "decide on the calibration" of its policy instruments beyond this Autumn. He went further to say that the "bulk of the decisions" will come at the October meeting. Regarding a recent hot topic in exchange rate, Draghi noted that a "few" members express concerned back in July. And those concerns were reiterated by "most" members this time. And recent volatility in the exchange rate is seen as a source of uncertainty that requires monitoring. Nonetheless, while financial conditions "unquestionably tightened" following Euro's rise, they remain "broadly supportive" for non-financial enterprises.
ECB left the main refinancing rate unchanged at 0.00% as widely expected. The marginal lending facility rate and deposit facility rate are held at 0.25% and -0.40% respectively. The central maintained the language in the statement that interest rates will "remain at their present levels for an extended period of time, and well past the horizon of the net asset purchases." Regarding the EUR 60b per month asset purchase program, ECB confirms that it will continue to " run until the end of December 2017, or beyond, if necessary". ECB also hold the door for further stimulus open as it noted that it "stands ready to increase the programme in terms of size and/or duration." In the latest staff economic projections, ECB lower inflation forecast for 2018 to 1.2%, down from 1.3%. For 2019, inflation is projected to be 1.5%, down from 1.6%. Nonetheless, growth forecasts for Eurozone are upgraded, at 2.2% in 2017 versus prior forecast of 1.9%. for 2018, growth is projected to be 1.8%, up fro prior forecast of 1.7%.
US jobless claims jumped sharply on Harvey impacts
US initial jobless claims jumped sharply by 62k to 298k in the week ended September 2. That's the highest level since 2015 and is way above expectation of 242k. Impacts from hurricane Harvey are the main factors driving the number higher. Initial claims would likely remain elevated in the coming weeks. But after all, it's still staying below 300k handle for the 131 straight weeks, the longest streak since early 1970s. Continuing claims dropped -5k to 1.94m in the week ended August 26. Also from US, non-farm productivity was revised up to 1.6% in Q2 while unit labor cost was revised down to 0.2%. From Canada building permits dropped -3.5% mom in July.
Yesterday, US President Donald Trump reached a short-term deal with Democrats, despite opposition from Republicans, to extend the US debt limit, providing government funding for three months until December 15. The deal would also provide financial relief to victims of Hurricane Harvey. However, the decision attracted criticism that Trump is further distancing himself from his own party, the Republicans. And some pointed out it's an act to deflect blame for the gridlock for a year. The move overruled Trump's own treasury secretary, Steven Mnuchin, who's in the middle of a proposal for long term fix to the debt ceiling problem. Also, shortly before the meeting, Republican House Speaker Paul Ryan called the Democratic proposal a "ridiculous and disgraceful" idea that would "play politics with the debt ceiling". The development will be closely watched by the markets.
European Parliament Tajani suggest to push decision on post Brexit trade talk to December
President of the European Parliament Antonio Tajani said that so far, the EU have noted "no concrete proposals have arrived regarding the three irrevocable priorities of Brexit negotiation. And, there were only "very foggy proposals". Tajani emphasized that "without an agreement on this, we cannot talk about the future." He also reiterated the three priorities as " rights for three-and-a-half million EU citizens living in the U.K.; the payment of what the EU deserves — not a euro more nor a euro less; third point, the Good Friday Agreement, that has to give us a positive solution for the border between Ulster and the Republic of Ireland." Tajani went on to said that he will ask the Council tomorrow to extend the deadline for assess whether there is sufficient progress to move on to trade agreement. Tajani would suggest to push the decision from October to December. But he also said that "we cannot postpone further than December".
Meanwhile, UK Brexit Secretary David Davis has ruled out staying in the European Economic Area or the European Free Trade Association after Brexit. David said in the House of Commons that joining EFTA would be "more complicated, more difficult and less beneficial". And, the government prefer a separate transition deal. Also, UK will not longer participate in the EEA after leaving the EU. And, "we are considering what steps if any we might take to formally confirm our withdrawal from the EEA agreement."
BoJ Kuroda front runner for next term
BoJ Governor Haruhiko Kuroda will end his five year term next March. There have been some criticism on Kuroda for being out of ideas in boosting inflation in Japan. Prime Minister Shinzo Abe's top advisor Nobuyuki Nakahara warned before that Kuroda will "fall into inertia" after being in the job for so long. But according to a Bloomberg survey of economist done between August 21 and 25, Kuroda is still the front runner for the job by a market. Respondents assigned a score of 68 out of 100 for Kuroda. The next is Deputy Governor Hiroshi Nakaso at 34/100, and then Columbia University Professor Takatoshi Ito at 30/100.
Elsewhere
Swiss foreign currency reserves rose to CHF 717b in August. German industrial production rose 0.0% mom in July. Japan leading index dropped to 105 in July. Australia retail sales rose 0.0% mom in July, below expectation of 0.2% mom. Trade surplus narrowed to AUD 0.46b in July.
EUR/USD Mid-Day Outlook
Daily Pivots: (S1) 1.1897; (P) 1.1923 (R1) 1.1944; More...
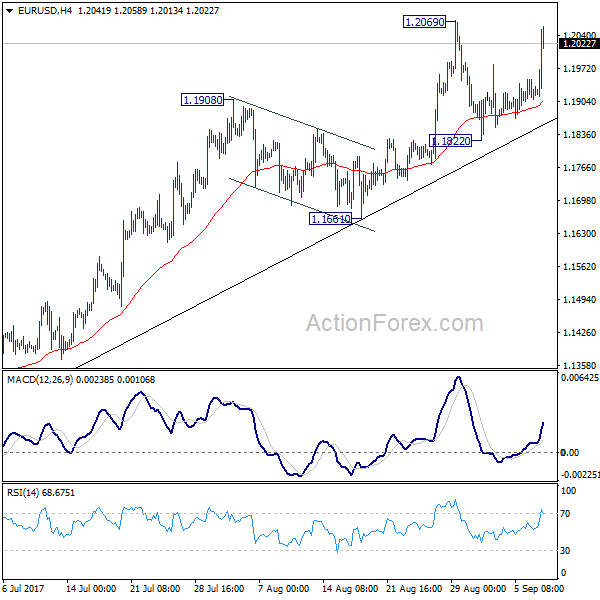
EUR/USD jumps sharply in early US session but it's staying below 1.2069 resistance so far. Intraday bias remains neutral and more consolidations could be seen. Another fall cannot be ruled out yet as the consolidation extends. But after all, there is no clear sign of trend reversal yet. Outlook will remain bullish as long as 1.1661 holds. Break of 1.2069 will extend larger rise from 1.0339 to next key fibonacci level at 1.2516.
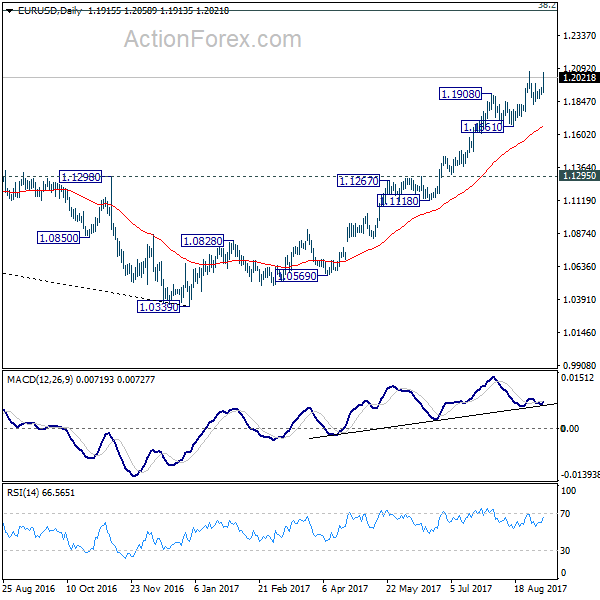
In the bigger picture, an important bottom was formed at 1.0339 on bullish convergence condition in weekly MACD. Sustained trading above 55 month EMA (now at 1.1774) will pave the way to key fibonacci level at 38.2% retracement of 1.6039 (2008 high) to 1.0339 (2017 low) at 1.2516. While rise from 1.0339 is strong, there is no confirmation that it's developing into a long term up trend yet. Hence, we'll be cautious on strong resistance from 1.2516 to limit upside. For now, medium term outlook will remain bullish as long as 1.1295 support holds, in case of pull back.
Economic Indicators Update
| GMT | Ccy | Events | Actual | Forecast | Previous | Revised |
|---|---|---|---|---|---|---|
| 01:30 | AUD | Retail Sales M/M Jul | 0.00% | 0.20% | 0.30% | 0.20% |
| 01:30 | AUD | Trade Balance (AUD) Jul | 0.46B | 0.95B | 0.86B | 0.89B |
| 05:00 | JPY | Leading Index Jul P | 105 | 105.1 | 105.9 | |
| 06:00 | EUR | German Industrial Production M/M Jul | 0.00% | 0.60% | -1.10% | |
| 07:00 | CHF | Foreign Currency Reserves Aug | 717B | 714B | 715B | |
| 11:45 | EUR | ECB Rate Decision | 0.00% | 0.00% | 0.00% | |
| 12:30 | EUR | ECB Press Conference | ||||
| 12:30 | CAD | Building Permits M/M Jul | -3.50% | -1.00% | 2.50% | |
| 12:30 | USD | Initial Jobless Claims (SEP 02) | 298K | 242k | 236k | |
| 12:30 | USD | Non-Farm Productivity Q2 F | 1.50% | 1.20% | 0.90% | |
| 12:30 | USD | Unit Labor Costs Q2 F | 0.20% | 0.40% | 0.60% | |
| 14:00 | CAD | Ivey PMI Aug | 61.3 | 60 | ||
| 14:30 | USD | Natural Gas Storage | 30B | |||
| 15:00 | USD | Crude Oil Inventories | -5.4M |
EUR/USD Mid-Day Outlook
Daily Pivots: (S1) 1.1897; (P) 1.1923 (R1) 1.1944; More...
EUR/USD jumps sharply in early US session but it's staying below 1.2069 resistance so far. Intraday bias remains neutral and more consolidations could be seen. Another fall cannot be ruled out yet as the consolidation extends. But after all, there is no clear sign of trend reversal yet. Outlook will remain bullish as long as 1.1661 holds. Break of 1.2069 will extend larger rise from 1.0339 to next key fibonacci level at 1.2516.
In the bigger picture, an important bottom was formed at 1.0339 on bullish convergence condition in weekly MACD. Sustained trading above 55 month EMA (now at 1.1774) will pave the way to key fibonacci level at 38.2% retracement of 1.6039 (2008 high) to 1.0339 (2017 low) at 1.2516. While rise from 1.0339 is strong, there is no confirmation that it's developing into a long term up trend yet. Hence, we'll be cautious on strong resistance from 1.2516 to limit upside. For now, medium term outlook will remain bullish as long as 1.1295 support holds, in case of pull back.
USD/CHF Mid-Day Outlook
Daily Pivots: (S1) 0.9535; (P) 0.9559; (R1) 0.9590; More....
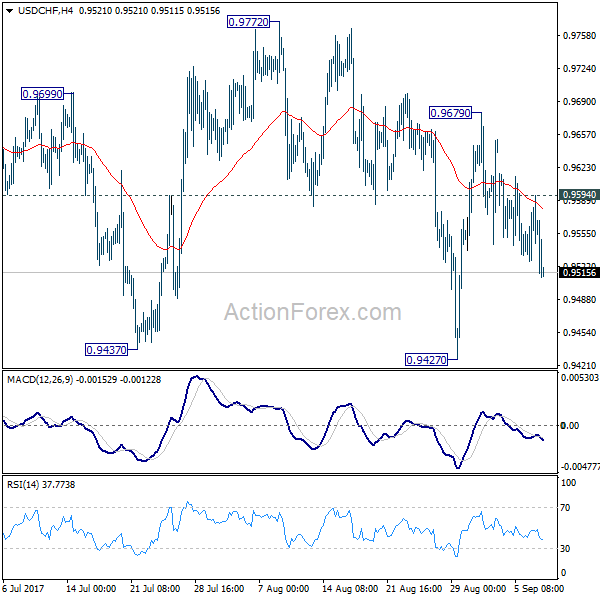
USD/CHF's break of 0.9527 minor support suggests that fall from 0.9679 is going to extend lower. Intraday bias is turned back to the downside for 0.9427 low. Break of 0.9427 will resume whole decline from 1.3042. On the upside, above 0.9594 minor resistance will turn intraday bias neutral again. Also, noted that USD/CHF is close to to 0.9443 key support, consolidation from 0.9427 might extend further. But still, break of 0.9772 resistance is needed to confirm near term reversal. Otherwise, outlook stays bearish for another decline.
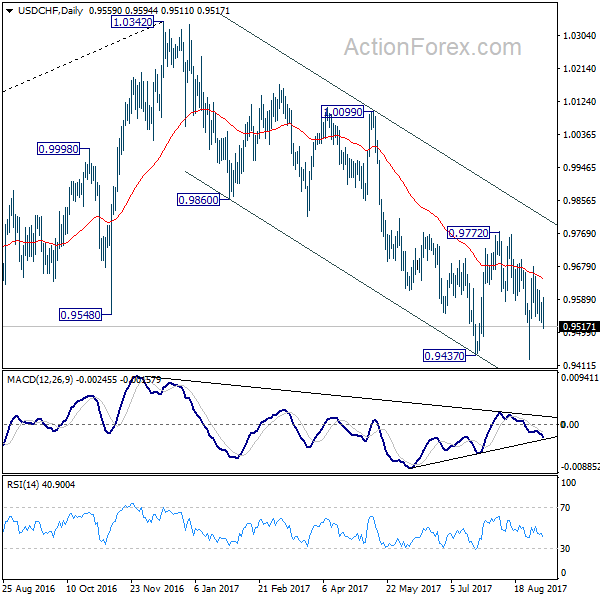
In the bigger picture, current development suggests that 0.9443 key support (2016 low) could be taken out firmly as down trend form 1.0342 extends. There are various interpretation of the price actions. But in any case, medium term outlook will stay bearish as long as 0.9772 resistance holds. Current down trend could extend to 38.2% retracement of 0.7065 (2011 low) to 1.0342 (2016 high) at 0.9090. However, break of 0.9772 will indicate that USD/CHF has successfully defended 0.9443 again and turn outlook bullish for 1.0099 resistance.
GBP/USD Mid-Day Outlook
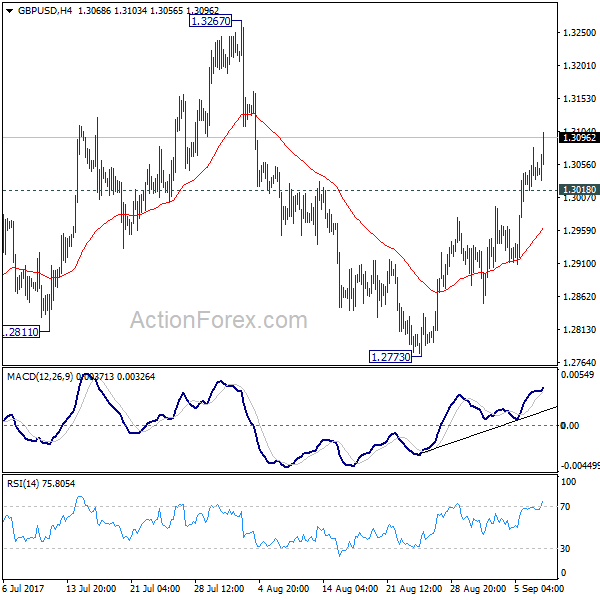
Daily Pivots: (S1) 1.3013; (P) 1.3047; (R1) 1.3077; More...
GBP/USD's rebound from 1.2773 extends to as high as 1.3103 so far today. Intraday bias remains on the upside for 1.3267 resistance. Break will target 1.3444 key resistance level next. Price actions from 1.1946 are still seen as a corrective pattern. Hence, we'd expect strong resistance from 1.3444 to limit upside to bring larger down trend reversal eventually. On the downside, below 1.3018 minor support will turn intraday bias neutral first.
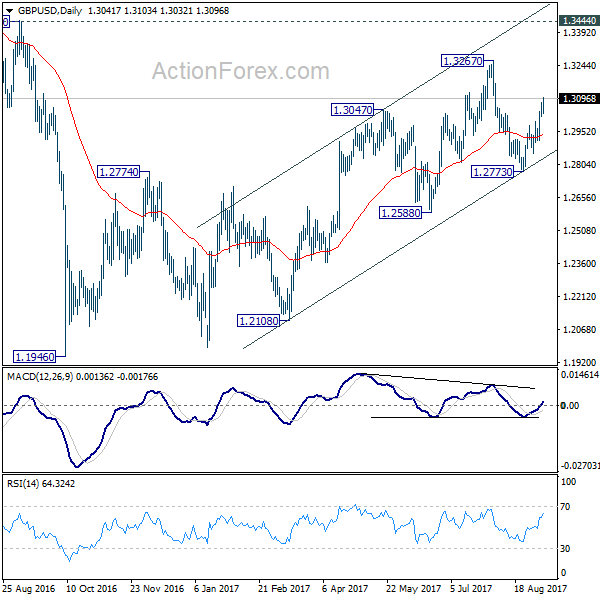
In the bigger picture, overall, price actions from 1.1946 medium term low are seen as a corrective pattern. While further rise cannot be ruled out, larger outlook remains bearish as long as 1.3444 key resistance holds. Down trend from 1.7190 (2014 high) is expected to resume later after the correction completes. And break of 1.2588 will indicate that such down trend is resuming.