Sample Category Title
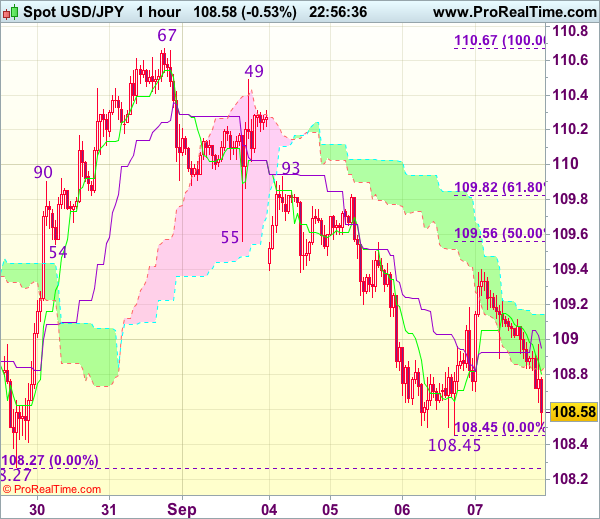
Trade Idea Wrap-up: USD/JPY – Sell at 108.75
USD/JPY - 108.55
Most recent candlesticks pattern : N/A
Trend : Down
Tenkan-Sen level : 108.56
Kijun-Sen level : 108.73
Ichimoku cloud top : 109.14
Ichimoku cloud bottom : 108.84
Original strategy :
Sell at 109.55, Target: 108.55, Stop: 109.90
Position : -
Target : -
Stop : -
New strategy :
Sell at 108.75, Target: 107.75, Stop: 109.10
Position : -
Target : -
Stop : -
As the greenback has dropped after meeting resistance at 109.40, suggesting recent decline would resume and break of previous support at 108.13, break there would extend recent downtrend to 107.75-80 and possibly towards 107.50, however, near term oversold condition would prevent sharp fall below latter level and reckon 107.20-25 would hold today, bring rebound tomorrow.
In view o this, we are still looking to sell dollar on recovery but at a lower level as 108.90-00 should cap upside. Above 109.00 would suggest an intra-day low is possibly formed but only break of said resistance at 109.40 would confirm and signal recent decline has ended instead, bring a stronger rebound to 109.70-80 first.
Euro Fluctuates after ECB; Little New from Draghi
The European Central Bank revealed little new about future policy at the end of its two-day policy meeting today, keeping interest rates and the size of its asset purchases unchanged as expected. Although ECB officials had been signalling that policymakers would not be ready to make a decision on scaling back their stimulus program at the September meeting, there were expectations that President Mario Draghi would use today's press conference to lay the groundwork for a possible October announcement.
However, Draghi stuck to familiar language at his press briefing, only saying that the Governing Council have had a "very, very preliminary" discussion on reducing monetary stimulus. He gave his strongest hint yet that the central bank will likely be ready in October to decide on its next move but neither did he commit to such a date.
The biggest surprise from the ECB today was probably the decision not to make any changes to the forward guidance. In fact, the announcement statement was completely unchanged from the previous meeting's, with the Bank even maintaining its bias to increase the size of its bond purchases if necessary. This led some analysts to think that the markets may have misjudged the ECB's readiness to begin tightening policy.
But despite the ECB's unexpected dovishness, the euro shot up by 1% to above $1.20 while Draghi spoke. The euro had been on the up in the hours prior to the ECB's decision and press conference, and jumped to a one-week high of $1.2059 when Draghi didn't appear to show particular alarm over the surging currency. However, as the press conference progressed and Draghi gave clearer indications that the euro strength would be an important factor in setting policy, the single currency fell back to around just below the $1.20 level.
Draghi said that the appreciation in the exchange rate has tightened financial conditions in the Eurozone and would need to be monitored, adding that the strength of the euro would influence policy decisions if it had a downward effect on inflation. "The recent volatility in the exchange rate represents a source of uncertainty which requires monitoring with regard to its possible implications for the medium-term outlook for price stability" Draghi said.
The euro's sharp gains in recent months have already forced the ECB to slightly lower its inflation forecasts for 2018 and 2019 by 0.1 percentage points to 1.2% and 1.5% respectively. However, they were kept unrevised at 1.5% for 2017. Growth forecasts were largely unchanged except for 2017, which was revised up from 1.9% to 2.2%. Draghi described growth as robust and broad based, but said patience was needed with regards to inflation.
The ECB only expects inflation to hit its target of close but below 2% by 2020, suggesting that the road to unwinding quantitative easing will be very slow and long.
Euro Shines Despite Draghi’s Warning about FX Volatility; Dollar Tanks
The euro rose higher on optimism that the ECB would soon taper its QE program while the dollar dropped on weak economic data and as another major hurricane is set to hit the United States.
In the day's most anticipated event, the European Central Bank refrained from changing policy although some analysts were expecting an announcement regarding the tapering of its asset purchase (QE) program. Despite the dovish outcome, euro/dollar rose sharply, rising north of 1.20 to 1.2058, just shy of the previous week's 1.2069, which was its highest level since December of 2014. Trading in the pair was volatile today, moving between 1.1920 and 1.2050.
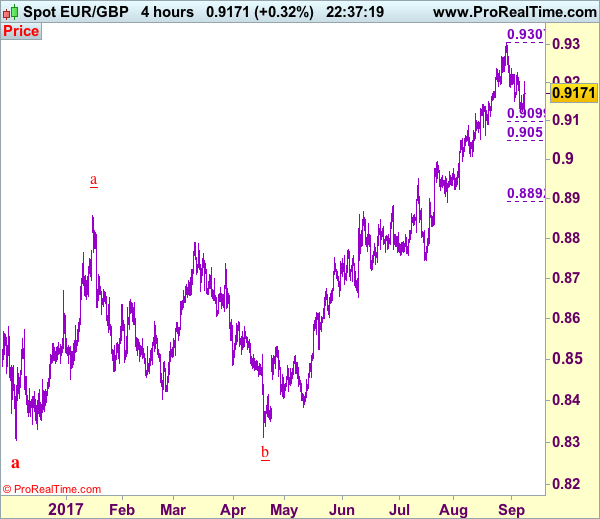
During the press conference that followed the announcement, ECB President Mario Draghi warned against excessive volatility in the euro as he showed some signs of displeasure from the recent surge in the single currency. The market pretty much ignored Draghi's concerns and pushed the euro higher. Euro/pound also rallied to only briefly pierce the 0.92 mark but dropped back to around 0.9175. The euro also rose to trade above the 131 level against the yen, in a broad move higher for the currency.
Draghi also upgraded the ECB's growth forecast to 2.2% this year (from 1.9% previously), while also downgrading the inflation forecasts of the next two years – to 1.2% and 1.5% for 2018 and 2019 respectively. While promising to keep the 60 billion euros a month pace of QE steady until the end of the year, Draghi said there would be an update on what would happen to QE next year when the ECB next meets in late October. This probably more than anything set off speculation that tapering would be announced during that meeting and gave the euro bulls an excuse to push the currency higher (together with the growth upgrade).
The dollar was today's easy target for the strong euro. In an indication of the distorting impact of Hurricane Harvey on US economic statistics, weekly initial jobless claims climbed to 298 thousand compared to 236 thousand the previous week. According to analysts, US economic statistics during the next 2-3 months will be influenced by the storm and with Hurricane Irma also closing in on Florida, the impact of hurricanes could be pronounced during the last four months of the year. The hurricanes are expected to have only a temporary impact on the US economy but they could also make the Fed's task of raising rates again this year tougher. The dollar found little support from the previous day's surprise deal between President Trump and Congressional Democrats for a 3-month extension of the Treasury's debt ceiling combined with aid for hurricane victims.
The dollar was under pressure against the yen as it dropped to around 108.60, while the pound climbed to briefly trade above the 1.31 level against the greenback. This was a fresh 1-month high for pound/dollar. The loonie, which made significant gains after yesterday's Bank of Canada rate hike but then returned a portion of those gains, managed to slightly take out those lows of USD/CAD today as it traded at 1.2137 – a 27-month low.
The remainder of the US session and Friday's Asian session will be busy in terms of Fed speakers as Mester, Dudley and George will be speaking. New York Fed President Bill Dudley's speech will be closely looked at as he may give hints on what the Fed chair Janet Yellen is thinking ahead of the September 19-20 rate-setting meeting.
In commodities, gold rose to as high as $1347 an ounce –a 1-year high- as the precious metal took advantage of the dollar's weakness and the uncertainty over North Korea's possible new missile test over the weekend. Oil was a little lower at $48.86 a barrel.
ECB: Monetary Policy Unchanged, But Changes to be Announced this October
The European Central Bank (ECB) left monetary policy unchanged, leaving interest rates on its refinancing operations, marginal lending facility, and its deposit facility unchanged at 0.00%, 0.25% and -0.40% respectively. Monthly asset purchases of €60 billion will continue at least until the end of 2017, depending on the evolution of the outlook for inflation and progress made toward the 2.0% target.
During the press conference, President Mario Draghi mentioned that the bulk of decisions on changes to the ECB's monetary policy, particularly its asset purchase program, will likely be made at the October 26th meeting. Moreover, at today's meeting the ECB governing council discussed different scenarios concerning changes to its current monetary policy, including the tradeoffs between the scenarios, their length and size, and related pros and cons.
New ECB Staff macroeconomic projections show an upward revision to economic growth for 2017 (up +0.3 ppts to 2.2%), but the growth outlook for 2018-19 remains unchanged at 1.8% and 1.7%, respectively. Headline HICP inflation was revised down in 2018 largely owing to exchange rate pass-through from euro appreciation (-0.1 ppts to 1.2%); similarly HICP inflation in 2019 was revised down by 0.1 ppt to 1.5%. Trend inflation measures were also revised down by 0.1 ppt in 2018 to 1.3%, and revised down about 0.2 ppts to 1.5% for 2019.
Estimates on labour productivity growth were revised up for 2016 and 2017, and broadly unchanged thereafter relative to the June projection. This may imply that trend labour productivity growth, and thus potential output growth, in the Euro Area may have been running a bit firmer than previously estimated since the Euro Area recovery began in 2014.
Market reaction was mixed. EURUSD surged above 1.20 after the press conference began at 8:30am EST while Euro Area bonds were heavily bid. However, after the press conference ended the EURUSD dipped below 1.20.
Key Implications
The Euro Area economy has been on fire, with growth averaging about 2.3% over the last three quarters – roughly double the estimate trend pace of growth. Job growth has been strong, and the breadth of the recovery across nations and industries has been impressive. This is largely why the ECB is contemplating the removal of some monetary accommodation, which is likely to start with a steady reduction in asset purchases next year.
Despite the rosy growth outlook, the lack of a sustainable uptick in inflation will ensure a very gradual removal of monetary accommodation by the ECB. The rapid appreciation of the euro in recent months provides further headwinds on the inflation front, as evidenced by downward revisions to the inflation outlook today. Nevertheless, the ECB remains convinced that given the outlook for strong economic and employment growth that it's just a matter of time before inflation converges to its 2.0% target.
The lack of inflation is not just a European phenomenon. A notable uptick in inflation has been missing in a number of advanced economies, including Canada and the U.S., despite strong economic performances. One culprit may be mismeasurement, including the difficulty in estimating trend economic growth and unemployment rates in real-time. On that note, upward revisions to labour productivity estimates for the Euro Area may imply that trend labour productivity growth may have been higher since 2014, suggesting that perhaps there is more economic slack than was previously measured. The presence of more economic slack would be consistent with weaker inflation, explaining at least part of the current inflation puzzle.
European Central Bank Meeting Outcome
Today has certainly been an explosively volatile trading session for the Euro, despite the European Central Bank leaving its key interest rates and bond purchase stimulus program unchanged.
The real action started during Mario Draghi's press conference, where Euro bulls and bears were engaged in a fierce tug of war as investors tried to get a fix on the implications of his speech. Although Draghi stated that the recent volatility in the Euro required close attention and is a source of uncertainty, he skillfully prepared the market to expect a QE tapering announcement in October. However, if the Euro continues to trade higher, it could be pushed out to December.
Market players seemed more interested in Europe's encouraging macro-fundamentals. With the economy expanding more than expected in the first half of 2017, it presents a strong argument to taper QE. However, a QE taper is likely to strengthen the mighty Euro further, which may fuel concerns over the inflation outlook and growth prospects. A key takeaway from September's ECB meeting and something which may continue to support the Euro, is Draghi's statement that the bulk of QE decisions will be taken in October.
From a technical standpoint, the EURUSD remains bullish on the daily charts. The breakout above 1.2000 should encourage a further appreciation towards 1.2080 and 1.2140, respectively. In an alternative scenario, repeated weakness below 1.1970 is likely to trigger a selloff towards 1.1900.
EUR/USD Rallies Even as Draghi Brings No News
- European equities eked out nice gains (+0.4% EuroStoxx) with Milan and Madrid lagging. US equities trade little changed (+0.1%)
- The ECB left its policy stance unchanged. It confirmed that purchases go ahead at the current level and it confirmed its forward guidance on the APP an on interest rates. A decision about the APP after end of 2017 will follow in October. Draghi suggested there will be another re-calibration with changes to the length and the size li. The issue(r) limits are unlikely to be changed and neither is the sequence (first ending APP than hike rates).
- The ECB upped its concerns about the strength of the euro. It is a source of uncertainty that needs monitoring. While it is no target, the currency is very important for growth and inflation and is taken into account.
- US jobless claims surged from last week by the most since November 2012 (236k to 298k ) as tens of thousands of Texans displaced by Hurricane Harvey filed applications to collect benefits.
- Sweden's central bank kept its interest rates on hold as expected after its September policy meeting, and resisted calls to bring forward plans for an eventual rate rise despite the strength of the economy. EUR/SEK rose from 9.5 to an intraday high of 9.55.
- China's foreign exchange reserves edged up for a seventh straight month in August as a surging yuan and tighter regulations signal the tide may be turning in China's battle against outflows. August was the best month since 1994 for the yuan, which has gained more than 6.5% against the dollar this year, erasing all of its 2016 losses.
- Hurricane Irma is likely to be downgraded to a Category 4 storm by the time it makes landfall in Florida, the US National Hurricane Center said. Irma, at present a Category 5 storm packing maximum sustained winds of 285 km per hour, is moving off the northern coast of the Dominican Republic, the NHC said.
Rates
ECB delays key decisions to October
The ECB kept its monetary policy unchanged, including forward guidance, effectively delaying any decisions on its APP to October. Draghi and co didn't discuss "sequencing" (rate hike will follow after ending APP) or raising the issue(r) limit. They did have very preliminary discussions on QE scenarios in 2018 (including the length and size of the programme), but leave detailed work/making a blueprint to relevant technical committees. The Bund wasn't really impressed by Draghi's putting off behavior. It gained modest ground during the Q&A session. At the time of writing, German yields drop around 1.5 bp with the 30-yr yield underperforming (-0.4 bp). US yields decline by 2 bps (2-yr) to 2.8 bps (5-yr). On intra-EMU bond markets, 10-yr yield spreads versus Germany are unchanged with Portugal, Spain and Italy outperforming (-4 to -5 bps).
The ECB recognized that EMU growth surprised on the upside of expectations, reflected by an upward revision of this year's GDP forecast from 1.9% to 2.2%, the highest level since 2007. GDP estimates for 2018 and 2019 remained unchanged, respectively at 1.8% and 1.7%. Risks to the eco outlook are broadly balanced, but the ECB admitted that the economy's positive cyclical momentum may signal a stronger upswing. A stronger euro caused a downward revision of the 2018 (1.2% from 1.3%) and 2019 (1.5% from 1.6%) HICP inflation forecasts, while the 2017 prediction remained unchanged at 1.5%. Patience on the inflation front remains necessary and core inflation still needs to show a convincing upward trend. Draghi repeated that the single currency is not a policy target, but acknowledged that is very important for GDP and CPI, thus influencing policy. Recent EUR volatility is a source of uncertainty and needs monitoring because of its potential impact on future price stability. Euro strength also caused a tightening of financial conditions, even if they still are broadly supportive.
The French Treasury sold two on the run OAT's (€5.21B 1% May2027 & €1.58B 1.25% May2036) and two off the run OAT's (€1.28B 4.5% Apr2041 & €0.93B 4% Apr2060) for a combined €9B, the total amount on offer. The auction bid cover was good (1.96). The Spanish Tesoro sold three on the run bonds: 5-yr Bono 0.4% Apr2022 (€1.78B), 10-yr Obligacion 1.45% Oct2027 (€1.31B) & 15-yr Obligacion 2.35% Jul2033 (€1B). The total amount sold was slightly above the €3.5-4.5B target range with a decent 1.88 auction bid cover.
Currencies
EUR/USD rallies even as Draghi brings no news
The (run-up to) the ECB meeting was the major driver for EUR/USD trading today. The pair rallied ahead of the policy decision. Draghi didn't bring any news on changing APP, he committed to keeping interest rates low for long and showed concern on recent 'euro volatility'. At first, the soft ECB assessment didn't prevent EUR/USD from coming within reach of the cycle top of 1.2070. Finally, the rally didn't run into resistance. The pair returned to the 1.20 area.
This morning, Asian equities traded flat to modestly higher, mirroring modest WS gains. USD/JPY drifted off yesterday's 'top' and returned to the low 109 area. EUR/USD changed hands in a tight 1.1915/35 corridor.
EUR/USD started a solid intraday rebound in Europe. The move was in the first place euro strength. Investors apparently didn't want to be wrong-footed if ECB's Draghi would have indicated that monetary policy could become less generous going forward. The EUR/USD rally coincided remarkably with good gains on European equity markets. Changes in interest rate differentials between the dollar and the euro were negligible. The EUR/USD rally was in the first place euro strength, but there was also a pinch of underlying USD softness. President Trump kicking the can further down the road on the issue of the debt ceiling clearly didn't convince investors. Other issues that weighted on the dollar of late are also not solved (Korea, the impact of the hurricanes, uncertainty on several key policy issues of the Trump administration). USD/JPY drifted gradually below 109.
The ECB left policy rates, the amount of asset purchases and its forward guidance on APP and interest rates unchanged. The euro rally took a breather going into the press conference but soon resumed its uptrend. At the press conference, Draghi stated that the recent volatility in the euro was a source of uncertainty. The overall tone of the press conference/Q&A remained soft. The ECB president reiterated that interest rates will remain at current low levels for an extended period of time and said that discussions on changingQE were very preliminary. Whatever, the wait-and-see approach of the ECB didn't prevent further euro gains. EUR/USD came within reach of the 1.2070 area, but a real test didn't occur yet. Finally, the EUR/USD rally ran into resistance. The pair trades currently back below 1.20. USD/JPY is changing hands around 108.80.
Conclusion: ECB Draghi delayed its communication on reducing QE and kept a very soft assessment, including some kind of 'warning' on euro strength. It didn't change the euro uptrend. Underlying USD softness remains a 'secondary' factor for the EUR/USD rise.
EUR/GBP driven by gyration in EUR/USD
There were no really important UK data today. Sterling trading was primarily driven by global factors, in particular the price moves of the euro in relation to the ECB's policy decision. The rise of EUR/USD ahead and during the press conference also blocked the recent downward correction of EUR/GBP. The pair rebounded from the 0.9130 area to the 0.92 area to currently trade at around 0.9175. At the same time, cable to some extent followed the EUR/USD rebound. This might be an indication of both underlying relative sterling resilience and USD softness. We didn't see any important news from the political debate on Brexit in the UK Parliament.
Euro Jumped to Fresh One-week High after ECB’s Press Conference
The Euro jumped to fresh one-week high against the US dollar at 1.2059 after ECB's press conference.
Mario Draghi, as expected, avoided big decisions today, pointing at low inflation, which is seen on track to improve and solid economic growth.
Regarding the QE program, which was in focus today, Draghi said that significant degree of stimulus is still needed, leaving bigger decisions for October ECB meeting.
Markets took Draghi's comments as hawkish and Euro rose to 1.2059, just ahead of 2017 high at 1.2070.
Overall bullish tone also helped, as most remain long Euro. Bullish techs and weak dollar on persisting geopolitical turmoil remain supportive factors for the single currency.
Pullback from fresh session high trigerred on talks on CB sellers on upticks returned below 1.2000 handle, but dips are so far well above initial supports at 1.1946 (daily Tenkan-sen) and 1.1923 (rising 10SMA).
Dip-buying strategy remains favored for now, as north-heading indicators show more room at the upside for retest of 1.2070 high and possible extension higher.
Only close below Tenkan-sen/10SMA pivots would sour near-term tone for deeper pullback.
Res: 1.2059; 1.2070; 1.2100; 1.2164
Sup: 1.1975; 1.1946; 1.1923; 1.1900
Draghi Showed “Disaffection” Over Subdued Inflation, Admitted Discussions on QE Tapering
As widely anticipated, ECB left the policy rates unchanged in September. It also kept the QE program at a pace of 60B euro per month until end 2017, or longer if needed. At the press conference, President Mario Draghi acknowledged the improvement in the economic outlook but was cautious over inflation, warning that headline CPI could fall to the negative territory towards the end of the year. At the Q&A session of the press conference, Draghi admitted that the members began "preliminary" discussion on the adjustment of the QE program but affirmed that the "big labour market slack" is justified for the record low interest rates. On the updated economic projections, the staff upgraded the GDP growth forecasts but downgraded inflation outlooks. EURUSD broke above 1.2, attempting to retest the 2.5 year high made on August 29 after a brief pullback.
QE Tapering
The first question in the Q&A session is the hottest topic - QE tapering. Regarding this, Draghi admitted the Council had a "very preliminary" discussion about the pros and cons of different scenarios, adding that he is waiting for the works from the committee in charge of the issue. Draghi, however, refused to commit that a timetable on the tapering would be ready in October, nor did he admit discussions over the topic of bond scarcity.
In response to a question from a German journalist concerning the negative side effects of the QE program, Draghi defended by noting that the potential side effects are vastly overwhelmed by the positive effects of the program.
Euro's Strength
Gaining +14% against the US dollar since the beginning of the year, the single currency has risen for 6 consecutive months since March with the rally gathering momentum in late June. The ECB has since the last meeting strengthened its warning over the appreciation of its currency. Draghi warned that "the recent volatility in the exchange rate represents a source of uncertainty which requires monitoring with regard to its possible implications for the medium-term outlook for price stability". Yet, he refrained from commenting whether the current level (1.2 against USD) is excessive.
Economic Projections:
ECB has raised its GDP growth forecast to +2.2% for 2017, up from +1.9% projected in June, while those for 2018 and 2019 are kept unchanged at +1.8% and +1.7%, respectively. On inflation, the HICP is expected to improve to +1.5% this year (unchanged from June's projection), before decelerating to +1.2% in 2018 (June: +1.3%) and +1.5% in 2019 (June: +1.6%). While noting that the Council was broadly dissatisfied with the subdued inflation, Draghi called for "confidence, patience and persistence" to wait for inflation to return to the target level and the market as the recovery in the economy feeds through to prices. He added that the target would probably be reached by 2020, the year he steps down as the ECB president!
Trade Idea: EUR/GBP – Sell at 0.9225
EUR/GBP - 0.9145
Original strategy :
Sell at 0.9265, Target: 0.9115, Stop: 0.9305
Position : -
Target : -
Stop : -
New strategy :
Sell at 0.9225, Target: 0.9100, Stop: 0.9265
Position : -
Target : -
Stop : -
As the single currency has remained weak after retreating from last week’s high of 0.9307, adding credence to our view that temporary top has possibly been formed there and consolidation with mild downside bias is seen for correction of recent upmove to 0.9095-00 (50% Fibonacci retracement of 0.8892-0.9307, however, near term oversold condition should prevent sharp fall below 0.9050 (61.8% Fibonacci retracement) and price should stay well above support at 0.9008.
In view of this, we are inclined to sell euro on recovery as 0.9225-30 should limit upside. Above 0.9250 would suggest low is formed instead, bring a stronger rebound to 0.9270 but only above said resistance at 0.9307 would revive bullishness and extend recent upmove to 0.9325-30 and possibly towards 0.9350, however, loss of upward momentum should limit upside and price should falter below 0.9390-00.
Our preferred count is that, after forming a major top at 0.9805 (wave V), (A)-(B)-(C) correction is unfolding with (A) leg ended at 0.8400 (A: 0.8637, B: 0.9491 and 5-waver C ended at 0.8400. Wave (B) has ended at 0.9413 and impulsive wave (C) has either ended at 0.8067 or may extend one more fall to 0.8000 before prospect of another rally. Current breach of indicated resistance at 0.9043 confirms our view that the (C) leg has ended and bring stronger rebound towards 0.9150/54, then towards 0.9240/50.
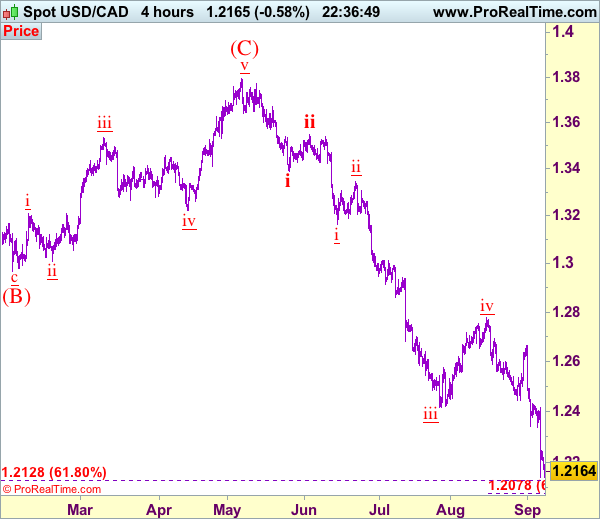
Trade Idea: USD/CAD – Sell at 1.2285
USD/CAD - 1.2170
Original strategy :
Sell at 1.2285, Target: 1.2100, Stop: 1.2345
Position: -
Target: -
Stop: -
New strategy :
Sell at 1.2285, Target: 1.2100, Stop: 1.2345
Position: -
Target: -
Stop:-
As the greenback has remained under pressure after yesterday’s selloff on surprise rate hike, adding credence to our bearish view that recent decline is still in progress and downside bias remains for this wave v of larger degree wave iii to extend weakness to 1.2125-30, then 1.2100, however, near term oversold condition should prevent sharp fall below 1.2075-80 (61.8% projection of 1.3547-1.2414 measuring from 1.2778) and price should stay above psychological support at 1.2000, bring rebound later. We are keeping our count that wave v as well as wave (C) ended at 1.3794 and impulsive wave (i ii, i ii) is now unfolding with minor wave iii ended at 1.2414, followed by wave iv correction ended at 1.2778, wave v has reached our initial downside target at 1.2200 and may extend to 1.2100.
In view o this, would not chase this fall here and would be prudent to sell on recovery as 1.2290-00 should limit upside. Above 1.2335-40 would defer and risk a stronger rebound to 1.2390-00 but only break of resistance at 1.2429 would signal low is formed, bring retracement of recent decline to 1.2490-00.
To recap, wave B from 1.3066 is unfolding as an a-b-c and is sub-divided as a: 1.2192, b: 1.2716 and wave c is a 5-waver with i: 1.1983, ii: 1.2506, extended wave iii with minor iii at 1.0206, wave iv ended at 1.0781 and wave v as well as wave iii has ended at 0.9931, hence the subsequent choppy trading is the wave iv which is unfolding as (a)-(b)-(c) with (a) leg of iv ended at 1.0854, followed by (b) leg at 1.0108 and (c) leg as well as the wave iv ended at 1.0674. The wave v is sub-divided by minor wave (i): 0.9980, (ii): 1.0374, (iii): 0.9446, (iv): 0.9913 and (v) as well as v has possibly ended at 0.9407, therefore, consolidation with upside bias is seen for major correction, indicated target at 1.3700 and 1.4000 had been met and further gain to 1.4700 would be seen later.