Sample Category Title
Trade Idea: AUD/USD – Stand aside
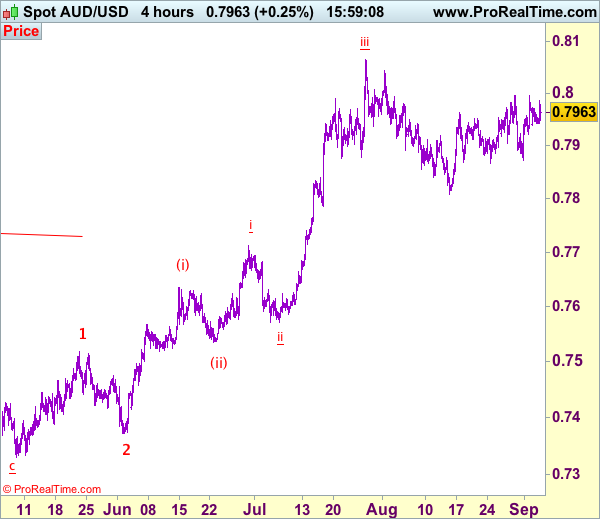
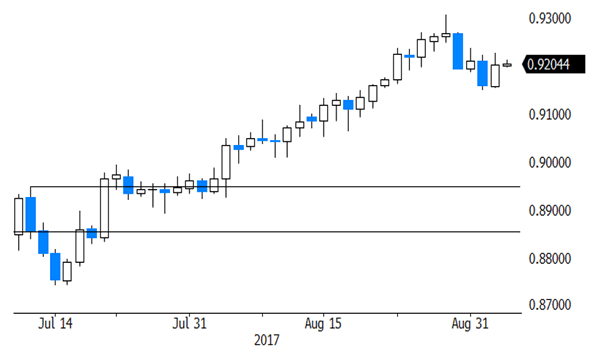
AUD/USD – 0.7962
New strategy :
Stand aside
Position: -
Target: -
Stop:-
Although aussie found support at 0.7938 and rebounded, break of 0.8000 level is needed to would revive bullishness and signal the pullback from 0.8066 has ended earlier at 0.7808, hence upside bias would be for further gain to 0.8040-43, then retest of this level which is likely to hold on first testing. If said resistance continues to hold, then further choppy trading would take place.
On the downside, below 0.7920-25 would bring weakness to 0.7890-00, however, as outlook remains consolidative, reckon support at 0.7871 would remain intact, bring another rebound later. A drop below 0.7871 would suggest the erratic rise from 0.7808 has ended, brig further fall to 0.7850 but price should stay above said support at 0.7808. As near term outlook is mixed, would be prudent to stand aside for now.
On the 4-hour chart, the move from 0.8066 is the wave 5 with i: 0.8860, ii: 0.8315, wave iii is an extended move ended at 1.0183, iv: 0.9706 and wave v has ended at 1.1081 (also the top of entire wave 5). The subsequent selloff is the major correction which is unfolding as ABC-X-ABC and 2nd A leg has ended at 0.8848, followed by a-b-c wave B which ended at 0.9758, hence, 2nd C wave is now in progress and indicated downside target at 0.7000 and 0.6950 had been met, so further fall to 0.6710-20 cannot be ruled out.
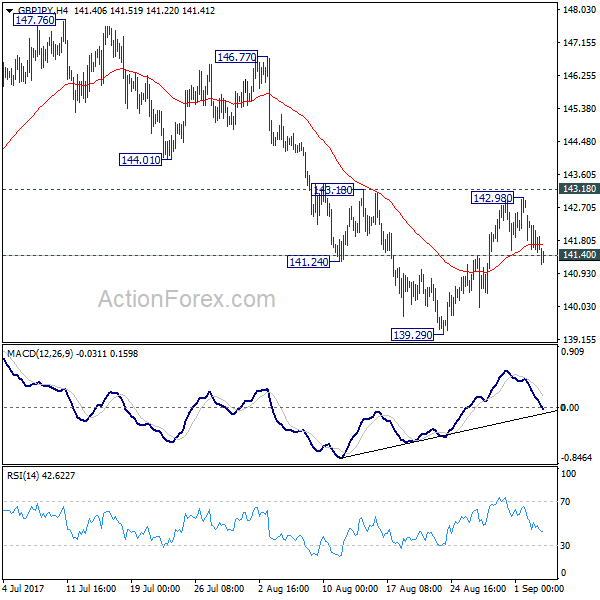
GBP/JPY Daily Outlook
Daily Pivots: (S1) 141.38; (P) 141.93; (R1) 142.38; More
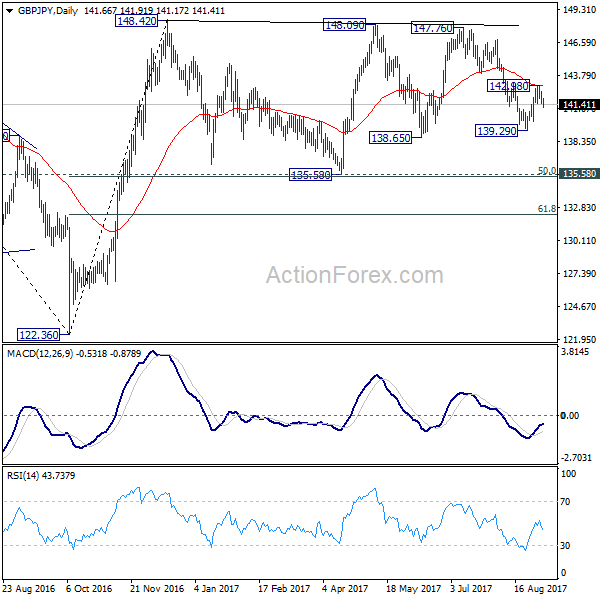
Break of 141.40 minor resistance turns intraday bias back to the downside for 139.29. With 143.18 resistance intact, near term bearishness is maintained. Break of 139.29 will target 135.58 key support level. At this point, price actions from 148.42 are seen as a sideway consolidation pattern. Hence, we'll expect strong support from 135.58 to contain downside and bring rebound. Meanwhile, break of 143.18 will indicate short term reversal and turn bias back to the upside.
In the bigger picture, the sideway pattern from 148.42 is still unfolding. In case of deeper fall, we'd expect strong support from 135.58 and 50% retracement of 122.36 to 148.42 at 135.39 to contain downside. Medium term rise from 122.36 is expected to resume later. And break of 38.2% retracement of 196.85 to 122.36 at 150.43 will carry long term bullish implications. However, firm break of 135.58/39 will dampen the bullish view and turn focus back to 122.36 low.
EUR/JPY Daily Outlook
Daily Pivots: (S1) 130.12; (P) 130.41; (R1) 130.72; More...
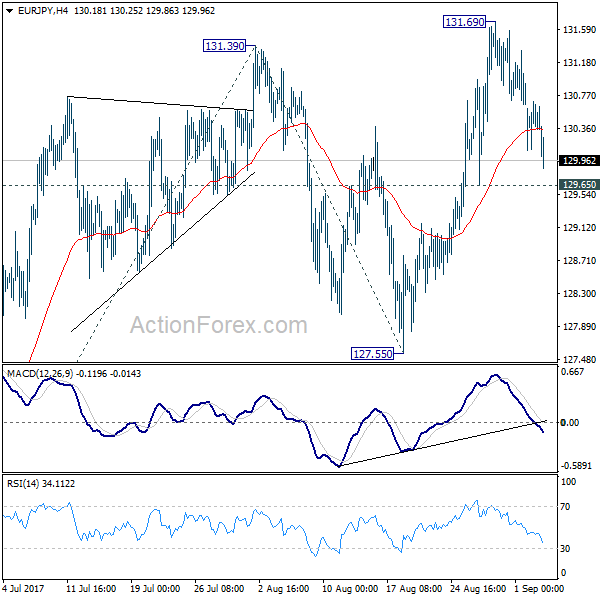
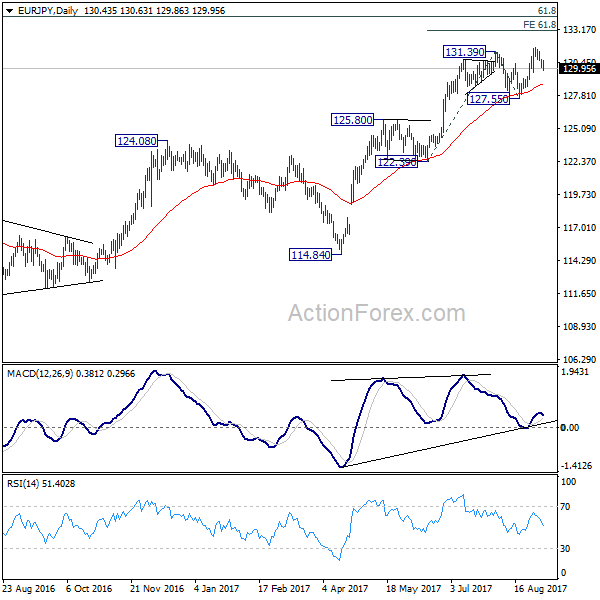
Intraday bias in EUR/JPY remains neutral as the pull back from 131.69 continues. As long as 129.65 minor support holds, another rise is still mildly in favor. Break of 131.69 will extend the larger up trend to 61.8% projection of 122.39 to 131.39 from 127.55 at 133.11 next. However, break of 129.65 will dampen the bullish case and turn bias back to the downside for 127.55 support instead.
In the bigger picture, the down trend from 149.76 (2014 high) is completed at 109.03 (2016 low). Current rally from 109.03 should be at the same degree as the fall from 149.76 to 109.03. Further rise is expected to 61.8% retracement of 149.76 to 109.03 at 134.20. Sustained break there will pave the way to key long term resistance zone at 141.04/149.76. Medium term outlook will remain bullish as long as 124.08 resistance turned support holds. However, firm break of 124.08 will argue that rise from 109.03 is completed and turn outlook bearish.
EUR/GBP Daily Outlook
Daily Pivots: (S1) 0.9162; (P) 0.9193; (R1) 0.9225; More
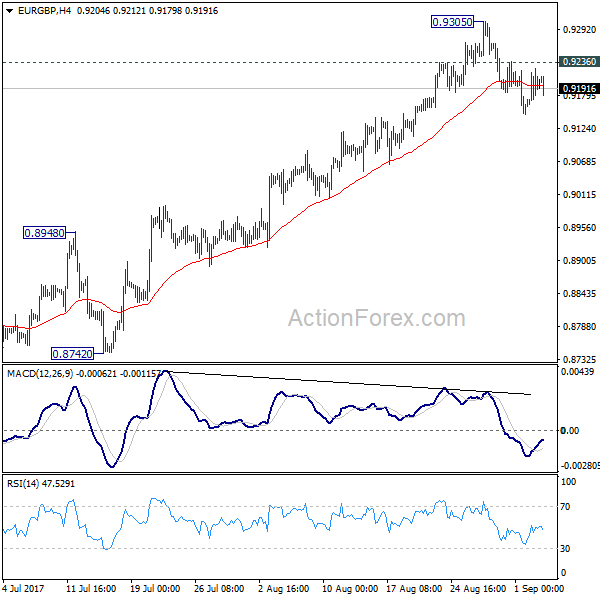
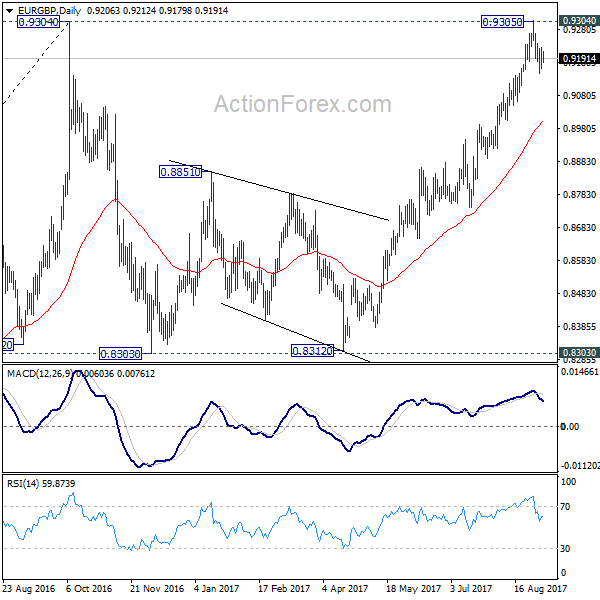
At this point, deeper fall is still expected in EUR/GBP with 0.9236 minor resistance intact. Fall from 0.9305 should extend to 55 day EMA (now at 0.9006). Sustained trading below there will likely start the third leg of the consolidation from 0.9304 and target 0.8303 key support again. On the upside, above 0.9236 minor resistance will turn bias back to the upside for 0.9305 instead.
In the bigger picture, price actions from 0.9304 are viewed as a medium term corrective pattern. It's uncertain whether it is finished yet. But in case of another fall, we'd expect strong support from 0.8116 cluster support (50% retracement of 0.6935 to 0.9304 at 0.8120) to contain downside and bring rebound. Whole up trend from 0.6935 is expected to resume after consolidation from 0.9304 completes. Firm break of 0.9799 high will target 61.8% projection of 0.5680 to 0.9799 from 0.6935 at 1.1054.
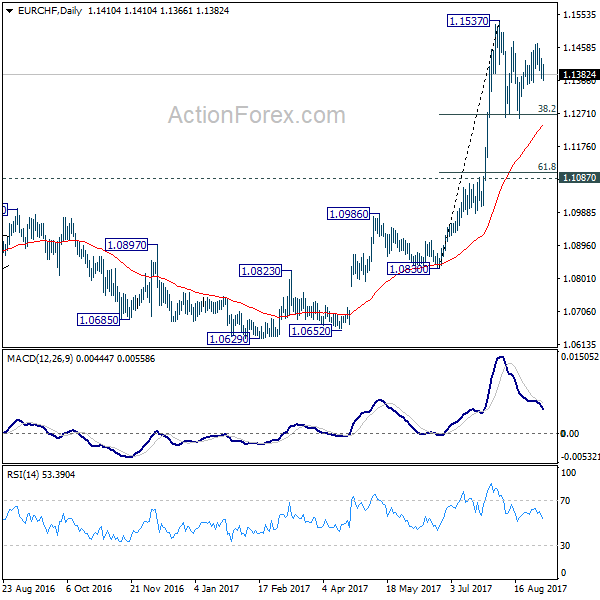
EUR/CHF Daily Outlook
Daily Pivots: (S1) 1.1366; (P) 1.1396; (R1) 1.1421; More...
EUR/CHF dips mildly today but it's, after all, staying in consolidation from 1.1537. Intraday bias remains neutral first. On the upside, break of 1.1537 resistance will confirm resumption of larger rally from 1.0629. In that case, EUR/CHF should target 1.2 key resistance level next. On the downside, firm break of 38.2% retracement of 1.0830 to 1.1537 at 1.1267 will extend the correction to 61.8% retracement at 1.1100 before completion.
In the bigger picture, long term rise from SNB spike low back in 2015 is still in progress. EUR/CHF should now be heading back to prior SNB imposed floor at 1.2000. For now, this will be the favored case as long as 1.1087 resistance turned support holds.

Silver Price Eyeing A Break Above $18.00 Vs US Dollar
Key Highlights
- Silver price recovered well from the $16.00 swing low against the US Dollar and currently following an uptrend.
- There are two important bullish trend lines forming with supports at $17.70 and $17.40 on the 4-hours chart of XAG/USD.
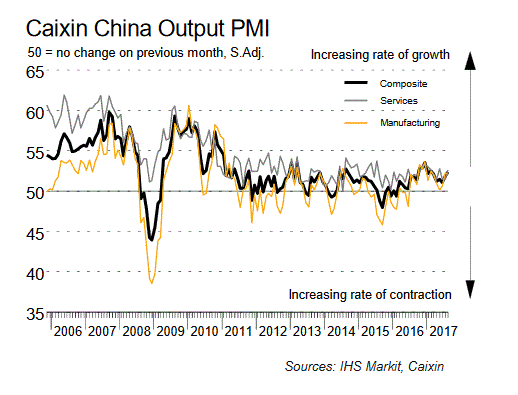
- The Caixin China Services PMI in August 2017 posted a rise from 51.5 to 52.7.
- The US Factory orders figure of July 2017 will be released today, which is forecasted to decline by 3.2% (MoM).
Silver Price Technical Analysis
Silver price likely made a major bottom near $16.00 against the US Dollar. The price is currently gaining momentum and preparing for a break above $18.00.
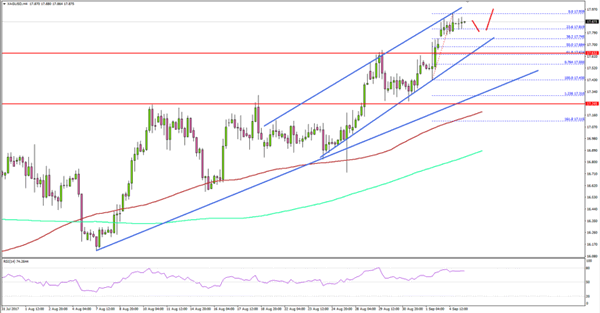
Looking at the 4-hours chart of XAG/USD, there are two important bullish trend lines forming with supports at $17.70 and $17.40. On the upside, there is a connecting trend line with resistance at $18.10.
At the moment, the price is consolidating gains below $17.90. On the downside, an initial support is around the 23.6% Fib retracement level of the last wave from the $17.43 low to $17.93 high.
If the price corrects lower, it is likely to find bids near $17.70 or $17.60. The 100 SMA (H4) currently at $17.18 is moving higher and pointing a bullish bias in the near term.
Caixin China Services PMI
Today, the Caixin China Services PMI for August 2017 was published. The forecast was lined up for a minor increase in the PMI from the last reading of 51.5 to 51.8.
However, the actual result was above the forecast, as there was an increase to 52.7. Moreover, the Caixin China Composite Output Index was up from the last reading of 51.9 to 52.4. This is the strongest expansion activity seen for six months.
The report added that:
August data revealed that the latest expansion of overall business activity was underpinned by increased activity at both manufacturers and services providers. Notably, services companies registered the quickest upturn in business activity for three months.
To sum up, it seems like Silver price could break the recent high of $17.93 sooner or later and trade above $18.00.
The recent US Dollar weakness against the Euro, GBP and Aussie Dollar is also helping commodities such as Gold and Silver. If the current sentiment remains intact, there are chances of further upsides in Gold above $1340 and Silver above $18.00.
Investors Remain On The Defensive, Yen Outperforms
Asian equity markets remained under pressure for a second consecutive day. Nervousness is still being felt through some asset classes after North Korea’s nuclear test on Sunday, with the flow of funds continuing into the Yen and Swiss Franc in particular.
The most significant statement heard yesterday was from Nikki Haley, the U.S. Ambassador to the United Nations. She warned that Kim Jong Un was ‘begging for war’, and the ‘time for half measures’ from the U.N. has to end. However, she continues to believe that the problem should be resolved through diplomacy.
With tougher sanctions on North Korea looking to be the most likely scenario, markets will discount the possibility of war, but the risk-off mode may continue to persist a little longer, as there may bemore missile launches on the horizon. Investors have been searching for a catalyst that will lead to a steep market correction, but if a hydrogen bomb wasn’t enough to trigger the selloff, then any new experiments from the Kim Jong Un regime won’t get traction, and investors should focus elsewhere.
European stocks fell yesterday but the declines were modest, with the FTSE 100, CAC, and DAX finishing down less than 0.4%. European and U.S. bonds benefited from the flight to safety, but the declines in yields were insignificant.
On the data front, China’s services sector jumped to a three-month high of 52.7, after dipping in July. Meanwhile, Japan’s service sector showed activity declining to a six-month low of 51.6, as the pace of new orders fell, an indication that growth in this sector may flatten over the next couple of months.
The Aussie fell slightly after the central bank kept interest rates unchanged for the 13thconsecutive month, but it’s still up 0.2% for the day. RBA governor Philip Lowe continued to warn that an appreciating exchange rate would be expected to result in a slower pick-up in growth. Given that investors continue to search for yield, such comments won’t stop traders from buying the currency.
In Europe, the focus will be on the final services PMI reports; the U.K. services sector will be of special interest, given that construction slipped to a one-year low of 51.1.
The U.S. markets will return from the Labor Day holiday, with equity futures indicating a slight selloff. Speeches from FOMC members Lael Brainard and Neel Kashkariare likely to drive the dollar’s move, as markets need some answers on the timetable of the Fed’s balance sheet reduction, and whether another rate hike in 2017 is still on the cards.
Currencies: Korean Tensions Keep Dollar Near Recent Lows
Sunrise Market Commentary
- Rates: Technical features vs. risk sentiment and Fed Brainard
Last week's bearish engulfing pattern in the US Note future (potential trend reversal) needs confirmation this week. The technical picture, which argues in favour of a correction lower, hangs in the balance with risk sentiment (several potential negatives) and a (dovish?) speech by Fed governor Brainard. - Currencies: Korean tensions keep dollar near recent lows
The dollar traded slightly softer in thin market conditions yesterday. The US currency underperformed the yen and even the euro, as Korean uncertainty weighs. This pattern might continue today even as the eco calendar is better filled. More consolidation in EUR/USD and EUR/GBP might be on the cards going into Thursday's ECB meeting.
The Sunrise Headlines
- US markets return after yesterday's Labour Day Holiday. Risk sentiment on Asian stock markets is mixed overnight with Japan underperforming (stronger yen). The US Note future gains modest ground.
- China's services sector expanded at a faster clip in August as new business orders picked up, according to the Caixin Services PMI, pointing to renewed strength in a key part of the world's second-largest economy.
- South Korea warned that North Korea appears to be preparing to test another intercontinental ballistic missile, and the US told the UN that the regime is “begging for war” after Pyongyang set off its most powerful nuclear bomb yet.
- The RBA kept its policy rate unchanged at 1.5%, remaining on the side-lines as lending curbs take steam out of housing markets in Sydney/Melbourne and as prospects for a pickup in business investment emerge. AUD/USD barely moves.
- Officials across the north eastern Caribbean cancelled airline flights, shuttered schools and urged people to hunker down indoors as Hurricane Irma barrelled toward the region as a powerful Category 4 storm expected to strengthen more before nearing land late Tuesday.
- The number of European banks in grave danger rose sharply last year and is now close to its 2013 level, despite extensive efforts by lenders to bolster balance sheets and profits, analysis by consultancy Bain shows.
- The eco calendar includes August Services PMI's in the UK and EMU (final). Fed governors Brainard and Kashkari are scheduled to speak while Austria taps the bond markets.
Currencies: Korean Tensions Keep Dollar Near Recent Lows
Geopolitical uncertainty prevents USD comeback
Tensions on the Korean peninsula were the only driver for global FX trading yesterday with the EMU eco calendar empty and US markets closed in observance of Labour Day Holiday. The dollar and equities were in the defensive, but reversed part of the early session setback during the day. EUR/USD closed the session at 1.1896 (from 1.1860). USD/JPY finished the day at 109.82 (from 110.25 on Friday).
This morning, Asian markets continue to trade with a slight risk-off bias, awaiting the next developments in the Korean crisis. The Chinese Caixin services PMI improved from 51.5 to 52.7. Chinese equity indices trade with slight gains. Other regional indices are trading mixed to slightly lower, Japan and South Korea underperforming. Safe havens like the yen are favoured. USD/JPY dropped to the 109.25 area. EUR/USD is again little affected, trading just north of 1.19. The RBA as expected left its policy unchanged at 1.5%. The central bank says that the higher A$ is weighing on the outlook for growth and employment. The A$ gained slightly after the publication of the Caixin PMI's but lost a few ticks after the RBA policy statement. AUD/USD trades currently in the 0.7965 area.
Geopolitical tension on Korean peninsula continue to attract investors' attention. EMU eco data, while interesting, will probably have little impact on FX trading. US headline factory orders are expected weak after a transport-driven decline in the durables. Aside from the volatile transportation items, the durable report was strong. Fed speeches of Kashari and especially Brainard may be more important. The former is well-known as an arch dove. Governor Brainard of the Washington-based board is also a dove, but she supported the gradual rate Fed hike path. A change in accent in her comments might affect US yields and the dollar.
The Korean-inspired risk-off weighed slightly on the dollar yesterday and will probably remain in play today. Of late, geopolitical tensions seldom had a protracted impact on global (FX) markets. Even so, we have the impression that it may take a bit longer for the ‘buy risk assets on dip' paradigm to return. Investors will also look forward to the ECB meeting. More headlines/rumours on the ECB's assessment of the recent euro rebound are likely. For now they had only a limited (negative) impact on the euro. In this context, we expect some USD softness to persist as long the Korea story dominates the news headlines. We expect EUR/USD to hold the 1.1825/1.2070 range going into the ECB meeting.
Global context. Dollar sentiment improved after the Jackson-Hole sell-off, but USD didn't regain any technically relevant level against the euro or the yen yet. So, the jury is still out whether a sustained USD rebound is on the cards. The data might be slightly USD supportive, but a (moderate) risk-off sentiment doesn't help the dollar. Therefore, we maintain a EUR/USD neutral bias ahead of the ECB policy meeting. If EUR/USD falls below the 1.18/1.1775 area, it would suggest more downside short-term. For such a move, the USD needs good data and higher US yields. On the euro side of the story, Draghi has to convince markets that low inflation is enough a reason for the ECB to maintain a loose monetary policy. On the topside, the 1.2070 correction top remains the first reference. A downward correction in core (US and European) yields supported the yen in August. USD/JPY declined from mid-114 mid-July and came within reach of the key 108.13 range bottom, but the support did its job. We maintain the working hypothesis that this level won't be broken easily as a lot of USD bad news is discounted. A cautious buy-on-dips (with stop-loss protection below 108) may be considered. USD/JPY needs to regain 110.95 to improve the technical picture. Such a break might be difficult as long as global sentiment remains risk-off.
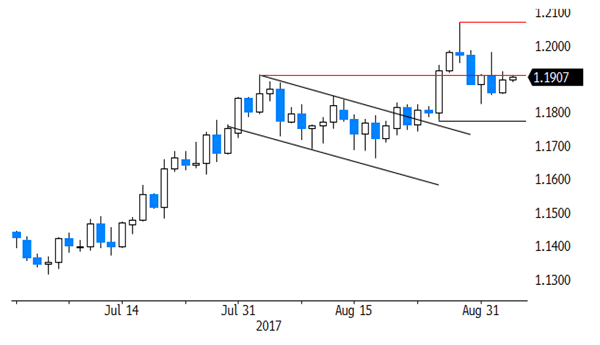
EUR/USD: in consolidation modus ahead of the ECB policy meeting
EUR/GBP
EUR/GBP correction doesn't continue, at least for now
Sterling traders experienced an uneventful session yesterday. The UK currency traded slightly softer as risk aversion weighed slightly more on sterling than on the dollar and the euro. The UK construction PMI (51.1) also showed a further loss of momentum. However, both the moves in cable and in EUR/GBP were technically insignificant. EUR/GBP finished the session at 0.9202, cable at 1.2931.
Overnight, the BRC like-for-like retail sales rose from 0.9% Y/Y to 1.3% Y/Y. The report suggests that spending isn't falling off a cliff even as consumers' purchasing power is under pressure. Later today, the UK August services PMI is expected to ease slightly from 53.8 to 53.5. The manufacturing PMI was strong, but the sector profits most from the weaker pound. This won't play for the services sector. A positive surprise might be slightly supportive for sterling, but we don't expect a big reaction. Sterling entered calmer waters even as the third round of the Brexit negotiations entered a stalemate. Some more consolidation in EUR/GBP might be on the cards. A risk-off context is usually also of no help for sterling. From a technical point of view, EUR/GBP cleared 0.8854/80 resistance (top end June), opening the way for further gains. The move was the result of euro strength. Simultaneously, UK price data were soft enough to keep the BoE side-lined. MT, we maintain a buy EUR/GBP on dips approach as we expect the combination of euro strength and sterling softness to persist. The 0.9415 ‘flash-crash spike' is the next target on the charts. We wait for a correction, e.g. to the technical support in the 0.88/89 area, to sell sterling again versus the euro.
EUR/GBP: sterling rebound stalls. Risk-off doesn't help sterling
Markets On Edge
With the markets risk appetite dampened after North Korea's most powerful nuclear test to date, USD and Global equities fell whilst Gold, Yen and Sovereign Bonds all rose. President Trump is supposedly weighing economic sanctions that could target China as a result of Pyongyang's recent nuclear test on Sunday. Asia Business Daily reported on Tuesday that there is a high chance North Korea will fire an ICBM missile before the Sept. 9 foundation day after the Pyongyang regime started moving such a weapon. The US is calling for further sanctions against the regime whilst the US Ambassador to the UN says Pyongyang is ‘begging for war'. The markets expect more rhetoric to follow.
With the US Labor Day Holiday markets were somewhat lethargic, as expectations grew for hints of economic growth following a plethora of Central Bankers speaking this week. The ECB is scheduled to meet on Thursday, but the markets are not expecting the ECB to tighten economic policy any time soon.
They are, however, expecting to hear ECB President Draghi raise concerns over EUR recent strengthening. Several FOMC members are speaking today and, again, the markets will be listening acutely to determine when the US may hike rates.
EURUSD remains little changed overnight, currently trading around 1.1905.
USDJPY has gained based on risk aversion due to Japan being the world's largest creditor nation. Currently, USDJPY is trading around 109.30.
GBPUSD is also little changed overnight, currently trading around 1.2930.
Gold is trading close to an 11-month high, as markets move to the traditional safe-haven. Currently, Gold is trading around $1,336.50.
WTI has gained slightly overnight to currently trade around $47.75pb.
Markit Economics will be releasing several European Country's PMI for August:
At 08:15 BST, Spain Services PMI expected 56.8 from the previous 57.6.
At 08:45 BST, Italy Services PMI expected 55.7from the previous 56.3.
At 08:50 BST, France Services PMI expected 55.5 from the previous 55.5.
At 08:55 BST, Germany Services PMI expected 53.4 from the previous 53.4.
At 09:00 BST, Eurozone Services PMI expected 54.9 from the previous 54.9.
At 09:30 BST, United Kingdom Services PMI expected 53.5 from the previous 53.8.
Central Bankers are scheduled to speak:
At 10:10 BST, Phillip Lowe, Governor of the Reserve Bank of Australia is scheduled to speak.
At 13:00 BST, FOMC Member Brainard is scheduled to speak.
At 15:00, the US Census Bureau will release Factory Orders (MoM) for July. The previous strong reading of 3% is not expected to be met with the consensus for this release expected around -3.2%.
At 18:10 BST, FOMC Member Kashkari is scheduled to speak.
At 23:05 BST, FOMC Member Kaplan is scheduled to speak.
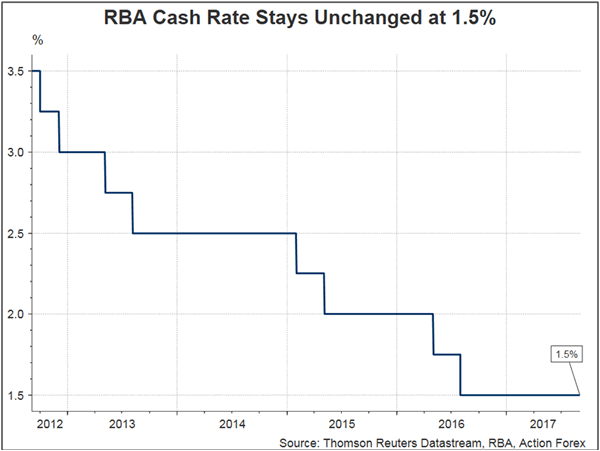
RBA Left Cash Rate At 1.5%
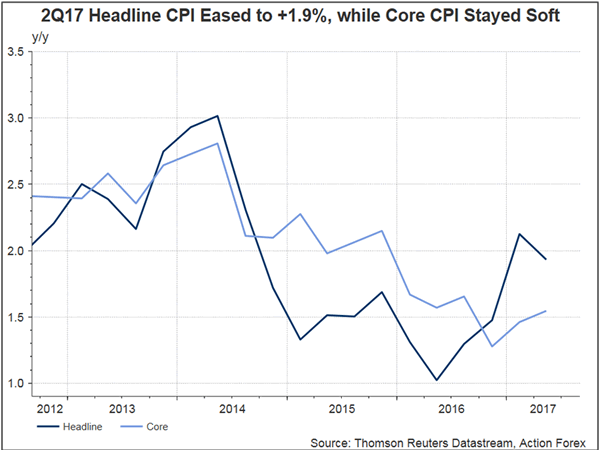
As widely anticipated, the RBA left the cash rate unchanged at 1.5%, historic low since August 2016. Policymakers remained confident over the economic outlook, but stayed cautious over the strength in property prices. Again, they warned that recent appreciation in Australian dollar would weigh on the outlook for growth and employment, and prolong soft inflation. . It appeared that the central bank would keep its policy rate unchanged at the current level for some time.
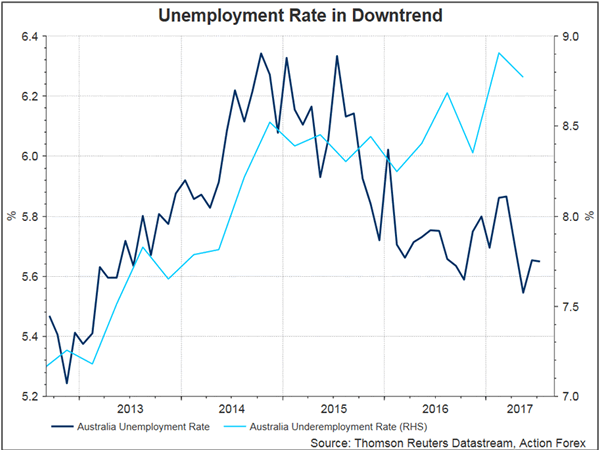
The central bank retained the view that Australia's economy would 'gradually pick up over the coming year' as 'the decline in mining investment' would end soon while 'non-mining investment has improved recently and reported business conditions are at a high level'. On the job market, policymakers noted that employment growth 'has been stronger over recent months and has increased in all states' while different forward-looking indicators have pointed to 'solid growth in employment over the period ahead'. However, wage growth has remained low. RBA believed that subdued wage growth would continue for some time, 'although stronger conditions in the labour market should see some lift in wages growth over time'.
On the housing market, the RBA noted that 'conditions in the housing market continue to vary considerably around the country. Housing prices have been rising briskly in some markets, although there are signs that conditions are easing, especially in Sydney. In some other markets, prices are declining'.
RBA acknowledged that AUD's appreciation over the past months was partly driven by USD's weakness. It reiterated the warning that 'the higher exchange rate is expected to contribute to the subdued price pressures in the economy. It is also weighing on the outlook for output and employment. An appreciating exchange rate would be expected to result in a slower pick-up in economic activity and inflation than currently forecast'. While AUDUSD has been in consolidation since the last RBA meeting, the pair has gained +10% since the beginning of the year.