
Sample Category Title
EUR/GBP Candlesticks and Ichimoku Analysis
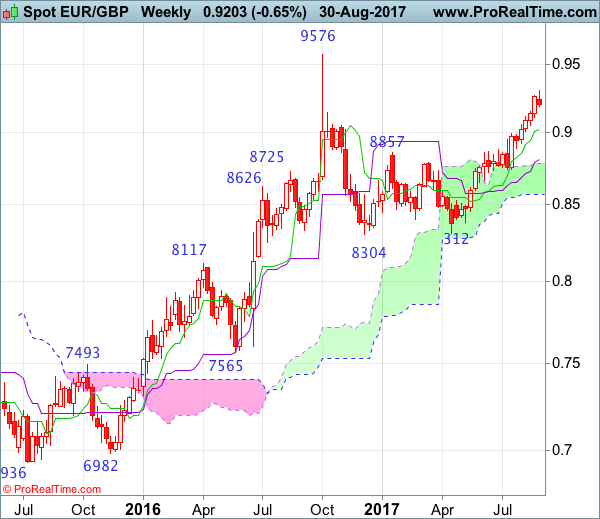
Weekly
• Last Candlesticks pattern: N/A
• ime of formation: N/A
• Trend bias: Near term up
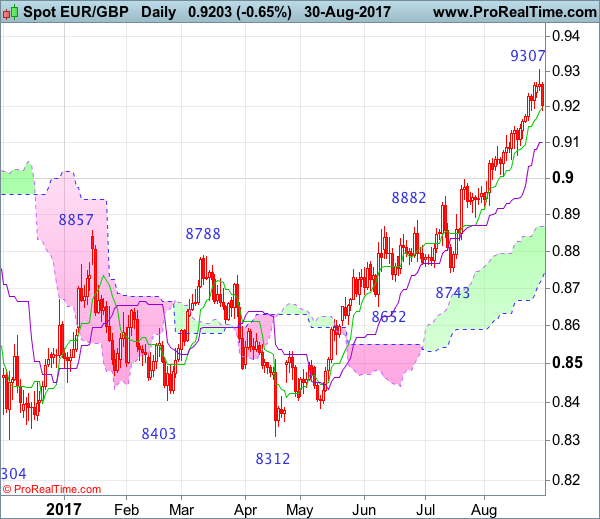
Daily
• Last Candlesticks pattern: Doji
• Time of formation: 21 Jul 2017
• Trend bias: Up
EURGBP – 0.9218
As the single currency has finally retreated after rising to 0.9307 earlier this week, suggesting a week of consolidation below this level would be seen and below the Tenkan-Sen (now at 0.9165) would add credence to this view, bring retracement to the Kijun-Sen (now at 0.9099), however, still reckon downside would be limited to 0.9050-55 and support at 0.9008 should remain intact, bring another upmove later. Above said resistance at 0.9307 would signal medium term upmove is still in progress and extend headway to 0.9350-55 but near term overbought condition should prevent sharp move beyond 0.9380-85 (100% projection of 0.8312-0.8950 measuring from 0.8743) and reckon 0.9400-10 would hold from here, risk from there is seen for a strong retreat to take place later.
On the downside, whilst initial pullback to the Tenkan-Sen (now at 0.9165) and then the Kijun-Sen (now at 0.9099) cannot be ruled out, reckon 0.9050-55 would limit downside and brig another rise later. A daily close below support at 0.9008 would defer and suggest a temporary top has been formed, bring retracement of recent upmove to previous resistance at 0.8950 and later towards 0.8895-00, having said that, reckon the upper Kumo (now at 0.8868) would contain downside, bring another rise later.
Recommendation: Buy again at 0.9050 for 0.9250 with stop below 0.8980.
On the weekly chart, although the single currency extended recent rise to 0.9307 earlier this week, the subsequent retreat looks set to form a black candlestick with a long upper shadow (shooting star alike), hence consolidation below this level would be seen and pullback to 0.9130-35 and then 0.9095-00 is likely, however, reckon the Tenkan-Sen (now at 0.9025) would limit downside and bring another rise later. Above said resistance at 0.9307 would signal recent erratic rise from 0.8304 is still in progress and may extend gain to 0.9350-60, then 0.9380-85 (100% projection of 0.8312-0.8950 measuring from 0.8743). Looking ahead, break there is needed to retain bullishness and signal the entire correction from 0.9576 top has ended at 0.8304 and encourage for further subsequent gain to 0.9450.
On the downside, although pullback to 0.9130-35 cannot be ruled out, reckon 0.9050-55 would limit downside and the Tenkan-Sen (now at 0.9025) should hold, bring another rise. A drop below support at 0.8891 would defer and suggest top is possibly formed, bring retracement of recent upmove to 0.885-60, then test of the Kijun-Sen (now at 0.8810) but reckon support at 0.8743 would hold. Only a weekly close below this support would retain bearishness for subsequent decline to 0.8650-55 but the lower Kumo (now at 0.8571) should remain intact, bring another rally later.
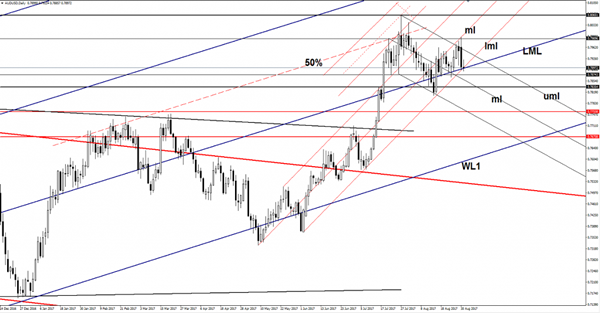
AUD/USD Imminent Breakdown
Price dropped sharply on Wednesday and seems motivated the take out the major support from the lower median line (LML). Is challenging the confluence area formed between the LML with the lower median line (lml) of the ascending pitchfork, a valid breakdown will accelerate the sell-off.
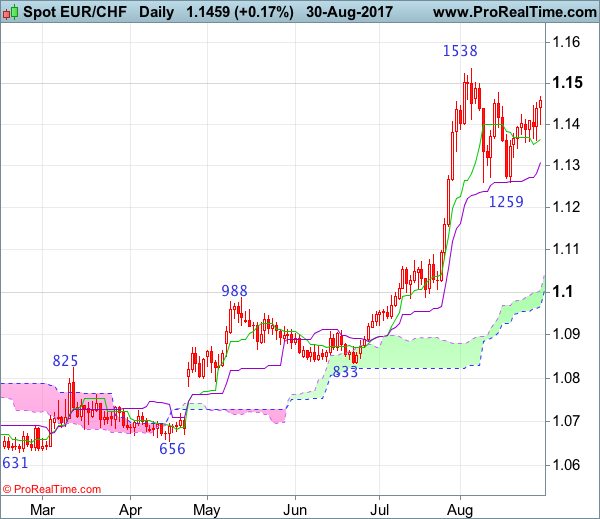
EUR/CHF Candlesticks and Ichimoku Analysis
Weekly
• Last Candlesticks pattern: Long white candlestick
• Time of formation: 24 Jul 2017
• Trend bias: Up
Daily
• Last Candlesticks pattern: Morning doji
• Time of formation: 25 Jul 2017
• Trend bias: Up
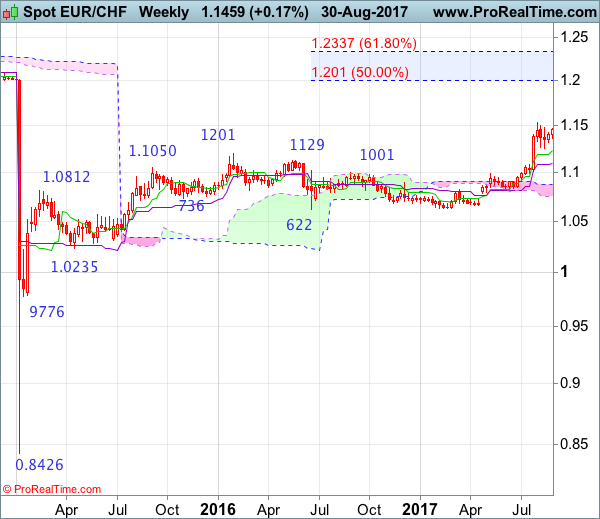
EUR/CHF – 1.1425
As the single currency has risen again after finding support around 1.1355, adding credence to our view that the pullback from 1.1538 has possibly ended at 1.1259 and consolidation with mild upside bias remains for gain towards resistance at 1.1479, however, a daily close above there is needed to add credence to this view, bring retest of this level later. Only a break of said recent high at 1.1538 would confirm recent upmove has resumed and extend headway to 1.1600-10, having said that, further sharp move beyond 1.1700 should not be repeated and price should falter below 1.1770-80, bring retreat later.
On the downside, whilst pullback to 1.1395-00 cannot be ruled out, reckon the Tenkan-Sen (now at 1.1357) would contain downside and bring another rise later. Below support at 1.1343 would bring test of 1.1320-25, break there would suggest the rebound from 1.1259 has ended, bring retest of this level, below there would extend the corrective fall from 1.1538 top for retracement of recent upmove to 1.1185 (50% Fibonacci retracement of 1.0833-1.1538), however, sharp fall below 1.1100-05 (61.8% Fibonacci retracement) should not be repeated and 1.1050 would hold, bring rebound later.
Recommendation: Hold long entered at 1.1355 for 1.1555 with stop below 1.1350.
On the weekly chart, as the single currency found support at 1.1259 and has rebounded, suggesting consolidation with upside bias would be seen but break of 1.1479 resistance is needed to signal the pullback from 1.1538 has ended there and bring retest of this level. Only a break of this recent high would revive bullishness and extend the major rise from 0.8426 low for headway to 1.1590-00, then towards 1.1700-10, however, overbought condition should prevent sharp move beyond 1.1800 and reckon 1.1900-10 would hold from here, risk from there has increased for a retreat to take place later.
On the downside, expect pullback to be limited to 1.1355-60 and bring another rise later. Below 1.1320-25 would risk test of said support at 1.1259, break there would shift near term risk to the downside, a weekly close below the Tenkan-Sen (now at 1.1231) would suggest a temporary top is formed instead, bring retracement of recent rise to 1.1100-05 (61.8% Fibonacci retracement of 1.0833-1.1538), then test of the Kijun-Sen (now at 1.1097) but reckon support at 1.0987 would remain intact.
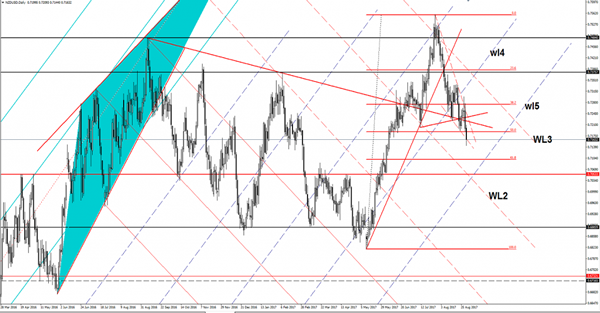
NZD/USD More Drop To Come
NZD/USD extends the sell-off confirming a further drop in the upcoming period. Is trading in the red and should hit fresh new lows in the upcoming days because is located deep in the seller’s territory. Has plunged much below the 50% retracement level, signaling that will drop towards the 61.8% retracement level. Could also be attracted by the fifth warning line (wl5) of the ascending pitchfork.
EUR/GBP Is This A False Breakout?
Price dropped sharply in the yesterday's trading session and now is located deep in the seller's territory. Has changed little in the morning, but the Euro-zone data should bring some volatility later. The bulls seem tired on the short term, but is premature to talk about another leg lower because is still located above an important dynamic support.
The Euro increased a little after the German Retail Sales were released, even if the report has come in much worse than expected, the indicator dropped by 1.2%, more versus the 0.5% estimate. The Euro-zone CPI Flash Estimate and the Core CPI Flash Estimate will be released later and could shake the price. Moreover, the Unemployment Rate is expected to remain steady at 9.1% for the second month in July.
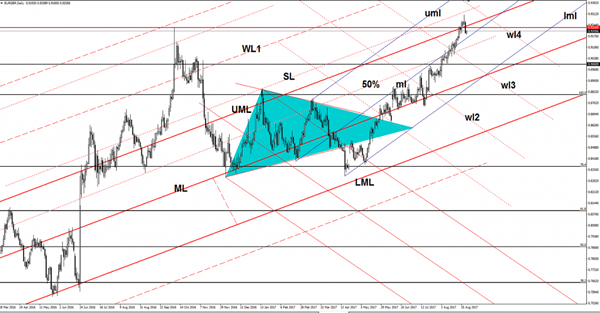
Price dropped much below the upper median line (UML) of the major ascending pitchfork, but failed to retest the median line (ml) of the minor ascending pitchfork. Now is fighting hard to increase and to retest the 0.9226 level and the UML. A retest followed by a minor decrease will confirm a broader drop in the upcoming period.
Looks like we had a false breakout above the UML, the failure to reach the outside sliding line (sl) has signaled an exhaustion.
Price could still increase after a median line (ml) retest, only a breakdown below it will signal a drop at least till the lower median line (lml).
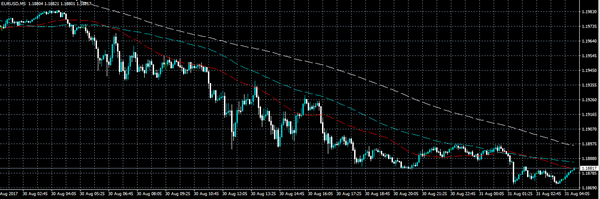
EURO Moves Back To Weekly Pivot
The euro has slipped below the key 1.1900 level, as the U.S dollar index moves higher across the board. So far, the EURUSD has found support from 1.1870 level, just above the pairs weekly pivot point, at 1.1865.
During the European trading session, we see a number of high-impact economic data points, with the release of the German unemployment rate, and August inflation data for the eurozone.
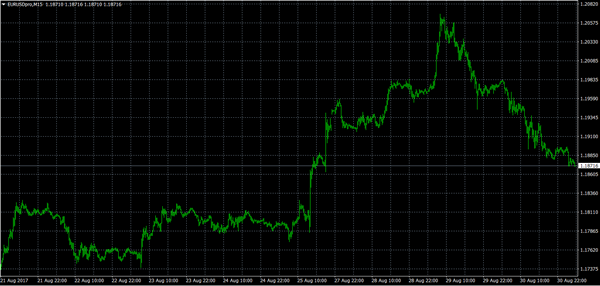
The EURUSD pair has pulled back sharply from the recent high, set at 1.2070, with the euro also failing to close above the psychological 1.2000 on a daily time-frame basis.
Key intraday technical support for is found at the weekly pivot point, at 1.1865, and the H4 time frame 100-period moving average, at 1.1811. The euro's 200-week moving average, adds critical support, at 1.1753.
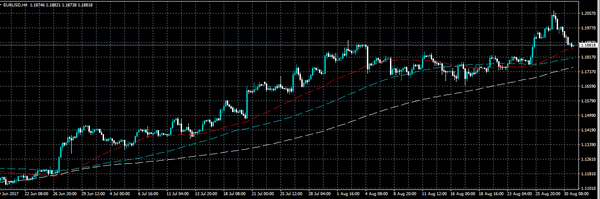
Key intraday technical resistance is found at the monthly time frame, 50-period moving average, at 1.1900. Above the 1.1900 level, the 1.1920 level represents the EURUSD pivot point, with further upside resistance at the 1.1942 level.
USDJPY Moves To 10 Day Trading High
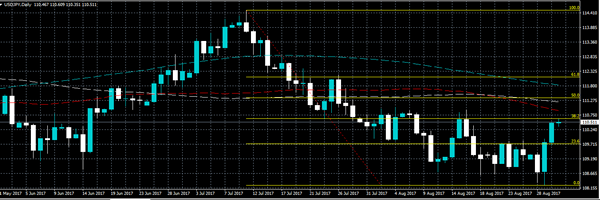
The USDJPY pair has continued to advance higher during the Asian trading session, moving to 110.61, and finding intraday resistance from the 38.2 Fibonacci retracement of the recent 108.26 price low, to the 114.49 swing high.
At present, the USDJPY trades around the 110.50 level, with the pair receiving a major boost from U.S dollar index strength, after a better than expected U.S second quarter GDP report, and solid U.S private sector job increases, on Wednesday.
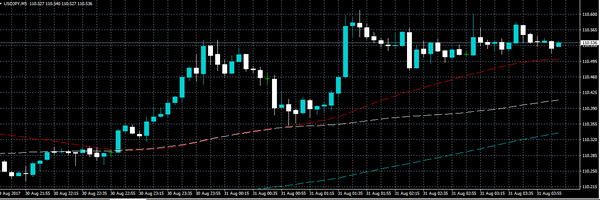
The USDJPY pair is currently bullish in the short and medium-term, with price-action now approaching major long-term technical resistance at the 110.80 level.
Multiple higher-time frame price closes above 110.80, should encourage further USDJPY buying towards the 111.40-50 region, where Fibonacci resistance, the 200-week moving average and the monthly pivot point are all located.
To the downside, key technical support is found at 110.40, and the daily pivot point, at 110.14. Below the 110.14 level, critical weekly USDJPY support is found at 109.80, and 109.42.
Data Deluge Continues Thursday With Eurozone CPI, US Personal Income
After an active Wednesday session, investors can expect another barrage of economic data on Thursday, with reports from the United States and Europe set to draw the most headlines.
The headlines begin at 06:00 GMT with a report on German retail sales. Retail receipts are forecast to decline 0.4% in July, but rise 3.5% annually.
Two hours later, the German government will report unemployment figures for the month of August. The jobless rate is expected to hold steady at 5.7%.
At 09:00 GMT, the European Commission’s statistical agency will release preliminary inflation data for the month of August. The consumer price index (CPI) strengthened to 1.4% in the 12 months through August, according to a median estimate. So-called core inflation is forecast to edge lower to 1.2% from 1.3%.
Eurozone unemployment data will be released at the same time as the CPI report. The region’s jobless rate likely held steady at 9.1% in July.
US data will take over from 12:30 GMT with a government report on personal income and outlays. The monthly report also features the core personal consumption expenditure (PCE) index, which is the Federal Reserve’s preferred measure of inflation. The July core PCE index is forecast to fall to 1.4% from 1.5% in June.
North of the border, Statistics Canada is expected to announce another quarter of robust economic growth. Second-quarter GDP is forecast at 3.7% annually, matching the previous quarter’s gain that made Canada the fastest-growing G7 nation.
Earlier in the day, the Chinese government reported a sharp slowdown in its services sector. The official non-manufacturing PMI slipped to 53.4 in August from 54.5 the previous month. That was the lowest since May 2016.
EUR/USD
The euro was one of the heaviest casualties on Wednesday, with the EUR/USD plunging nearly 200 pips. After hitting a new multiyear high of 1.2064, the pair crashed toward 1.1870. With recent data favouring the US dollar, the EUR/USD is vulnerable to sharper correction, perhaps toward the 21 August high of 1.1830.
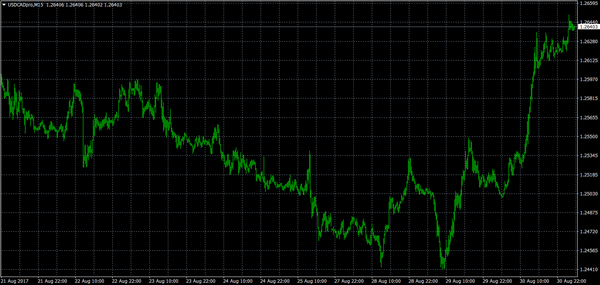
USD/CAD
Like the euro, the Canadian dollar suffered heavy losses in mid-week trade, as the USD/CAD spiked back toward the 1.26 region. That represents a gain of nearly 200 pips from the pair’s lowest point on Tuesday. A solid GDP report on Thursday could help the loonie reverse some of those losses.
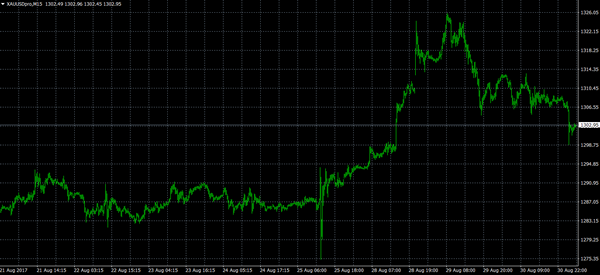
GOLD
Gold prices lost some of their shine on Wednesday after upbeat US data triggered a large rally for the dollar. Bullion continued lower on Thursday, with the spot price briefly crossing below $1,300.00. The outlook on gold largely depends on the interplay between the US economy and the dollar. That means economic data are of utmost importance.
Can New Zealand Dollar Hold 100-Day SMA Vs US Dollar?
Key Highlights
- The New Zealand Dollar started a downtrend from the 0.7550-0.7560 area against the US Dollar.
- There was a break below a crucial bullish trend line with support at 0.7380 on the 4-hours chart of NZD/USD.
- The Preliminary release of the US GDP for Q2 2017 points an annualized increase of 3%, more than the +2.7% forecast.
- ANZ Business Confidence in New Zealand for August 2017 declined from 19.4 to 18.3.
NZD/USD Technical Analysis
The New Zealand Dollar after trading as high as 0.7558 made a major top against the US Dollar. The NZD/USD pair is now in a downtrend and eyeing a close below 0.7150 and the 100-day SMA.
Looking at the daily chart, there is clear major top visible at 0.7558. During the downside move, the pair broke a crucial bullish trend line with support at 0.7380. It even cleared major support levels such as 0.7330 and 0.7240.
Sellers succeeded in breaking the 50% Fib retracement level of the last wave from the 0.6817 low to 0.7558 high. At the moment, the pair is attempting to break and settle below the 0.7150 support and the 100-day SMA.
If it succeeds, it would open the doors for more losses towards 0.7100 and 0.7050. The recent breaks and current sentiment point more losses as long as the pair is below 0.7240. Therefore, there are chances of a break below 100-day SMA for a test of 0.7100.
US GDP and New Zealand Business Confidence
Recently, the US saw the preliminary release of the Gross Domestic Product (Annualized) for Q2 2017 by the US Bureau of Economic Analysis. The forecast was slated for a rise of 2.7% in the GDP compared with the same quarter a year ago.
The actual result was much better, as the GDP increased 3% as per the second estimate, up from the last +2.6%.
The report added that:
Real gross domestic income (GDI) increased 2.9 percent in the second quarter, compared with an increase of 2.7 percent (revised) in the first. The price index for gross domestic purchases increased 0.8 percent in the second quarter, compared with an increase of 2.6 percent in the first quarter.
Overall, the result was positive, and helped the greenback in recovering versus the Euro, GBP, AUD and NZD. NZD/USD is likely to struggle in the near term and it could even test the 0.7100 level.
Economic Releases to Watch Today
US Personal Income for July 2017 (MoM) – Forecast +0.3%, versus 0.0% previous.
US Core Personal Consumption Expenditure for July 2017 (MoM) – Forecast +0.1%, versus +0.1% previous.
US Initial Jobless Claims – Forecast 237K, versus 234K previous.
US Pending Home Sales for July 2017 (MoM) – Forecast +0.5%, versus +1.5% previous.
Positive US Data Helps USD Reverse Recent Losses
Positive US data was released on Wednesday showing that the US economy grew faster than was initially expected in Q2. The US Bureau of Economic Analysis released GDP for Q2 showing a 3% annual rate. The release surpassed market expectations of 2.7% growth as GDP grew at its fastest pace in more than 2 years. Relatively robust consumer spending and improved business sentiment are the likely reasons for the improvement and now puts the US economy on a stronger footing as we enter Q3. In addition, the US ADP Employment Report surprised many with a strong release of 237K, beating the market consensus of 185K. This strong release further underscores a resilient US Labor market which can only help upcoming CPI expectations, as more Americans are working and, more importantly, spending money.
Friday’s NFP will hopefully show more positive news with the markets hoping to see an upward improvement in Average Earnings. Such positive economic data helped USD reverse recent losses, however, the response from President Trump that “all options” were on the table and the fact he dismissed any diplomatic negotiations with North Korea by stating “talking is not the answer” halted further USD advances, as the markets are concerned that tensions could rise further which may result in another round of risk-off sentiment.
EURUSD lost 0.5% on Wednesday to trade as low as 1.18942. EUR weakness continued overnight with EURUSD currently trading around 1.1875.
USDJPY gained over 0.6% on the day, trading as high as 110.435, before giving back some of its gains. In early trading, USDJPY has further strengthened to currently trade around 110.50.
GBPUSD improved slightly on Wednesday, although it remained in a relatively tight trading range. Currently, GBPUSD is trading around 1.2925.
Gold traded within an $8 range on Wednesday, as markets digested risk tolerance following improved US data and President Trump’s response to North Korea. A risk on sentiment overnight has seen Gold trade lower. Currently, Gold is trading around $1,303.
WTI pared back recent losses, gaining 0.7% on the day. Currently, WTI is trading around £46.25pb.
At 09:00 BST, German Unemployment Rate & Unemployment Change for August will be released. With an expected change of -6K which will further underscore an improving German economy.
At 10:00 BST, Eurozone Consumer Price Index & Core year on year for August will be released. Non-core is expected to come in at 1.4%, up from the previous release of 1.3%. Upward inflationary pressure will assist the easing of Eurozone economic policy and, potentially, see interest rates rise in the future.
At 13:30, US Personal Consumption Expenditure Price Index & Core (MoM) & (Y0Y) for July will be released. With no increases expected from both indicators, the lack of inflationary pressure will not help the Fed’s plans to increase interest rates later this year.