Sample Category Title
EUR/USD Losing Altitude
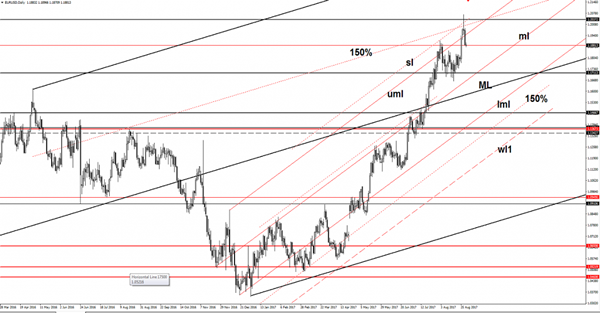
The price is trading in the red at this moment and could drop much deeper in the upcoming days if the dollar index will have more directional energy to resume the upside movement. EUR/USD turned to the downside after a false breakout, but we still need a confirmation that will start a broader drop on the Daily chart. The perspective is still bullish despite the minor drop as the rate is located above some important support levels.
Technically, has shown some exhaustion signs on Tuesday, but personally, I would like to see a resistance retest before the rate will move towards new lows.
You should be careful in the upcoming hours as the Euro-zone and the US are to release high impact data, the fundamental factors will take the lead, but remains to see the direction.
EUR/USD changed little today as the dollar index has posted little gains, but I hope that the Euro-zone and US data will bring life on it. Price has plunged below the upper median line (uml) of the ascending pitchfork in the yesterday’s session.
I would like if will come back to retest the upper median line (uml) before will move towards the median line (ml) of the ascending pitchfork.
Technically is expected to drop after the false breakout above the 50% Fibonacci line and above the sliding line (sl), but the outlook is bullish on the daily chart as long as is trading within the minor ascending pitchfork’s body.
Elliott Wave View: GBPJPY Ending Correction
GBPJPY Short Term Elliott Wave suggests that the decline to 8/23 low at 139.27 ended Minor wave W. Minor wave X bounce is currently unfolding as a double three Elliott Wave Structure. Minute wave ((w)) of X ended at 141.47, Minute wave ((x)) of X ended at 139.98, and Minute wave ((y)) of X is subdivided into a FLAT. Minutte wave (a) of ((y)) ended at 141.09 and Minutte wave (b) of ((y)) ended at 140.39. Minute wave ((y)) of X has now reached 1.236 extension of ((w))-((x)) and thus the cycle from 8/23 low (139.27) is mature. Sellers may appear anytime from 142.65 – 143.49 area for an extension lower or at least a 3 waves pullback. We don’t like buying the pair.
GBPJPY 1 Hour Elliott Wave View
Double Three is the most important pattern in Elliott wave’s new theory. It’s probably the most common pattern in the market these days. Double three is also known as a 7-swing structure. It is a very reliable pattern that gives traders a good opportunity to trade with a well-defined level of risk and target areas. The image below shows what Elliott Wave Double Three looks like. It has labels (W), (X), (Y) and an internal structure of 3-3-3. This means that all 3 legs has corrective sequences. Each (W) and (Y) is formed by 3 waves oscillation and has a structure of A, B, C or W, X, Y of smaller degrees.
USD/CAD Daily Outlook
Daily Pivots: (S1) 1.2535; (P) 1.2585; (R1) 1.2671; More....
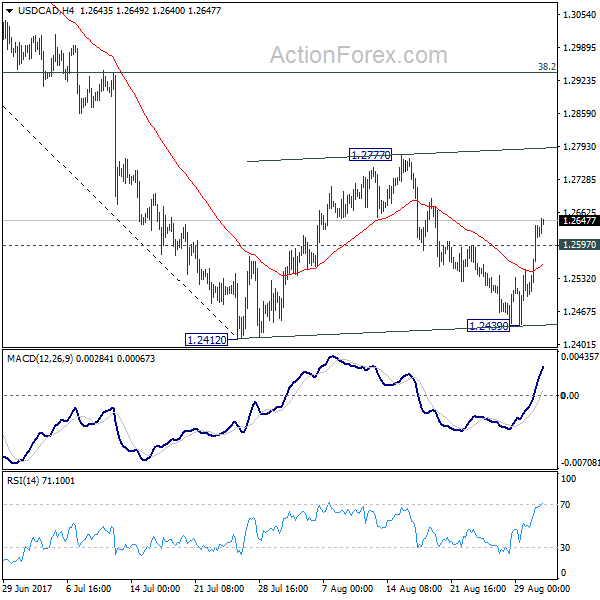
USD/CAD's strong rebound and break of 1.2597 minor resistance suggests that consolidation pattern from 1.2412 has started the third leg. Intraday bias is turned back to the upside for 1.2777 resistance and above. But upside should be limited by 38.2% retracement of 1.3793 to 1.2412 at 1.2940 to bring fall resumption eventually. On the downside, break of 1.2412 will extend larger fall from 1.3793 and target next long term fibonacci level at 1.2048.
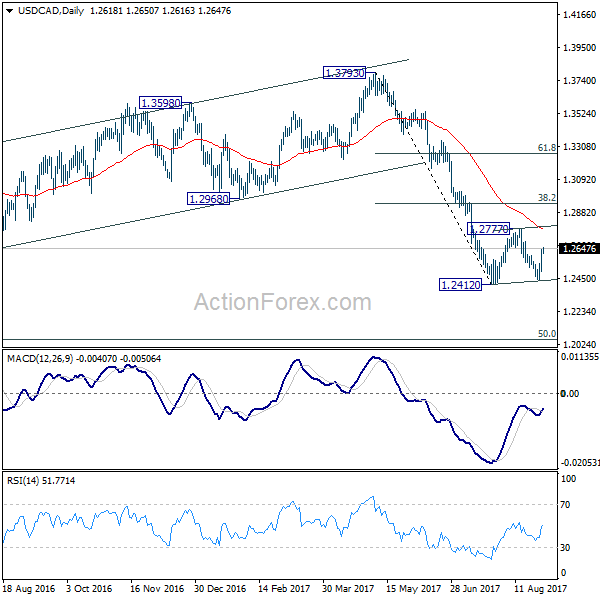
In the bigger picture, price actions from 1.4689 medium term top are seen as a correction pattern. Such corrective fall is still expected to extend to 50% retracement of 0.9406 to 1.4869 at 1.2048. At this point, we'd look for strong support from there to contain downside and bring rebound. Nonetheless, on the upside, sustained break of 1.2968, 38.2% retracement of 1.3793 to 1.2412 at 1.2940 will be the first sign of completion of the correction and will turn focus back to 1.3793 key resistance.
EUR/USD Daily Outlook
Daily Pivots: (S1) 1.1847; (P) 1.1915 (R1) 1.1950; More...
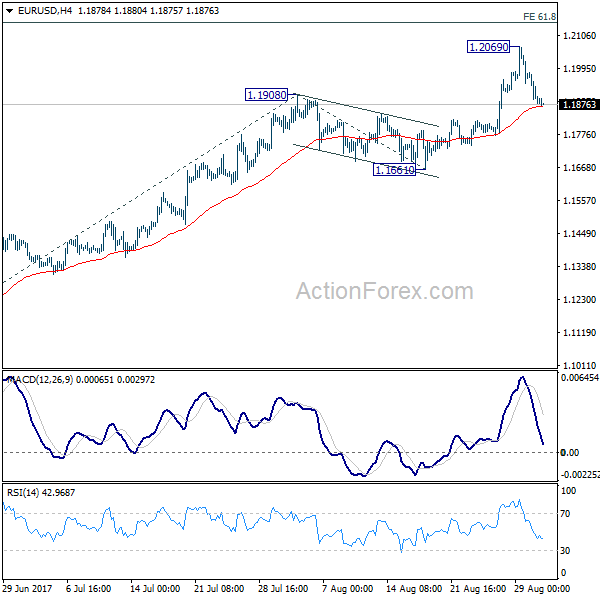
Intraday bias in EUR/USD remains neutral as the corrective pattern from 1.2069 is unfolding. While deeper fall cannot be ruled out, downside should be contained well above 1.1661 support to bring rise resumption. Above 1.2069 will extend the whole rally from 1.0339 to 61.8% projection of 1.1118 to 1.1908 from 1.1661 at 1.2149 first. Break there will target 100% projection at 1.2451 next.
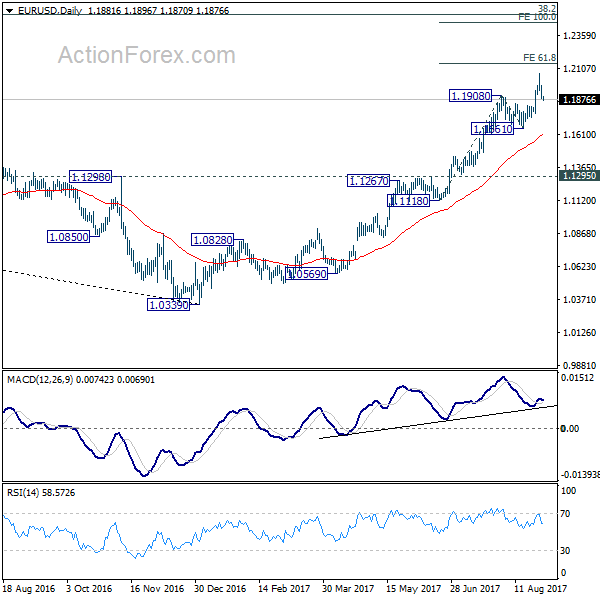
In the bigger picture, an important bottom was formed at 1.0339 on bullish convergence condition in weekly MACD. Sustained trading above 55 month EMA (now at 1.1768) will pave the way to key fibonacci level at 38.2% retracement of 1.6039 (2008 high) to 1.0339 (2017 low) at 1.2516. While rise from 1.0339 is strong, there is no confirmation that it's developing into a long term up trend yet. Hence, we'll be cautious on strong resistance from 1.2516 to limit upside. For now, medium term outlook will remain bullish as long as 1.1295 support holds, in case of pull back.
GBP/USD Daily Outlook
Daily Pivots: (S1) 1.2888; (P) 1.2912; (R1) 1.2947; More...
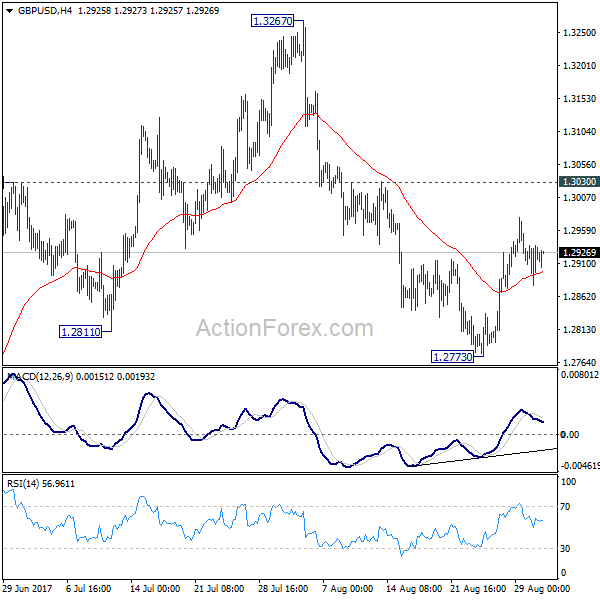
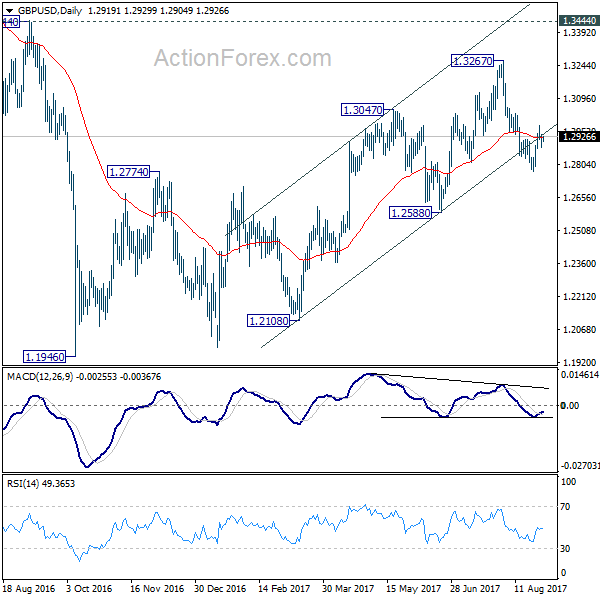
Intraday bias in GBP/USD remains neutral as consolidation from 1.2773 is unfolding. We're favoring the case that correction from 1.1946 is completed at 1.3267. Below 1.2773 will target 1.2588 key near term support first. Decisive break of 1.2588 will confirm our view and target a test on 1.1946 low. Though, break of 1.3030 will dampen this bearish view and turn bias back to the upside for retesting 1.3267.
In the bigger picture, overall, price actions from 1.1946 medium term low are seen as a corrective pattern. While further rise cannot be ruled out, larger outlook remains bearish as long as 1.3444 key resistance holds. Down trend from 1.7190 (2014 high) is expected to resume later after the correction completes. And break of 1.2588 will indicate that such down trend is resuming.
USD/CHF Daily Outlook
Daily Pivots: (S1) 0.9567; (P) 0.9606; (R1) 0.9674; More....
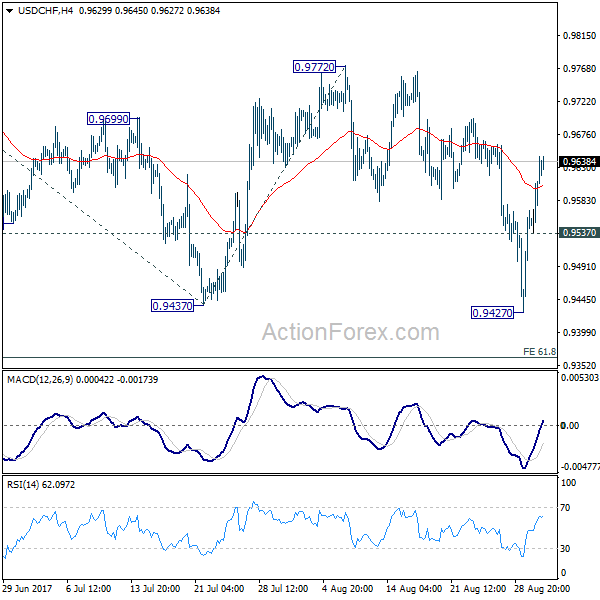
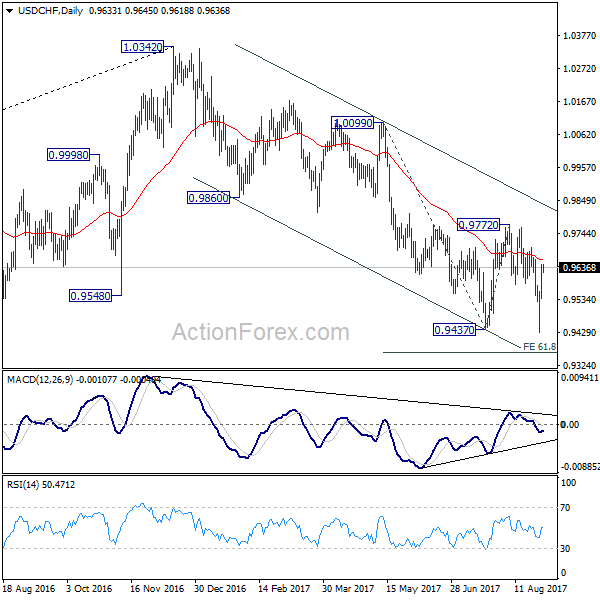
USD/CHF's rebound from 0.9427 is still in progress and further rise might be seen. The consolidation could extend longer considering that the pair is close to 0.9443 key support. Nonetheless, break of 0.9772 resistance is needed to confirm near term reversal. Otherwise, outlook stays bearish for another decline. Below 0.9537 minor support will turn bias back to the downside for retesting 0.9427 first. Break of 0.9427 will target 61.8% projection of 1.0099 to 0.9437 to 0.9772 at 0.9363.
In the bigger picture, current development suggests that 0.9443 key support (2016 low) could be taken out firmly as down trend form 1.0342 extends. There are various interpretation of the price actions. But in any case, medium term outlook will stay bearish as long as 0.9772 resistance holds. Current down trend could extend to 38.2% retracement of 0.7065 (2011 low) to 1.0342 (2016 high) at 0.9090.
USD/JPY Daily Outlook
Daily Pivots: (S1) 109.69; (P) 110.06; (R1) 110.59; More...
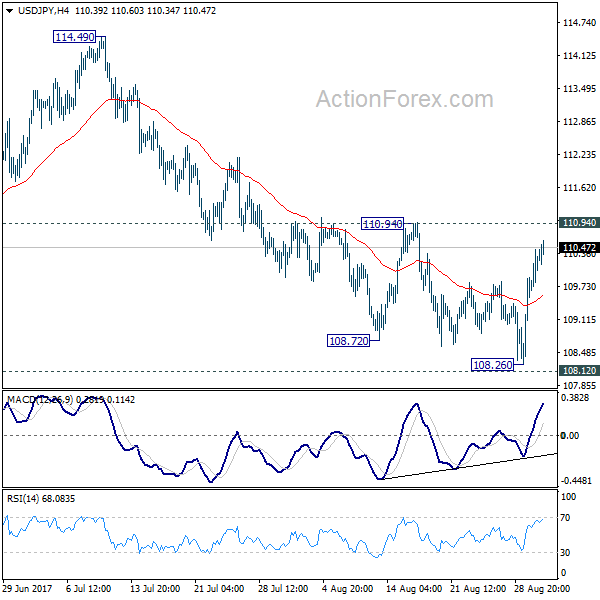
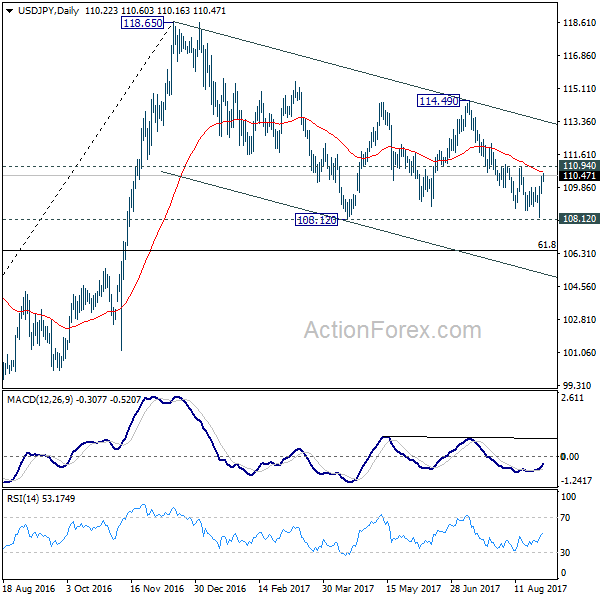
Intraday bias in USD/JPY stays neutral as it's bounded in range of 108.26/110.94. With 110.94 resistance intact, near term outlook stays mildly bearish and deeper decline is expected. Firm break of 108.12 support will resume the whole corrective decline from 118.65. In that case, USD/JPY will target 61.8% retracement of 98.97 to 118.65 at 106.48. Nonetheless, considering bullish convergence condition in 4 hour MACD, break of 110.94 will indicate near term reversal and bring stronger rebound back towards 114.49 resistance.
In the bigger picture, the corrective structure of the fall from 118.65 suggests that rise from 98.97 is not completed yet. Break of 118.65 will target a test on 125.85 high. At this point, it's uncertain whether rise from 98.97 is resuming the long term up trend from 75.56, or it's a leg in the consolidation from 125.85. Hence, we'll be cautious on topping as it approaches 125.85. If fall from 118.65 extends lower, downside should be contained by 61.8% retracement of 98.97 to 118.65 at 106.48 and bring rebound.
Dollar Maintaining Data Inspired Gains, Yen Broadly Lower as Risk Aversion Eased
Dollar is trading firm is Asian session today and maintains overnight gains inspired by positive ADP and GDP data. That was accompanied mild strength in stocks, with DOW closed up 0.12%. 10 year yield also edged higher by gaining 0.007 to 2.143. Dollar index dived to as low as 91.62 yesterday but seems to be getting strong support fro 91.91/3 key level and rebounded. The key will lie in tomorrow's non-farm payroll report. As risk aversion eased, Yen is trading in red against all other major currencies for the week, except Canadian Dollar. Gold also pares back much of this week's gain and is back pressing 1300, after hitting as high as 1331.9 earlier in the week. The Loonie is weighed down by weakness in oil price which sees WTI dips to as low as 45.58.
Trump laid the onus on Congress for tax reform
US President Donald Trump finally made his first major speech on tax reform yesterday. Trump highlighted a few key targets including simpler tax codes, lowering tax burden on US businesses and cutting rates, cutting tax rates for the middles and bring back overseas parked cash. He painted the picture that lowering business tax rates will boost job growth and wages. However, there was practically no details on the plan. Additionally, there was no counter arguments to claims that his proposal would eventually help the wealthy the most. Instead, Trump laid the onus on Congress and said he's "fully committed to working with Congress to get this job done" and "I don't want to be disappointed by Congress".
EU Verhofstadt: Brexit transition can only be status quo
Guy Verhofstadt, European Parliament's Brexit coordinator, said that the negotiation won't have sufficient progress by October "if it goes very slow, as is the case at the moment". And he criticized that "if only one party around the table is putting a position and the other party is not responding then it is difficult to start a negotiation." At the same time, he also pointed out that "the more and more time we lose in the coming months, the more and more it is clear that the transition period can only be the prolongation of the existing situation, of the status quo."
UK Brexit Secretary David Davis called for being "flexible and imaginative" to resolve the negotiation deadlocks. But EU chief negotiator Michel Barnier expressed his frustrations on the topic. Barnier said that "to be flexible you need two points, our point and their point," and "we need to know their position and then I can be flexible." And Barnier insisted that the guidelines on the talks were designed for "serious and constructive negotiations" and urged "clear UK positions on all issues".
The third round of negotiation will conclude today. It seems there is still quite some distance to achieve significant progress for EU to give green lights to start the talks on trade agreements in October.
BoJ Masai: Economy is gaining momentum for 2% inflation
BoJ board member Takako Masai said that there is still "some distance" to achieve the 2% inflation target. However, she believed that "momentum towards achieving the target is strengthening." Steady rise in household income and tightening job markets will eventually boost domestic demand and push inflation up to target. BoJ has repeatedly pushed back the timing for hitting the 2% inflation target. And now, the central bank projected it will be achieved by March 2020. Masai said that the delay was "unfortunate" and emphasized that it's important to "pursue policy to lay the groundwork for achieving 2 percent inflation."
ANZ business confidence points to broad based economic expansion
New Zealand ANZ business confidence dropped to 18.3 in August, down from 19.4. That is, a net 18.3% of firms surveyed expect general business condition to improve over the coming year. ANZ bank chief economist Cameron Bagrie said that theses are "healthy readings for confidence, activity expectation, investment and employment across all sectors and regions". And, there is a broad-based economic expansion in operation".
RBNZ governor Graeme Wheeler said yesterday that "a lower New Zealand dollar is needed to increase tradables inflation and help deliver more balanced growth." And, "the appreciation in the exchange rate has been a headwind for the tradables sector and, by reducing already weak tradables inflation, made it more difficult to reach the Bank's inflation goals."
On the data front
China official PMI manufacturing rose to 51.7 in August, up from 51.4 and beat expectation of 51.3. Official PMI non-manufacturing dropped to 53.4, down from 54.5. Japan industrial production dropped -0.8% mom in July, versus expectation of -0.3% mom. Australia private capital expenditure rose 0.8% in Q2. New Zealand ANZ business confidence dropped to 18.3 in August, down from 19.4. UK Gfk consumer confidence rose to -10 in August.
Eurozone CPI is the key focus in European session. Eurozone will also release unemployment rate. Germany will release retail sales and unemployment. Later in the day, Canada will release GDP. US will release jobless claims, personal income and spending, Chicago PMI, pending home sales.
USD/JPY Daily Outlook
Daily Pivots: (S1) 109.69; (P) 110.06; (R1) 110.59; More...
Intraday bias in USD/JPY stays neutral as it's bounded in range of 108.26/110.94. With 110.94 resistance intact, near term outlook stays mildly bearish and deeper decline is expected. Firm break of 108.12 support will resume the whole corrective decline from 118.65. In that case, USD/JPY will target 61.8% retracement of 98.97 to 118.65 at 106.48. Nonetheless, considering bullish convergence condition in 4 hour MACD, break of 110.94 will indicate near term reversal and bring stronger rebound back towards 114.49 resistance.
In the bigger picture, the corrective structure of the fall from 118.65 suggests that rise from 98.97 is not completed yet. Break of 118.65 will target a test on 125.85 high. At this point, it's uncertain whether rise from 98.97 is resuming the long term up trend from 75.56, or it's a leg in the consolidation from 125.85. Hence, we'll be cautious on topping as it approaches 125.85. If fall from 118.65 extends lower, downside should be contained by 61.8% retracement of 98.97 to 118.65 at 106.48 and bring rebound.
Economic Indicators Update
| GMT | Ccy | Events | Actual | Forecast | Previous | Revised |
|---|---|---|---|---|---|---|
| 23:01 | GBP | GfK Consumer Confidence Aug | -10 | -13 | -12 | |
| 23:50 | JPY | Industrial Production M/M Jul P | -0.80% | -0.30% | 2.20% | |
| 1:00 | NZD | ANZ Business Confidence Aug | 18.3 | 19.4 | ||
| 1:00 | AUD | HIA New Home Sales M/M Jul | -6.90% | |||
| 1:00 | CNY | Manufacturing PMI Aug | 51.7 | 51.3 | 51.4 | |
| 1:00 | CNY | Non-manufacturing PMI Aug | 53.4 | 54.5 | ||
| 1:30 | AUD | Private Capital Expenditure Q2 | 0.80% | 0.20% | 0.30% | 0.90% |
| 5:00 | JPY | Housing Starts Y/Y Jul | -0.30% | 1.70% | ||
| 6:00 | EUR | German Retail Sales M/M Jul | -0.60% | 1.10% | ||
| 7:55 | EUR | German Unemployment Change Aug | -6K | -9K | ||
| 7:55 | EUR | German Unemployment Rate Aug | 5.70% | 5.70% | ||
| 9:00 | EUR | Eurozone Unemployment Rate Jul | 9.10% | 9.10% | ||
| 9:00 | EUR | Eurozone CPI Estimate Y/Y Aug | 1.40% | 1.30% | ||
| 9:00 | EUR | Eurozone CPI - Core Y/Y Aug A | 1.20% | 1.20% | ||
| 11:30 | USD | Challenger Job Cuts Y/Y Aug | -37.60% | |||
| 12:30 | CAD | GDP M/M Jun | 0.10% | 0.60% | ||
| 12:30 | USD | Initial Jobless Claims (AUG 26) | 237K | 234K | ||
| 12:30 | USD | Personal Income Jul | 0.30% | 0.00% | ||
| 12:30 | USD | Personal Spending Jul | 0.40% | 0.10% | ||
| 12:30 | USD | PCE Deflator M/M Jul | 0.10% | 0.00% | ||
| 12:30 | USD | PCE Deflator Y/Y Jul | 1.40% | 1.40% | ||
| 12:30 | USD | PCE Core M/M Jul | 0.10% | 0.10% | ||
| 12:30 | USD | PCE Core Y/Y Jul | 1.40% | 1.50% | ||
| 13:45 | USD | Chicago PMI Aug | 59.2 | 58.9 | ||
| 14:00 | USD | Pending Home Sales M/M Jul | 0.50% | 1.50% | ||
| 14:30 | USD | Natural Gas Storage | 43B |
Market Morning Briefing: Further Rise To 110.50 Has Been Seen In Dollar-Yen
STOCKS
Almost all major stocks are trading higher today except Shanghai.
Dow (21892.43, +0.12%) has moved up to test immediate resistance near 21950. We wait to see if the index faces any rejection from here which could push it back towards 21750. Else a break above 21950 could indicate an extension on the upside for the near term.
Dax (12002.47, +0.47%) bounced back slightly but does not look very strong just now. Downside possibility remains open towards 11900-11800 while below 12300.
Sharp recovery on the Dollar Index and Dollar Yen has aided to a pull back in Nikkei too. Nikkei (19647.97, +0.72%) has clearly bounced back above 19600 and could now head towards 19700-19800 levels in the coming sessions.
Shanghai (3347.55, -0.48%) has shown first signs of rejection from 3375 levels and could come off towards 3275 in the near term before again bouncing back. Near term looks bearish.
Nifty (9884.40, +0.90%) held below 9925 yesterday too and could trade within 9800-9950 region in the near term as mentioned in our earlier editions. Sideways consolidation within the mentioned range is possible for at least another 3-4 sessions.
COMMODITIES
Although Gold (1307) had responded to its highly overbought condition and moved lower in line with our expectation, but there will be no change in the immediate trading range of 1280-1350, with a pivot at 1300 levels. We will remain bullish on gold while it is trading above 1280 regions. There was no such movement in Silver (17.32) yesterday, but it could also move lower towards 16.90 levels to gather fresh buying momentum.
Copper (3.08) is trading within the narrow range of 3.00-3.12. Only above 3.12, higher resistances of 3.26 can come into consideration. The only concern in the short term overbought condition which may drag the price towards 3.00 levels. But we will remain bullish on copper while it is trading above 2.88 levels in the medium term time frame.
10th consecutive weeks of fall (-5.4M B) in U.S oil inventory but there was hardly any refection on the price action. Brent (50.65) moved lower towards its channel support of 49.83 along with WTI (45.93), which is still trading within the midterm bearish channel. Thus We will remain neutral on Brent and WTI, while they are trading below 52.80 and 49 levels on a weekly closing basis.
FOREX
Strong recovery in the Dollar Index (93.00) from the low of 91.62 seen on Tuesday, just above 91.39, the 50% retracement of the earlier rise from 78.91 (May 2014) to 103.82 (Jan 2017). If the momentum of the current bounce continues, we may see 93.40 and 94.00-94.30 on the upside, but we also note trend Resistance at 93.25.
Higher than expected US Q2 GDP preliminary data yesterday (+3.00% against expectation of +2.7%) has helped the Dollar recover and induced further profit-taking in the Euro (1.1877). We have to see whether the near-term Support at 1.18 (mentioned yesterday) holds or not. If not, then a further dip to 1.1750 can be seen.
Further rise to 110.50 has been seen in Dollar-Yen (110.52) yesterday, in line with reading. Immediate Resistance seen at 110.65 now and then series of Resistances available up to 111.35. So, maybe we may see a bit of a corrective dip towards 110.10-109.90. Note that the Resistance at 132.00-25 is holding well enough on Euro-Yen (131.28) and can trigger an intra-day dip to 130.80-60 before a fresh rise towards 132.25-50.
Despite the bounce from 1.2773 to 1.2978 this week, the Pound (1.2911) is not displaying much strength. Given the recovery in the Dollar now, it may range between 1.2825-2925 for a few days while trying to figure out longer term direction.
The 200-week MA at 0.80 on the Aussie (0.7909) mentioned yesterday has held well and pushed the Aussie down. We need to see if the mentioned Support at 0.79 holds and propels the Aussie higher towards 0.81. Failure to bounce from 0.7900, or max 0.7865, would be a blow to the currently preferred bullish possibility.
Small recovery in Dollar-Yuan (USDCNY = 6.5962) as well. Dollar-Rupee trades 64.04/07 on the NDF and is expected to continue to move sideways between 63.90-64.10 in the near term.
INTEREST RATES
The German-US 2 Yr Spread (-2.10%) has dropped but the German-US 10Yr Spread (-1.77%) is hovering around between -1.79-1.75 regions. yesterday, Euro had moved lower, seems to be responding more to the German-US 2Yr Spread in short term time frame. If the German-US 2Yr Spread could manage to rebound from its support at -2.09-10 levels then it could possible pull up the Euro too.
The benchmark US 10Yr yield has rebound from 2.09 levels due to the positive GDP figures and expected to remain stable at current levels of 2.14 for the rest of the week. But there are rooms for further downside towards 1.97 if the US 10Yr will close below 2.09% on a daily closing basis.
Muted price action has been seen in the Japanese 5Yr JGB (-0.14%) and the 30Yr JGB (+0.83%) as they are hovering around their respective supports, suggesting a possible bounce in near term time frame.
UK 5Yr and 30Yr Gilt Yields find support at 0.42 and 1.56 levels and moved up (5Yr 0.44% and 30Yr 1.59%) but the 10Yr is still trading at 1.00 regions with no sign of recovery.
Daily Technical Analysis: EURUSD, GBPUSD, USDJPY, USDCHF
EURUSD
The EURUSD had a bearish momentum yesterday bottomed at 1.1880. The bearish pin bar on daily chart I showed you yesterday gave us a valid bearish signal. The bias is bearish in nearest term testing 1.1800 – 1.1770 region. Immediate resistance is seen around 1.1950. A clear break above that area could lead price to neutral zone in nearest term testing 1.2000. Overall I remain bullish but need a clear break above 1.2070 to end the current bearish correction phase and reactivate my bullish mode targeting 1.2175 or higher.
GBPUSD
The GBPUSD had another indecisive movement yesterday. There are no changes in my technical outlook. The bias remains neutral in nearest term. Price has been moving sideways between 1.2980 – 1.2870 range area since Monday and we need a clear break from that range area to see clearer direction. A clear break and daily close below 1.2870 would expose 1.2775/00 region. On the other hand, a clear break and daily close above 1.2980 would expose 1.3050 – 1.3100 region or higher. Overall I remain neutral.
USDJPY
The USDJPY had a bullish momentum yesterday, broke above 109.85 resistance and hit 110.54 earlier today in Asian session. The bullish pin bar on daily chart I showed you yesterday gave us a valid bullish signal. The bias is bullish in nearest term testing 111.00 region, which located around the daily EMA 200. Immediate support is seen around 109.85. A clear break back below that area could lead price to neutral zone in nearest term as direction would become unclear. Overall I am neutral in this pair.
USDCHF
The USDCHF had a bullish momentum yesterday topped at 0.9645. The bullish pin bar I showed you yesterday gave us a valid bullish signal. The bias remains bullish in nearest term testing 0.9700 – 0.9765 area. Immediate support is seen around 0.9580. A clear break and daily close back below that area could lead price to neutral zone in nearest term as direction would become unclear testing 0.9525 area but key support remains at 0.9450 region.