Sample Category Title
EURUSD Cracked Pivotal Supports at 1.1910 Zone
The Euro cracked pivotal supports at 1.1910 zone on fresh bearish acceleration after upbeat US ADP private sector jobs data (237K in Aug vs 183K forecast) inflated the dollar. The single currency came under increased pressure, generating stronger signals for completion of reversal pattern, forming on daily chart. Close below 1.1900 is needed for confirmation and signal of deeper correction. Rising daily Tenkan-sen (1.1889) is under pressure, with break lower to open pivots at 1.1841 (daily Tenkan-sen) and 1.1818 (Fibo 61.8% of 1.1662/1.2070 upleg).
Res: 1.1984; 1.2000; 1.2070; 1.2101
Sup: 1.1889; 1.1866; 1.1841; 1.1818
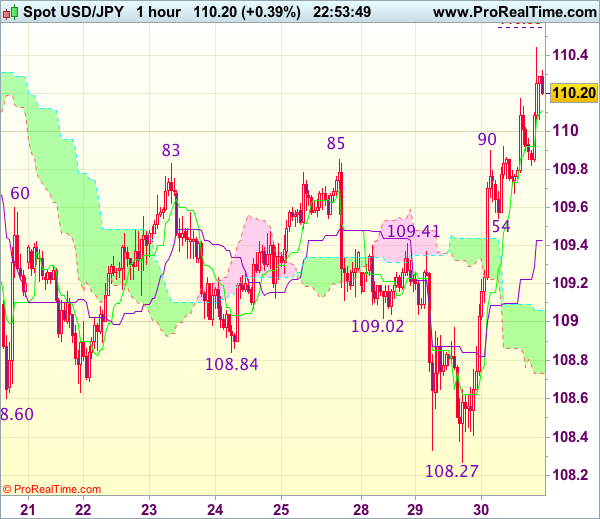
Trade Idea Wrap-up: USD/JPY – Buy at 109.55
USD/JPY - 110.16
Most recent candlesticks pattern : N/A
Trend : Near term up
Tenkan-Sen level : 110.13
Kijun-Sen level : 109.55
Ichimoku cloud top : 109.06
Ichimoku cloud bottom : 108.73
Original strategy :
Buy at 109.55, Target: 110.55, Stop: 109.20
Position : -
Target : -
Stop : -
New strategy :
Buy at 109.55, Target: 110.55, Stop: 109.20
Position : -
Target : -
Stop : -
As the greenback has staged a strong rise after holding above previous chart support at 108.13, suggesting the decline from 114.50 has ended at 108.27 yesterday and mild upside bias is seen for this move to bring retracement of recent decline, hence bullishness remains for further gain to 110.55 (61.8% projection of 108.27-109.90 measuring from 109.54), however, reckon 110.75-80 would limit upside and price should falter below resistance at 110.95, bring retreat later.
In view of this, would not chase this rise here and we are looking to buy dollar on pullback as support at 109.54 should limit downside and bring another upmove. Below said support (this would also penetrate the Kijun-Sen now at 109.55) would defer and suggest an intra-day top is formed instead, bring weakness to 109.05-10 first.
USD/JPY – Dollar Gains as US GDP Sparkles
USD/JPY has posted gains in the Wednesday session. In North American trade, the pair is trading at 110.22, up 0.45% on the day. On the release front, Japanese Retail Sales jumped 1.9%, easily beating the forecast of 1.0%. In the US, Preliminary GDP impressed with a sharp gain of 3.0%, beating the estimate of 2.7%. There was more positive news from the employment front, as ADP Nonfarm Payrolls jumped to 237 thousand, crushing the forecast of 185 thousand. Later in the day, Japan releases Preliminary Industrial Production, with the markets braced for a decline of 0.4%. On Thursday, there are a host of key events in the US, led by unemployment claims.
The US economy continues to perform well, and this was underscored on Wednesday, as Preliminary GDP (second estimate) for the second quarter was revised to 3.0%. This figure was a marked improvement from the first estimate of 2.6%. Consumer confidence and spending remain strong and helped contribute to second quarter growth, which posted its strongest gain since the first quarter of 2015. However, solid consumer spending has failed to boost inflation, which continues to hover at low levels. The lack of inflation could hamper the Federal Reserve's plans to raise interest rates, with the likelihood of a rate hike in December standing at just 35%. On the employment front, ADP Nonfarm Payrolls jumped to 237 thousand, marking a 3-month high. The official Nonfarm Payrolls report will be released on Friday, and if this indicator also beats the forecast, it would be a strong signal that the economic momentum has continued into the third quarter.
The Japanese yen is considered a safe-haven asset, with the currency often showing volatility following geopolitical tensions. This has been the case this week, as the yen initially posted gains after North Korea fired a missile over Japanese territory on Tuesday, drawing sharp condemnations from Japan and the US. The easing of tensions since the missile launch has enabled the US dollar to recover and push above the symbolic 110 level. Still, if North Korea decides to fire another missile towards Japan, it's a safe bet that the yen will gain ground.
Like other Western economies, Japan remains gripped with low inflation. This has resulted in the Bank of Japan keeping in place its ultra-accommodative monetary policy. Unlike the US and Europe, however, the BoJ has given no indications of tightening policy anytime soon, insisting that that inflation must first rise closer to its target of 2%. The economy is headed in right direction, as GDP has expanded for six consecutive quarters. In the second quarter, GDP impressed with a gain of 1.0%, well above the forecast of 0.6%. Still, with inflation nowhere near the BoJ's target, the bank's radical stimulus program is likely to remain in place for the foreseeable future.
Elliott Wave Analysis: GBPUSD Unfolding A Temporary Correction
Good day traders! Today's focus will be on the GBPUSD.
GBPUSD is turning up, but only for a three-wave correction viewed as blue wave two. We expect a bounce in three waves, as A-B-C rally up to 1.3032 resistance area from where new turn lower may occur later this week.
GBPUSD, 4H
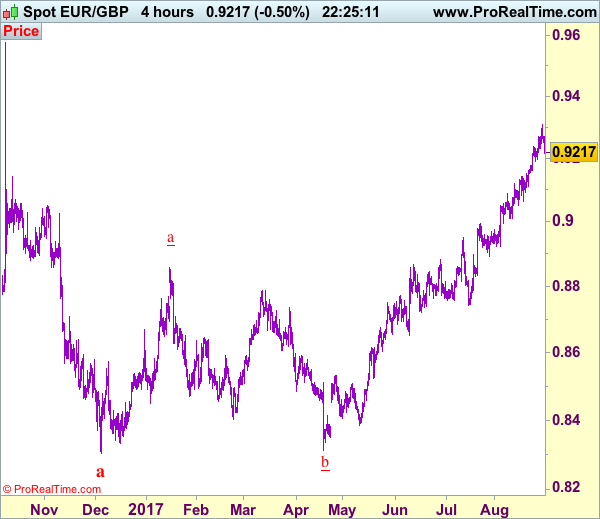
Trade Idea: EUR/GBP – Buy at 0.9145
EUR/GBP - 0.9220
Original strategy :
Buy at 0.9200, Target: 0.9320, Stop: 0.9160
Position : -
Target : -
Stop : -
New strategy :
Buy at 0.9145, Target: 0.9295, Stop: 0.9105
Position : -
Target : -
Stop : -
As the single currency has finally retreated after rising to 0.9307 yesterday, suggesting a temporary top has been formed there and consolidation below this level would be seen with initial downside bias for correction to 0.9189 support, however, reckon downside would be limited to 0.9145-50 (38.2% Fibonacci retracement of 0.8892-0.9307) and bring rebound later, above 0.9270-75 would suggest the pullback from 0.9307 has ended and bring retest of this level, break there would extend the major rise from 0.8304 to 0.9335-40 but weakening of near term upward momentum should prevent sharp move beyond 0.9365-70 and price should falter below 0.9395-00.
In view of this, would not chase this rise here and would be prudent to buy euro on subsequent pullback as 0.9145-50 would limit downside. Below support at 0.9111 would abort and risk correction of recent upmove to 0.9095-99 (50% Fibonacci retracement of 0.8892-0.9307), however, reckon 0.9050-51 (61.8% Fibonacci retracement and previous support) would hold, bring rebound later.
Our preferred count is that, after forming a major top at 0.9805 (wave V), (A)-(B)-(C) correction is unfolding with (A) leg ended at 0.8400 (A: 0.8637, B: 0.9491 and 5-waver C ended at 0.8400. Wave (B) has ended at 0.9413 and impulsive wave (C) has either ended at 0.8067 or may extend one more fall to 0.8000 before prospect of another rally. Current breach of indicated resistance at 0.9043 confirms our view that the (C) leg has ended and bring stronger rebound towards 0.9150/54, then towards 0.9240/50.
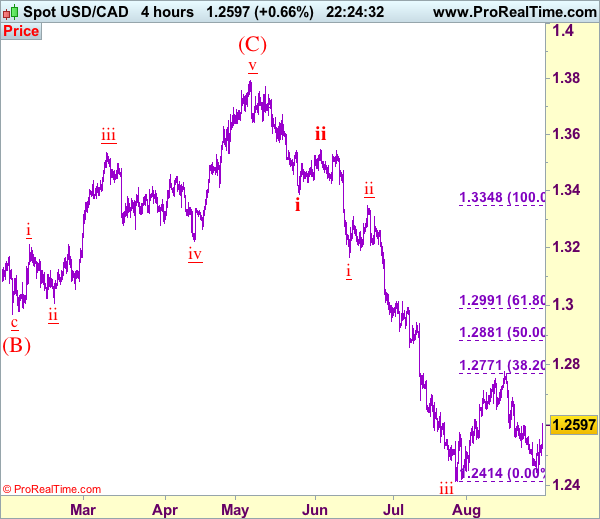
Trade Idea: USD/CAD – Exit short entered at 1.2595
USD/CAD - 1.2600
Original strategy :
Sold at 1.2595, Target: 1.2395, Stop: 1.2655
Position: - Short at 1.2595
Target: - 1.2395
Stop: - 1.2655
New strategy :
Exit short entered at 1.2595,
Position: - Short at 1.2595
Target: -
Stop:-
Despite falling to 1.2441 yesterday, the subsequent strong rebound suggests the fall from 1.2778 has possibly ended there and upside risk is seen for further gain to 1.2640-50, however, as broad outlook remains consolidative, reckon upside would be limited to resistance at 1.2691 and price should falter below 1.2750, bring another decline. We are keeping our count that wave v as well as wave (C) ended at 1.3794 and impulsive wave (i ii, i ii) is now unfolding with minor wave iii ended at 1.2414, followed by wave iv correction possibly ended at 1.2778, wave v should extend towards 1.2300.
In view of this, would be prudent to exit short entered at 1.2595 and stand aside for now. Below 1.2550 (previous minor resistance) would bring weakness to 1.2500 but only break of latter level would suggest the rebound from 1.2441 has ended, bring another fall to this level, having said that, the greenback needs to penetrate indicated previous support at 1.2414 (wave iii trough) to confirm decline has resumed in wave v to 1.2350 and then 1.2300-10.
To recap, wave B from 1.3066 is unfolding as an a-b-c and is sub-divided as a: 1.2192, b: 1.2716 and wave c is a 5-waver with i: 1.1983, ii: 1.2506, extended wave iii with minor iii at 1.0206, wave iv ended at 1.0781 and wave v as well as wave iii has ended at 0.9931, hence the subsequent choppy trading is the wave iv which is unfolding as (a)-(b)-(c) with (a) leg of iv ended at 1.0854, followed by (b) leg at 1.0108 and (c) leg as well as the wave iv ended at 1.0674. The wave v is sub-divided by minor wave (i): 0.9980, (ii): 1.0374, (iii): 0.9446, (iv): 0.9913 and (v) as well as v has possibly ended at 0.9407, therefore, consolidation with upside bias is seen for major correction, indicated target at 1.3700 and 1.4000 had been met and further gain to 1.4700 would be seen later.
Weak CHF Fails to Lift Sentiment, SNB to Keep Policy Easier for Longer
Recent weakness in Swiss franc against the euro has not yet boosted Switzerland's economic outlook in a meaningful way, evidenced by the disappointing KOF indicator and Credit Suisse (formerly conducted by ZEW) investor sentiment index for August. While, at the meeting on September 14, the SNB would certainly affirm the stance that the franc remains "overvalued" and the pledge the combat deflation, we are concerned that there would still be a long way to go for the country's economy to get back in shape, as the pass-through of exchange rate into inflation is subdued. Meanwhile, a recent study by the SNB suggests that its monetary policy would have to stay relatively more accommodative (than ECB's) for longer to push inflation higher. We believe this reinstates the central bank's commitment to leave the policy unchanged.
Economic and Investor Sentiment Fell
The KOF indicator surprisingly fell to 104.1 in August from an upwardly revised 108 a month ago. This came in weaker than 107. As the accompanying statement noted, the reading points to "a continuation of growth with rates above average, but no further acceleration should be expected". The disappointment was mainly driven by "more pessimistic assessment of the domestic firms' competitiveness", despite the recent depreciation of the Swiss franc. On a separate note, the Credit Suisse investor sentiment index fell -9.7 points to 25 in August. July retail sales and August manufacturing PMI data would be due Friday, while the 2Q17 GDP growth and the August inflation reports would be released on September 5. However, we believe the dataflow would unlikely deviate from the big picture of lackluster growth.
SNB to Keep Swiss Franc Weak
EURCHF will probably record modest pullback in August, after soaring +4.54% in July. While in consolidation over the past weeks, EURCHF has remained firm after rallying to 1.1537, the highest since SNB scrapped the 1.2 EURCHF floor in January 2015, on August 4. However, recent rise in safe-haven demand and broad-based weakness in US dollar have sent USDCHF to the lowest in 2 years, erasing all franc's depreciation against the greenback from mid-July to early-August. We believe the SNB is more tolerable over franc's strength against USD. Indeed, the mild increase in sight deposit over the past weeks has also signaled limited SNB intervention.
Certainly, SNB would prefer to see the franc to weaken further against the euro. Therefore, it would unlikely alter the monetary stance at the policy meeting on September 14, a week after the ECB meeting.
Accommodative Monetary Policy would Stay for Long Period of Time
SNB's major concern of Swiss economy is weak inflation. However, the central bank's working papers have revealed that the pass-through of exchange rate into Swiss inflation (i.e. weak currency of a country would eventually boost inflation) is very subdued (https://www.snb.ch/n/mmr/reference/economic_studies_2007_04/source/economic_studies_2007_04.n.pdf). In a recent working paper (https://www.snb.ch/n/mmr/reference/working_paper_2017_07/source/working_paper_2017_07.n.pdf), the SNB even suggests that, if ECB adjusts its monetary policy in response to a positive shock that drives up Eurozone inflation, SNB should maintain a relatively "less restrictive" monetary policy than the ECB. The paper noted that "as a result of the change in the relative monetary policy stance, the Swiss franc depreciates and inflation picks up even somewhat more than in the Eurozone". It suggests that the pass-through would be higher if SNB maintains a more accommodative monetary policy than the ECB for longer. We believe these findings reinstate the central bank's commitment to leave the policy unchanged for some time.
Investors Brush Away North Korea Concerns
"Sell volatility, buy the dip" has been the investor mindset for some time, when it comes to the equity markets. It appears that this mindset is holding firm, after investors brushed away the market uncertainty that was created in the early hours of Tuesday morning, following the news that North Korea fired a missile over Japan.
That said, I can't remember seeing such a rapid reversal of market fortunes as we saw yesterday, at least since Donald Trump shocked the world by winning the US elections in November 2016. Could yesterday's reversal have occurred because North Korean risks have been priced into the markets? I am unsure, because any news around North Korea is unpredictable at best; the announcement from North Korea that the firing of a missile over Japan was the first step of military operations in the Pacific, is something that investors simply cannot afford to ignore.
Perhaps the contributing factor for the market recovery, was because the response from President Trump was more measured than his previous "fire and fury" rhetoric that spooked investors earlier in August.
Is the Euro now a safe haven?
Much has been made about the Euro possibly emerging as a safe haven currency following the rapid appreciation to its highest levels since January 2015, but we shouldn't get carried away before we label the Euro as a new safe haven currency.
We have seen this trend in the past; when there is Dollar weakness, the correlation it encourages in terms of Euro strength is one of the easiest for traders to spot. The Euro did manage to peak at levels not seen since early 2015, at the same time that the Dollar dropped to its lowest levels since January 2015.
At the moment, investors are using any reason possible to buy the Euro, and they are also pricing in as much hawkish news from the European Central Bank (ECB), as can be expected before the next interest rate decision in September. The ECB will not be comfortable with the rapid appreciation in the Euro, but traders also know that the ECB will not be in a hurry to make changes to monetary policy. They want to price in as much in the Euro as they can, before taking profits on a pair that has rallied close to 14% year-to-date.
The likely eventual target for the EURUSD is probably between 1.22 - 1.25, which was roughly where the Eurodollar was trading, before traders priced in the fact that the ECB were set to announce its QE stimulus in January 2015. With expectations increasing that the ECB are going to announce an unwinding of QE as soon as September, we can consider the rally in the Euro over recent months, as "going full circle".
Dollar Index looking oversold
Traders need to remain mindful before jumping into any more selling positions, because the Dollar short is really starting to look like a crowded trade.
There is no doubt that the Dollar is horribly oversold, but the ongoing uncertainty when it comes to the ability of President Trump to implement his promised legislative reforms, and a reversal of ambition from the Federal Reserve to raise US interest rates are making traders very hesitant to purchase the Dollar from what looks like heavily oversold levels.
Additional anxiety over the debt ceiling, Nafta, geopolitics, and the likelihood that Federal Reserve Chair Janet Yellen could be replaced at the end of her term by someone more encouraged to support financial deregulation, are all seen as possible catalysts that could send the Dollar flying right through psychological support levels.
Investors need to pay very careful attention to where the Dollar concludes this month; if the Dollar Index does manage to conclude trading below 92, it increases the bias towards more sellers flooding the market. This could take the USD to levels not seen since investors began to price in that the Federal Reserve would raise US interest rates two years ago.
Still some time left to purchase the Yuan
After signaling a clear "buy" signal to the markets earlier in August, when the USD/CNH unexpectedly slipped through the psychological 6.70 level, the Chinese currency has exploded into buying pressure. Despite the advance this month, I think there is further room for appreciation.
If you compare the Chinese Yuan to a basket of different currencies, in terms of its performance year-to-date against the Dollar, you will see that the Yuan has only advanced around 5% against the Dollar in 2017. The Euro, Australian Dollar and Japanese Yen have all advanced more strongly against the Dollar; my view is that the Yuan needs to mirror the strength that has been noticed across these developed currencies. This one factor is behind why I am still bullish on the Yuan, while the market remains heavily negative on the Dollar.
6.55 is the likely eventual target for the USDCNH.
Dollar Rebounds; Euro Ignores Higher EMU Inflation
- European equities are up slightly more than 0.5%, which was mainly the gain at the opening (catching up with WS). During the session, there was no consistent directional bias. US equities open nearly flat.
- Eurozone economic confidence hit a pre-crisis high. The EC's economic sentiment indicator rose to 111.9 in August, compared to consensus forecasts and July reading of 111.3. The improvement was broad-based across sectors (manufacturing, services, retail and consumer). It points to ongoing strong or even stronger growth in Q3.
- The August US ADP employment report was very strong. ADP reported a net increase of 237 000 jobs in the private sector, more than the 185 000 expected. On top of it, the July job creation was revised higher to 201 000 from 178 000 reported previously. The gains were broad-based. It raises the expectations for Friday's payrolls report.
- Brits are still buying houses (surprise, surprise), but UK consumer credit appears to be coming off the boil, judging from the latest data of the BoE. Meanwhile, some companies at least appear to be borrowing while the going's good. Borrowing by manufacturing firms rose surprisingly strong.
- Moody's raised the growth forecasts of the euro area and sees now above potential growth in 2017 and 2018. It raised the forecasts for the German GDP to 2.2% this year and 2% next year. For France, it now sees 1.6% growth in both years (up from 1.3% and 1.4%), while even laggard Italy should grow by 1.3% in 2017/18 (up from 0.8%/1.1%).
- Analysts are still increasing the estimated cost of the passage of tropical storm Harvey, which is now making a second landfall, in Louisiana. History tells us that these costs impact short time some economic data, but not the underlying trend as repair work pushes growth higher beyond the short term.
- Spanish inflation rose to 2% Y/Y in August, up from 1.7% Y/Y in July and exceeding expectations for a 1.8% Y/Y increase. Belgian inflation crept higher to 1.9% Y/Y from 1.78% Y/Y previously.
- German HICP inflation rose to 1.8% Y/Y in August, up from 1.5% Y/Y in July and exceeding expectations for a 1.7% Y/Y increase. Coming on the heels of stronger Spanish HICP and Belgian HICP inflation, the risks for tomorrow's euro area inflation on the upside of the expected 1.4% Y/Y reading (up from 1.3% Y/Y in July). The higher inflation readings might be due to base effects and energy prices, more than increases in underlying inflation.
- US Q2 GDP was revised higher to an annualized 3% from 2.6% previously. The revision was largely due to the upward revision of consumption and business investment. That's a qualitative good revision and it likely leads to a bigger overhang for Q3, which may also come in around 3%.
Rates
Core bonds limit losses amid strong US/EMU eco data
Yesterday's potential technical trend reversal signal didn't find an audience today despite a batch of stronger-than-forecast eco data. The jury is still out with EMU CPI and US payrolls still coming this week. The damage in the German Bund and US Note future remained limited today. The US yield curve bear steepens with yields 0.7 bps (30-yr) to 2.2 bps (2-yr) higher. Changes on the German yield curve vary between +0.5 bps (2-yr) and +2.4 bps (10-yr). On intra-EMU bond markets, 10-yr yield spreads narrow up to 3 bps (Portugal).
The German Bund opened lower copying the US T-Note's losses in Asian dealings. The down-move was rapidly blocked though and followed by some technically insignificant return action higher. EC EMU confidence indicators, Spanish inflation and (regional) German inflation all beat consensus, but couldn't inflict losses on the Bund. The tepid comeback of (European) stock markets and weakness in oil prices (Hurricane Harvey after all?) offer a partial explanation. As US investors joined dealings, core bonds tested the intraday downside once more, but the move was lackluster in nature despite another stellar ADP-report which bodes well for Friday's US payrolls. The upward revision of US Q2 GDP to 3% Q/Qa also fell in deaf man's ears.
The Italian debt agency tapped the on the run 5-yr (€3B 0.9% Aug2022) and 10-yr BTP (€2.5B 2.05% Aug2027). The combined amount sold was the maximum of the targeted €4-5.5B. The auction bid cover was 1.58 which is rather good for Italian standards. Additionally, the Tesoro raised €1.75B via a floating rate note. The Finnish Treasury launched a new 10-yr benchmark via syndication (€3B Sep2027). The bond was priced to yield MS -24 bps, down from initial price takings around MS – 21 bps.
Currencies
Dollar rebounds; Euro ignores higher EMU inflation
The dollar extended the rebound which started yesterday in the US. Technical considerations prevailed, but good US eco data (strong ADP and upward revision of the US GDP) and positive risk sentiment reinforced the rebound. EMU inflation data were also higher than expected, but contrary to what was the case of late, they couldn't inspire euro bulls.
Overnight, Asian equity markets showed gains of about 0.5%/1.0% as uncertainty on North Korea subsided. USD/JPY held in the upper half of the 109 big figure as a better global sentiment supported the dollar across the board. EUR/USD stabilized in the 1.1975 area.
European markets also entered calmer waters after the constructive price action in the US yesterday evening, but the rebound of European equities was modest, given yesterday's losses. Still, the improved risk sentiment supported a further rebound of the dollar. EUR/USD dropped to the mid 1.1250 area. USD/JPY jumped temporary north of 110. The EMU eco data (EC confidence data, German inflation) were strong/better than expected, but the impact on EMU interest rates and on the euro was limited. Interest rate differentials were again no significant factor for FX (EUR/USD) trading. Global market sentiment and technical considerations (USD short squeeze) prevailed.
The dollar remained well bid as US traders joined the action and gained slightly further ground. A very strong ADP labour market report (237 000 net job growth) and a slight upward revision of the US Q2 GDP reinforced the dollar bid. Core yields returned to the intraday highs. USD/JPY trades in the 110.25 area. EUR/USD drifted to the low 1.19 area and trades currently at around 1.1925/30.
Conclusion: the dollar extended yesterday's rebound. A better risk sentiment supported the move, but technical considerations rather than fundamentals (data, expectations on the Trump administration) or interest rate differentials prevailed as driver for the rebound. EUR/JPY holds within reach of the recent highs which also indicates that the current move is a USD rebound rather than a euro correction. Key eco data later this week now have to decide whether there is room for a more fundamentally driven USD comeback.
EUR/GBP: profit taking, at last…
Global market positioning also dominated sterling trading today. The UK specific news flow remained sterling negative. The stalemate in the Brexit negotiations persists and the UK July money supply and lending data were softer than expected. Even so, EUR/GBP joined the correction of EUR/USD. EUR/GBP trades currently in the 0.9230 area. Remarkably, cable held up relatively well despite the overall USD rebound. This suggests some underlying GBP strength. We assume that technical considerations were also the main driver of this move. (profit taking on the recent, protracted EUR/GBP rally). At the same time, a further GBP-decline would at some point bring higher inflation again on the radar of the BoE. Let's call it some kind of self-destroying aspect of the recent GBP decline against the euro.
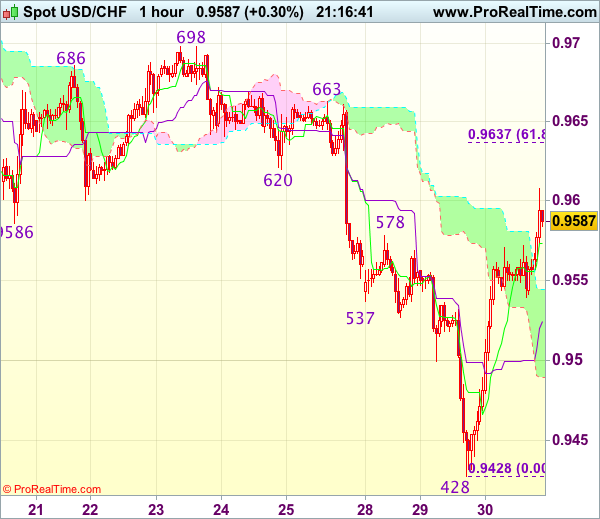
Trade Idea Update: USD/CHF – Buy at 0.9540
USD/CHF - 0.9597
New strategy :
Buy at 0.9540, Target: 0.9640, Stop: 0.9505
Position : -
Target : -
Stop : -
As the greenback found good support at 0.9428 and has staged a strong rebound, suggesting recent decline has formed a temporary low there and consolidation with upside bias is seen for gain to previous support at 0.9620 then 0.9637-40 (61.8% Fibonacci retracement of 0.9766-0.9428), however, near term overbought condition should prevent sharp move beyond resistance at 0.9663 and price should falter below 0.9698-99 resistance, bring retreat later.
In view of this, we are looking to buy dollar on pullback as 0.9539 support should limit downside and bring another rebound later. Below 0.9500-10 would defer and suggest first leg of rise from 0.9428 has ended, risk weakness to 0.9470 but price should stay well above said support at 0.9428, bring another rebound.