
Sample Category Title
GBP/USD Mid-Day Outlook
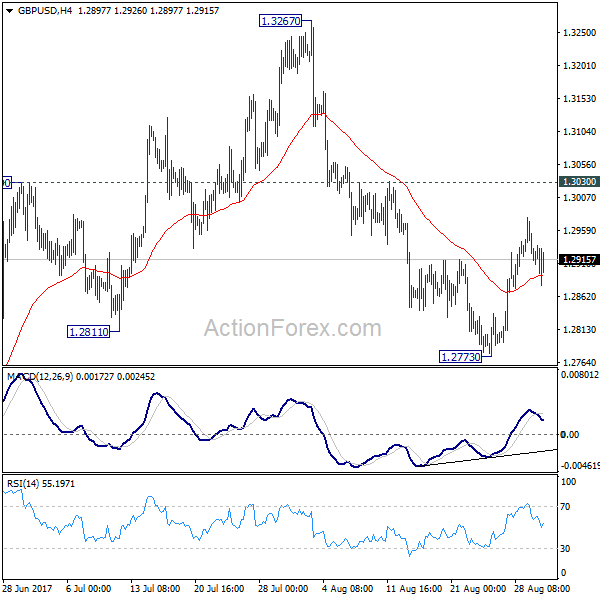
Daily Pivots: (S1) 1.2895; (P) 1.2937; (R1) 1.2959; More...
GBP/USD is staying in consolidation above 1.2773 temporary low and intraday bias remains neutral. We're favoring the case that correction from 1.1946 is completed at 1.3267. Below 1.2773 will target 1.2588 key near term support first. Decisive break of 1.2588 will confirm our view and target a test on 1.1946 low. Though, break of 1.3030 will dampen this bearish view and turn bias back to the upside for retesting 1.3267.
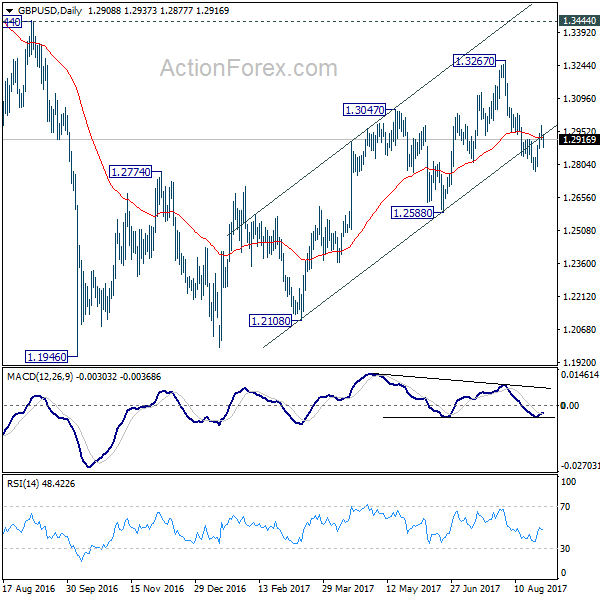
In the bigger picture, overall, price actions from 1.1946 medium term low are seen as a corrective pattern. While further rise cannot be ruled out, larger outlook remains bearish as long as 1.3444 key resistance holds. Down trend from 1.7190 (2014 high) is expected to resume later after the correction completes. And break of 1.2588 will indicate that such down trend is resuming.
USD/CHF Mid-Day Outlook
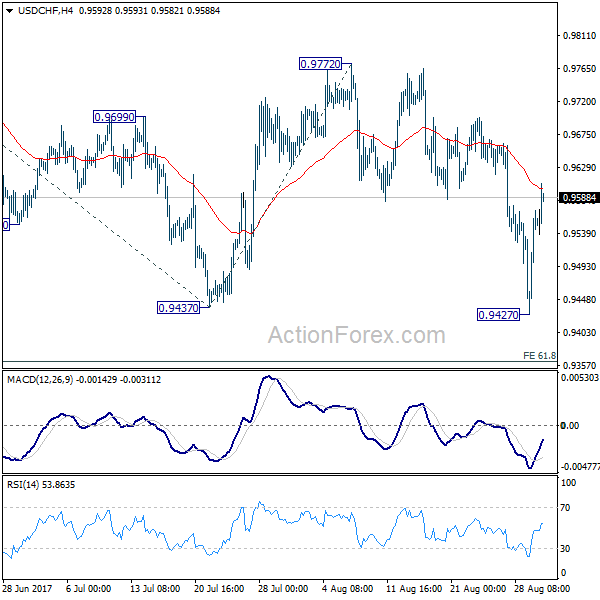
Daily Pivots: (S1) 0.9466; (P) 0.9513; (R1) 0.9599; More....
USD/CHF's rebound from 0.9427 is still in progress and intraday bias remains neutral. More consolidations could be seen considering that it's close to 0.9443 key support. Still, break of 0.9772 resistance is needed to confirm near term reversal. Otherwise, outlook stays bearish for another decline. Break of 0.9427 will target 61.8% projection of 1.0099 to 0.9437 to 0.9772 at 0.9363.
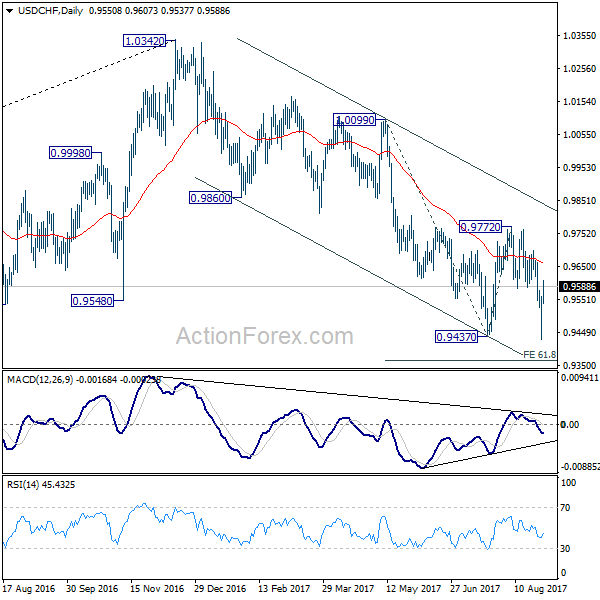
In the bigger picture, current development suggests that 0.9443 key support (2016 low) could be taken out firmly as down trend form 1.0342 extends. There are various interpretation of the price actions. But in any case, medium term outlook will stay bearish as long as 0.9772 resistance holds. Current down trend could extend to 38.2% retracement of 0.7065 (2011 low) to 1.0342 (2016 high) at 0.9090.
USD/JPY Mid-Day Outlook
Daily Pivots: (S1) 108.69; (P) 109.30; (R1) 110.34; More...
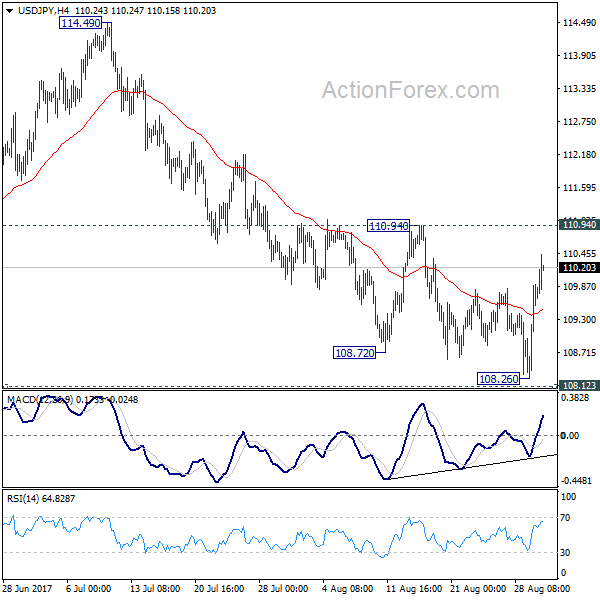
USD/JPY's rebound from 108.26 is still in progress but it's limited below 110.94 resistance so far. Intraday bias stays neutral with outlook mildly bearish. Firm break of 108.12 support will resume the whole corrective decline from 118.65. In that case, USD/JPY will target 61.8% retracement of 98.97 to 118.65 at 106.48. Nonetheless, considering bullish convergence condition in 4 hour MACD, break of 110.94 will indicate near term reversal and bring stronger rebound back towards 114.49 resistance.
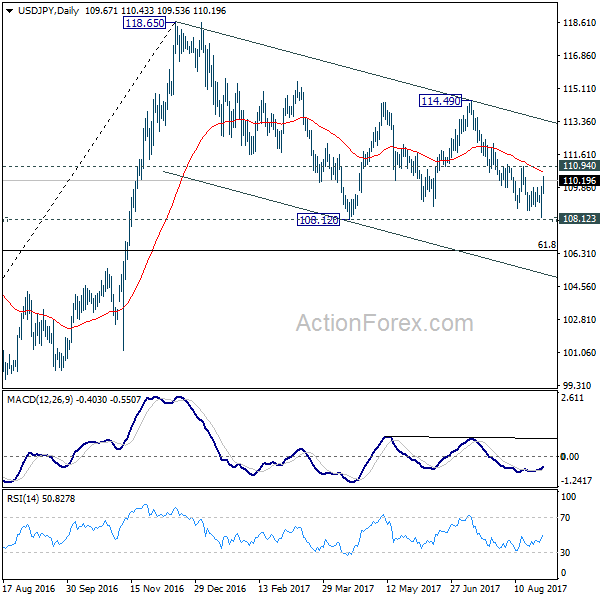
In the bigger picture, the corrective structure of the fall from 118.65 suggests that rise from 98.97 is not completed yet. Break of 118.65 will target a test on 125.85 high. At this point, it's uncertain whether rise from 98.97 is resuming the long term up trend from 75.56, or it's a leg in the consolidation from 125.85. Hence, we'll be cautious on topping as it approaches 125.85. If fall from 118.65 extends lower, downside should be contained by 61.8% retracement of 98.97 to 118.65 at 106.48 and bring rebound.
CAC Rebounds as North Korea Jitters Ease
The CAC index has recorded gains in the Wednesday session. Currently, the index is at 5,060.30, up 0.56% on the day. On the release front, there are no French or euro zone events. In the US, Preliminary GDP is expected to gain 2.7%. On Thursday, the euro zone releases CPI Flash Estimate for August, which is expected to show a gain of 1.4%.
European stock markets are showing volatility this week, as tensions in the Korean peninsula are again in the headlines. The CAC lost ground on Tuesday, after North Korea fired a ballistic missile which flew over northern Japan before crashing into the ocean. Japan and the US sharply condemned the missile launch, with President Trump saying that "all options remain on the table". With tensions once again climbing in the Korean peninsula, investors are bracing for more stock market losses, and both gold and the Japanese yen, which tend to rise in periods of crisis, have gained ground this week.
The euro continues to gain ground against the US dollar. The currency has soared 12.0% since April 1, and on Tuesday, the euro pushed above the 1.20 level for the first time since January 2017. The euro has benefited from stronger growth in the eurozone in 2017, led by robust growth in Germany. However, the euro's streak has weighed on the shares of automobile makers and other exporters, as a stronger euro has made exports more expensive. Investors are anticipating that the ECB will provide some guidance on plans regarding its asset purchase program (QE), which is scheduled to terminate in December. The ECB is widely expected to taper its QE program early next year, but so far has been mum about its plans. Analysts expect the ECB to address its stimulus package at the next policy meeting on September 7.
Last week's meeting of central bankers in Jackson Hole was a low-key affair. On Friday, ECB President Mario Draghi took a page out of Janet Yellen's page book, opting to steer away from any discussion about ECB monetary policy. Instead, Draghi spoke about the importance of free trade and financial reforms. Draghi seems to have learned a lesson from a meeting of central bankers in Portugal in June, when the markets seized on his comments that the euro zone was undergoing a broad recovery, and the euro soared. However, Draghi won't receive another free pass next month, when the ECB holds its next policy meeting, and is expected to address its ultra-accommodative monetary policy.
EUR/USD Mid-Day Outlook
Daily Pivots: (S1) 1.1921; (P) 1.1996 (R1) 1.2046; More...
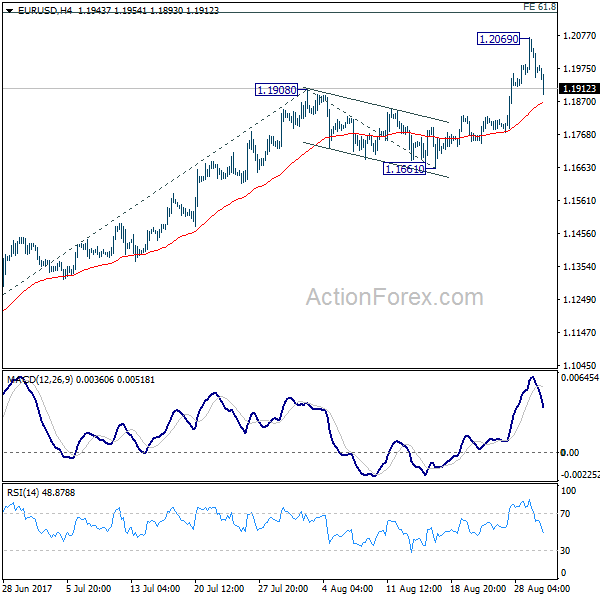
Retreat from 1.2069 extends lower today and deeper fall could be seen to 4 hour 55 EMA (now at 1.1866). But downside should be contained well above 1.1661 support to bring rise resumption. Above 1.2069 will extend the whole rally from 1.0339 to 61.8% projection of 1.1118 to 1.1908 from 1.1661 at 1.2149 first. Break there will target 100% projection at 1.2451 next.
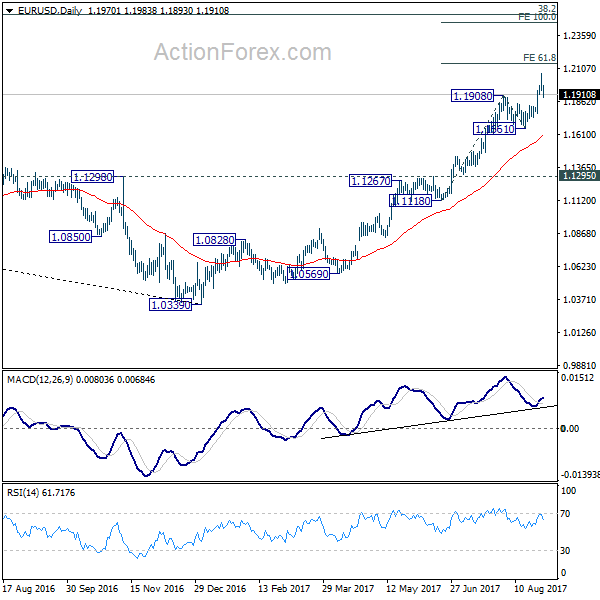
In the bigger picture, an important bottom was formed at 1.0339 on bullish convergence condition in weekly MACD. Sustained trading above 55 month EMA (now at 1.1768) will pave the way to key fibonacci level at 38.2% retracement of 1.6039 (2008 high) to 1.0339 (2017 low) at 1.2516. While rise from 1.0339 is strong, there is no confirmation that it's developing into a long term up trend yet. Hence, we'll be cautious on strong resistance from 1.2516 to limit upside. For now, medium term outlook will remain bullish as long as 1.1295 support holds, in case of pull back.
Dollar Rebound Extends after Solid ADP Employment, GDP Upward Revision
Dollar's rebound gathers additional steam in early US session after better than expected job data. AFP report showed 237k growth in private sector employment in August, beating expectation of 188k. Q2 GDP growth was also revised up to 3.0% annualized, up from 2.6% and beat expectation of 2.7%. Besides, US President Trump will finally kick-off his campaign on tax reform today. Trump will deliver a speech in Springfield, Missouri, and will likely tout the tax reform as a way to help the working class as well as the middle class. If the speech is consistent with Trump's usual rhetorics, it will likely focus on the "why" aspects of the reform. However, the markets would be more interested in know the "how" aspects of it. Nonetheless, for now, Dollar selling is likely past a climax and more upside is mildly in favor, at least until non-farm payroll release on Friday.
Risk aversion recedes as Korea tension didn't escalate
Risk aversion recedes today as the tension in Korea Peninsula didn't escalate after North Korea's firing of missile over Japan on Tuesday. The United Nations Security Council issued a condemned Presidential Statement and condemned North Korea for its "outrageous actions. UNSC demanded that the North-East Asia country "immediately cease all such actions." UNSC warned that the actions were "not just a threat to the region" but to "all UN Member States". And such actions "deliberately undermining regional peace and stability and have caused grave security concerns around the world." UNSC also demanded North Korea to "abandon all nuclear weapons and existing nuclear programs in a "in a complete, verifiable and irreversible manner, and immediately cease all related activities".
UK PM May in first official Japan visit
UK Prime Minister Theresa May arrives in Japan today for her first official visit. May is accompanied by a large British trade delegation and she'll have an informal dinner with Japan Prime Minister Shinzo Abe. Formal talks will begin tomorrow, focusing issues regarding Brexit and bilateral economic cooperation between the two countries. However, it's reported earlier in the week that Japan would refrain from any agreement with UK until the Brexit picture becomes clear. And it's perceived Abe would also be cautious with UK as he's concerned with an inward-looking post-Brexit UK.
Coming at a point just after North Korea fired a missile over Japan, defense and will involving East Asia will certainly be a topic of discussion too. May called the missile launch as a "reckless provocation" and illegal testes". May "strongly condemn them and we will be working with Japan and other international partners to ensure that pressure is put on North Korea to stop this illegal action." May also urged China to exert "further pressure" including extending sanction. But a Chinese foreign ministry spokesman said that the focus should be on de-escalating the tensions rather than "just chanting about sanctions".
Swiss KOF points to steady growth
Swiss KOF leading indicator dropped to 104.1 in August, down from 106.8, missed expectation of 107.0. That's the first decline in three months. Nonetheless, KOF pointed out that "it still points to a level clearly above its long-term average." And, since the readings in the last few months "do not reveal any clear down-or upward trend", it suggests " a continuation of growth with rates above average, but no further acceleration should be expected." Also from Swiss, UBS consumption indicator was unchanged at 1.38 in July.
Eurozone confidence improved
Confidence indicators in Eurozone generally improved in August. Business climate rose to 1.09, up from 1.05 and beat expectation of 1.05. Economic confidence rose to 111.9, up from 111.2, beat expectation of 111.3. Industrial confidence rose to 5.1, up from 4.5, above expectation of 4.7. Services confidence rose to 14.9, up from 14.1, above expectation of 13.9. Consumer confidence was finalized at -1.5. From Germany, CPI rose to 1.8% yoy in August, in line with consensus.
Elsewhere, Japan retail sales rose 1.9% yoy in July. Australia construction work done rose 9.3% in Q2, building approvals dropped -1.8% mom in July. New Zealand building permits dropped -0.7% mom in July. UK BRC shop price index dropped -0.3% yoy in August.
EUR/USD Mid-Day Outlook
Daily Pivots: (S1) 1.1921; (P) 1.1996 (R1) 1.2046; More...
Retreat from 1.2069 extends lower today and deeper fall could be seen to 4 hour 55 EMA (now at 1.1866). But downside should be contained well above 1.1661 support to bring rise resumption. Above 1.2069 will extend the whole rally from 1.0339 to 61.8% projection of 1.1118 to 1.1908 from 1.1661 at 1.2149 first. Break there will target 100% projection at 1.2451 next.
In the bigger picture, an important bottom was formed at 1.0339 on bullish convergence condition in weekly MACD. Sustained trading above 55 month EMA (now at 1.1768) will pave the way to key fibonacci level at 38.2% retracement of 1.6039 (2008 high) to 1.0339 (2017 low) at 1.2516. While rise from 1.0339 is strong, there is no confirmation that it's developing into a long term up trend yet. Hence, we'll be cautious on strong resistance from 1.2516 to limit upside. For now, medium term outlook will remain bullish as long as 1.1295 support holds, in case of pull back.
Economic Indicators Update
| GMT | Ccy | Events | Actual | Forecast | Previous | Revised |
|---|---|---|---|---|---|---|
| 22:45 | NZD | Building Permits M/M Jul | -0.70% | -1.00% | -1.30% | |
| 23:01 | GBP | BRC Shop Price Index Y/Y Aug | -0.30% | -0.40% | ||
| 23:50 | JPY | Retail Trade Y/Y Jul | 1.90% | 1.00% | 2.10% | 2.20% |
| 01:30 | AUD | Construction Work Done Q2 | 9.30% | 1.00% | -0.70% | 0.90% |
| 01:30 | AUD | Building Approvals M/M Jul | -1.70% | -5.00% | 10.90% | 11.70% |
| 06:00 | CHF | UBS Consumption Indicator Jul | 1.38 | 1.38 | 1.3 | |
| 07:00 | CHF | KOF Leading Indicator Aug | 104.1 | 107 | 106.8 | |
| 08:30 | GBP | Mortgage Approvals Jul | 69k | 65.5k | 64.7k | |
| 08:30 | GBP | M4 Money Supply M/M Jul | 0.50% | 0.40% | -0.20% | -0.10% |
| 09:00 | EUR | Eurozone Business Climate Indicator Aug | 1.09 | 1.05 | 1.05 | 1.04 |
| 09:00 | EUR | Eurozone Economic Confidence Aug | 111.9 | 111.3 | 111.2 | 111.3 |
| 09:00 | EUR | Eurozone Industrial Confidence Aug | 5.1 | 4.7 | 4.5 | |
| 09:00 | EUR | Eurozone Services Confidence Aug | 14.9 | 13.9 | 14.1 | 14.2 |
| 09:00 | EUR | Eurozone Consumer Confidence Aug F | -1.5 | -1.5 | -1.5 | |
| 12:00 | EUR | German CPI M/M Aug P | 0.10% | 0.10% | 0.40% | |
| 12:00 | EUR | German CPI Y/Y Aug P | 1.80% | 1.80% | 1.70% | |
| 12:15 | USD | ADP Employment Change Aug | 237K | 188K | 178K | 201K |
| 12:30 | USD | GDP (Annualized) Q2 S | 3.00% | 2.70% | 2.60% | |
| 12:30 | USD | GDP Price Index Q2 S | 1.00% | 1.00% | 1.00% | |
| 14:30 | USD | Crude Oil Inventories | -1.8M | -3.3M |
North Korean Nerves Subside | US ADP and GDP Under Focus
- Risk on trade is back in town
- More economic sanctions on North Korea could trigger some serious reaction
- DAX and Euro relationship matters
The major reason that we are seeing the risk on trade coming back to life is mainly due to the measured approach by the US. The president of the US is too occupied with the shattering situation caused by Hurricane Harvey. The White House this time issued a statement to address the missile launch by North Korea. A more measured approach like in the good old days, rather than adding fuel to the fire.
However, it may be stretched to say or think that the environment is completely calm now. The latest statement by North Korea is, that the country is still determined to perform more missile tests, which is keeping this situation very much alive. The UN has strongly condemned the country's launch of a missile over Japan and a reaction from the council is still to come. So the risk on trade may have a very short time to live.
More economic sanctions are very much on the cards for North Korea from the UN. However, that would be nothing new as the country is very much cut off from the outside world and there is only so much influence these sanctions could bring. China has also said that its patience is running very thin and the relationship could change its course soon if North Korea doesn't change its stance. Nonetheless, the reality is that actions speak louder and unless we see some concrete reaction from the country, it is highly unlikely that anything would change.
Moving away from North Korea, the DAX index is feeling the pain of the stronger euro. The country's export would have an adverse impact if the currency remains strong, and this strength in the currency has pushed the index below its 200 day MA. If we don't break above this moving average, the selling pressure could become intense and it also means the Euro could continue to become stronger.
Hurricane Harvey is going to impact the US economy. The Fed is going to struggle with any more interest rate hike because the results of the hurricane are looking catastrophic. Perhaps this Friday's USNFP would not have much influence, but we do expect the upcoming numbers for the next few months to show an increase in the unemployment claims. The labour market was the crown jewel for the Fed and if this starts to melt down, then we would be in trouble. Later today we have the US ADP and the revisions to the US Q2 GDP.
USDJPY Risk Reversal
The USDJPY pair has moved above the 109.79 resistance level, hitting 110.17, as risk-on sentiment returned to financial markets, as fears faded after yesterday's missile launch by North Korea.
After bouncing from a four-month trading low, of 108.27, the USDJPY pair is now trading back above the former weekly price high, ahead of the U.S ADP jobs report, and second quarter U.S GDP figures.
The USDJPY pair is bullish in the short and medium-term while trading above the key 109.79 level, with the pair remaining bearish in the long-term, below the 111.40 level.
Intraday technical resistance is located at 110.17 level, the H4 time-frame 200 period moving average, at 110.37. The daily and weekly time frame 50 period moving averages converge, between 110.95-99.
To the downside, USDJPY intraday technical support is located at 109.42, with the daily and weekly pivot points offering dual support, between 109.25-28.
Below 109.25, the 108.60 level becomes the main support area traders should watch.
EURUSD Continues to Correct Lower
The single currency has continued to correct lower against the U.S dollar during much of Wednesday's European trading session, with price-action hitting 1.1938, setting a fresh daily trading low.
After yesterday's surge towards 1.2070, buying demand above the 1.2000 level is lacking today, following a sharp risk-reversal. Traders are now position squaring, ahead of key economic data from Germany, and the United states.
The EURUSD pair is turning further bearish on an intraday basis, after falling below the 1.1960 support level, with price now trading between 50 and 100-hour moving averages.
Key technical support is found at the 1.1916 level, which represents key trendline and moving average support. Below the 1.1916 level, the euro risks further losses towards 1.1865 and 1.1844.
To the upside, key technical resistance is found at 1.1960 and the 50-hour moving average, at 1.1980.
Above 1.1980, the 1.2000 level comes into focus, with 1.2030-40 the key upside region to watch.
Investor Jitters Over North Korea Related Tensions Ease For Now
Greenback Rebounds on Easing North Korea Jitters.The U.S. dollar turned positive against a basket of major rivals as traders brushed aside concerns surrounding a North Korean missile launch over Japan. In the wake of the sharp swings seen in the dollar against major currencies on Tuesday, it is difficult to have a clear view on the dollar's near-term outlook, Andrew Bresler said, deputy head of sales trading in Asia – Pacific for Saxo Markets in Singapore, adding that U.S. economic data would be a focus in coming days. The dollar index last stood at 92.337, having recovered from Tuesday's low of 91.621, its lowest level since January 2015.
Franc Benefits As Investors Exit Other Safe Havens. The Swiss franc continued to be the main beneficiary of current risk-off vibes as the yen dipped due to the missile landed just off Japan's northern coast and other safe-haven rivals also returned their recent gains.
Dollar Recovers From Its 4-Month Low. The dollar held steady against the yen on Wednesday, having recovered from 4-1/2 month lows, as concerns over North Korea's latest missile test receded for now. North Korea's launch on Tuesday of a ballistic missile over Japan's northern island of Hokkaido had initially spooked investors, triggering a drop in U.S. bond yields and a slide in the dollar versus the yen.
Euro Holds Steady, Down From Tuesday's 2-1/2 Year Peak. The euro held steady at $1.1973, having retreated from Tuesday's high of $1.2070, which was the euro's strongest level since January 2015.
Commodities slightly lower. Commodities ended mostly in the red for the trading session, with gold giving back some of its intraday safe-haven gains and crude oil still being dragged lower by Harvey.
Oil Dips As U.S. Floods Cause Large-Scale Refinery Shutdowns. Oil prices slid on Wednesday as refinery shutdowns in the wake of Hurricane Harvey cut U.S. demand for crude, the most important feedstock for the petroleum industry. The oil-related Loonie was mostly lower against its peers due to the standstill in the U.S. oil industry and weaker risk appetite.