Sample Category Title
USD/CAD Continued Selling Pressures
USD/CAD selling continues. Hourly support is given at a distance at 1.2414 (27/07/2017 low) while resistance is now given at a distance at 1.2778 (15/08/2017 low). Expected to show continued short-term bearish move.
In the longer term, the pair has broken longterm support that can be found at 1.2461 (16/03/2015 low) before bouncing back. Strong resistance is given at 1.4690 (22/01/2016 high). The pair should head further lower.
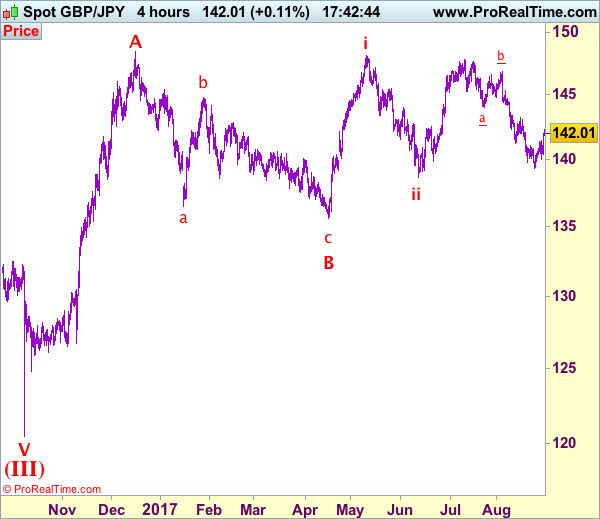
Trade Idea: GBP/JPY – Exit short entered at 142.00
GBP/JPY - 142.00
Original strategy:
Sold at 142.00, Target: 140.00, Stop: 142.60
Position: - Short at 142.00
Target: - 140.00
Stop: - 142.60
New strategy :
Exit short entered at 142.00
Position: - Short at 142.00
Target: -
Stop:-
As the British pound found renewed buying interest at 140.05 earlier this week and has staged a strong rebound, suggesting temporary low has been formed at 139.35 last week and near term upside risk remains for this rebound from there to extend gain to 142.50-60, however, reckon upside would be limited to 143.00 and resistance at 143.20 should remain intact, bring another decline later.
In view of this, would be prudent to exit short entered at 142.00 and stand aside for now. Below 141.40-45 would bring test of 140.95-00, break there would suggest top is possibly formed, then weakness to 140.40-45 would follow but only break of support at 140.05 would revive bearishness and signal the rebound from 139.35 has ended, then retest of this level would be seen eventually.
Our preferred count is that larger degree wave V with circle is unfolding from 251.12 with wave (I) 219.34, (II): 241.38 and wave (III) is subdivided into 1: 192.60, 2: 215.89 (23 Jul 2008) and wave 3 ended at 118.87 earlier in 2009. The correction from there to 162.60 is wave 4 which itself is a double three and is labeled as first a-b-c ended at 151.53, followed by wave x at 139.03, 2nd a ended at 162.60, 2nd b at 146.75 and 2nd c leg of wave 4 ended at 163.00. Therefore, the decline from 163.00 to 116.85 is now treated as wave 5 which also marked the end of larger degree wave (III), hence wave (IV) major correction has commenced for retracement of the wave (III) from 241.38 and upside target at 183.95-00 (50% Fibonacci retracement of the wave (II) from 241.38) had been met, a drop below 160.00 would suggest wave (IV) has ended at 195.85, bring decline in wave (V) for initial weakness to 130 (already met) and 120.
USD/CHF Bearish Pressures Increase
USD/CHF is heading lower. Strong resistance is given at 0.9771 (15/06/2017 high). The pair is likely to head further lower way below the broken hourly support at 0.9584 (08/11/2017 low). Expected to show growing continued bearish pressures.
In the long-term, the pair is still trading in range since 2011 despite some turmoil when the SNB unpegged the CHF. Key support can be found 0.8986 (30/01/2015 low). The technical structure favours nonetheless a long term bullish bias since the unpeg in January 2015.
USD/JPY Volatility Is Increasing
USD/JPY is now monitoring support at 108.13 (17/04/2017 low). Expected to show another leg lower.
We favor a long-term bearish bias. Support is now given at 96.57 (10/08/2013 low). A gradual rise towards the major resistance at 135.15 (01/02/2002 high) seems absolutely unlikely. Expected to decline further support at 93.79 (13/06/2013 low).
GBP/USD Bouncing Higher
GBP/USD bearish momentum has bounced around support given at 1.2774 (24/08/2017 high). Hourly resistance is given at 1.3031 (11/08/2017 high). Expected to show short-term bullish pressures.
The long-term technical pattern is even more negative since the Brexit vote has paved the way for further decline. Long-term support given at 1.0520 (01/03/85) represents a decent target. Long-term resistance is given at 1.5018 (24/06/2015) and would indicate a long-term reversal in the negative trend. Yet, it is very unlikely at the moment.
EUR/USD Consolidating Below 1.20
EUR/USD bullish pressures are strong despite ongoing consolidation. The pair has set a new hourly resistance at 1.2070 (29/08/2017 high) while hourly support lies at a distance at 1.1662 (17/08/2017 low). Expected to show increasing bullish pressures.
In the longer term, the momentum is now turning largely positive. We favour a continued bullish bias. Key resistance is holding at 1.2252 (25/12/2014 high) while strong support lies at 1.0341 (03/01/2017 low).
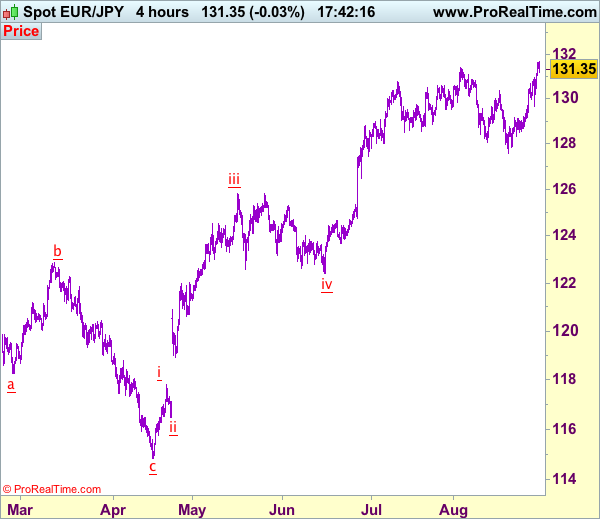
Trade Idea: EUR/JPY – Target met and buy at 130.50
EUR/JPY - 131.31
Original strategy:
Bought at 129.70, met target at 131.70
Position: - Long at 129.70
Target: - 131.70
Stop: -
New strategy :
Buy at 130.50, Target: 132.50, Stop: 129.90
Position: -
Target: -
Stop:-
The single currency has rallied after finding renewed buying interest at 129.66 yesterday, justifying our bullishness and our long position entered at 129.70 just met our upside target at 131.70 today, this anticipated breach of previous resistance at 131.40 confirms our view that recent upmove has resumed and extend gain to 132.00-10 but near term overbought condition should prevent sharp move beyond 132.50-60 and reckon 133.00-10 would hold from here, bring retreat later.
As we have taken profit on our long position entered at 129.70, would not chase this rise here and we are looking to buy euro on subsequent pullback as 130.45-50 should limit downside and bring another rise later. Below 130.00 would risk another test of said support at 129.66 but only break there would signal top is formed instead, risk correction to 129.10-15.
Our latest preferred count is that wave (ii) is ABC-X-ABC which ended at 123.33 and wave (iii) is unfolding with wave iii ended at 100.77, followed by wave iv at 111.57 and wave v as well as the wave (iii) has ended at 97.04, followed by wave (iv) at 111.43 and wave (v) has ended at 94.12 which is also the end of the larger degree v, this also implied the major wave (C) has also ended there, hence major correction has commenced from there with (A) leg unfolding in its lower degree wave c which has possibly ended at 145.69. Under this count, A-B-C wave (B) has commenced with A leg ended at 136.23, wave B at 143.79 and wave C has possibly ended at 149.79.
Our larger degree count is that the decline from 139.26 is wave (C) and is sub-divided into a diagonal triangle i-ii-iii-iv-v with wave i - 105.44, wave ii- 123.33, wave iii - 97.03, wave iv - 111.43, followed by the final wave v as well as the end of wave (C) at 94.12, this also mark the bottom of larger degree wave B. Under this count, major rise in wave C has commenced as an impulsive wave with minor wave III ended at 145.69, wave V is still in progress for further gain to 150.00. Having said that, this so-called wave V could well be the first leg of larger degree 5-waver wave C and this wave C should bring at least a retest of wave A top at 169.97 (July 2008).
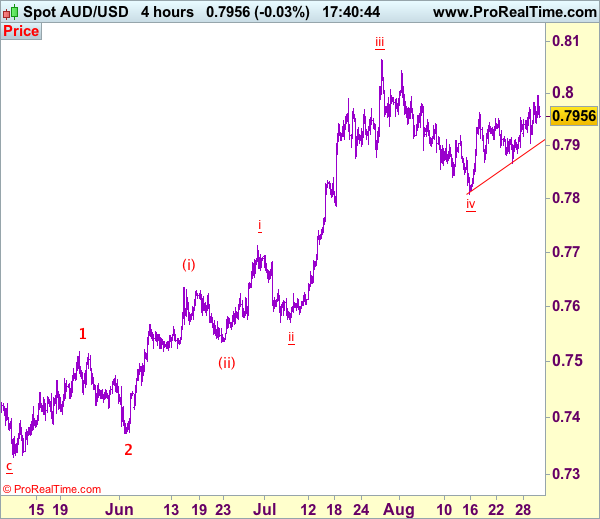
Technical Outlook: AUDUSD – Strong Hesitation At 0.8000 Barrier But Near-Term Outlook Remains Positive
The Aussie hit new recovery high at 0.7995 on Wednesday but gains stalled just ahead of psychological 0.8000 barrier.
Australian data released overnight helped but the pair is showing strong hesitation at 0.8000. Building approvals were negative in July (-1.7%) but well above forecasted fall of 5.0%, while Construction in Q2 surged by 9.3% vs forecasted rise of 1.0% and upward revised Q1 numbers (0.9% from 0.7%) made the whole picture positive.
Bullish daily studies remain supportive and firm break above 0.8000 would trigger stops and accelerate towards targets at 0.8042 (27 July high) and key 0.8065 barrier (01 Aug peak / two-year high).
Extended consolidation is expected to precede fresh push higher, with initial supports at 0.7936/30 (converging daily Kijun-sen / Tenkan-sen) and broken triangle upper boundary at 0.7917 which should contain extended dips.
Res: 0.7995, 0.8000, 0.8042, 0.8065
Sup: 0.7936, 0.7930, 0.7917, 0.7905
Trade Idea: AUD/USD – Hold long entered at 0.7895
AUD/USD – 0.7954
Recent wave: Wave 5 ended at 1.1081 and major correction has commenced for fall to 0.7000 and then towards 0.6500-10
Trend: Near term up
Original strategy :
Bought at 0.7895, Target: 0.8050, Stop: 0.7900
Position: - Long at 0.7895
Target: - 0.8050
Stop: - 0.7900
New strategy :
Hold long entered at 0.7895, Target: 0.8050, Stop: 0.7900
Position: - Long at 0.7895
Target: - 0.8050
Stop:- 0.7900
As aussie has retreated after brief rise to 0.7996, suggesting consolidation below this level would be seen, however, as long as support at 0.7905 holds, bullishness remains for another rebound, above 0.7996-00 would add credence to our view that low has possibly been formed at 0.7808 earlier this month, bring a stronger rebound to 0.8030, however, break of recent high at 0.8066 (wave iii peak) is needed to confirm upmove has resumed in wave v to 0.8100-10 first.
In view of this, we are holding on to our long position entered at 0.7895. Below said support at 0.7905 would risk test of indicated previous support at 0.7865-67, break there would dampen this bullish scenario and suggest the rebound from 0.9808 has ended, bring another test of this level, below there would signal the wave iv correction from 0.8066 is still in progress for weakness to 0.7786 support, however, oversold condition should prevent sharp fall below 0.7750 and price should stay above i top at 0.7712, bring rebound later. We are keeping our latest bullish count that recent impulsive waves is unfolding as (1 2, (i)(ii), i ii) and may extend headway towards 0.8150.
On the 4-hour chart, the move from 0.8066 is the wave 5 with i: 0.8860, ii: 0.8315, wave iii is an extended move ended at 1.0183, iv: 0.9706 and wave v has ended at 1.1081 (also the top of entire wave 5). The subsequent selloff is the major correction which is unfolding as ABC-X-ABC and 2nd A leg has ended at 0.8848, followed by a-b-c wave B which ended at 0.9758, hence, 2nd C wave is now in progress and indicated downside target at 0.7000 and 0.6950 had been met, so further fall to 0.6710-20 cannot be ruled out.
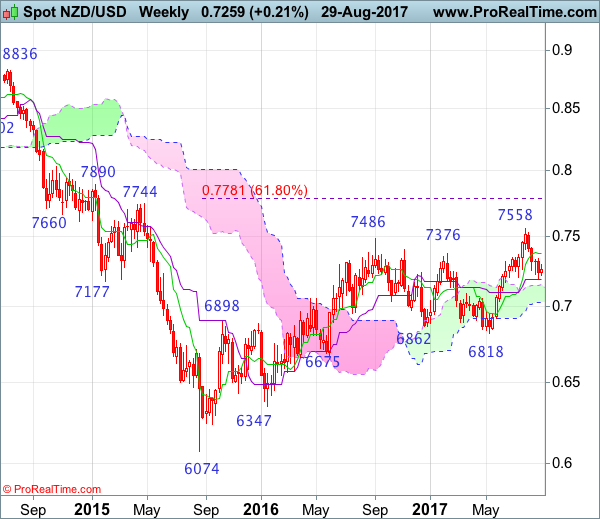
NZD/USD Candlesticks and Ichimoku Analysis
Weekly
• Last Candlesticks pattern: N/A
• Time of formation: N/A
• Trend bias: Up
Daily
• Last Candlesticks pattern: Long black candlestick
• Time of formation: 1 Aug 2017
• Trend bias: Up
NZD/USD – 0.7237
As kiwi found good support at 0.7192 last week and has recovered since, suggesting consolidation above this level would be seen and recovery to 0.7299, then 0.7335-40 cannot be ruled out, however, reckon the Kijun-Sen (now at 0.7375) should limit upside and bring another decline later. Below 0.7215-20 would bring retest of said support at 0.7192 but break there is needed to confirm the fall from 0.7558 top has resumed and extend weakness to 0.7145-50, then towards 0.7095-00 which is likely to hold from here due to near term oversold condition and bring rebound later.
On the upside, whilst initial recovery to 0.7300 cannot be ruled out, reckon upside would be limited to the Kijun-Sen (now at 0.7375) and bring another decline later. Above 0.7390-00 would suggest first leg of decline form 0.7558 has ended instead, risk a stronger rebound to 0.7440-50 but upside would still be limited and price should falter well below said resistance at 0.7558, bring another retreat later.
Recommendation: Sell at 0.7370 for 0.7170 with stop below 0.7470.
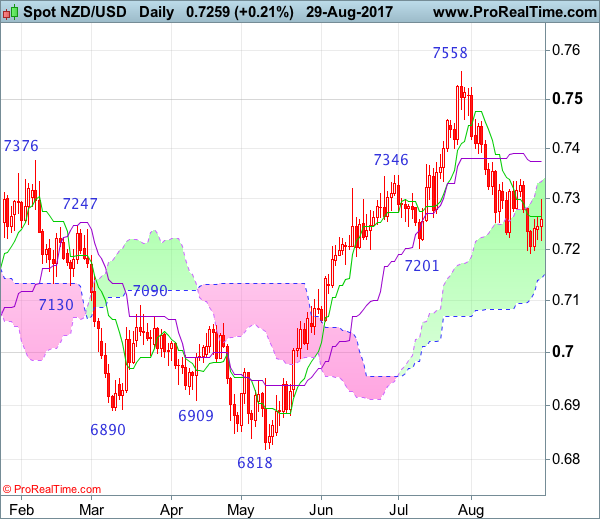
On the weekly chart, although kiwi has recovered after finding support at 0.7192, as the sharp retreat from 0.7558 suggests top has possibly been formed there, reckon upside would be limited to the Tenkan-Sen (now at 0.7375) and bring another decline, below said support at 0.7192 would extend the retreat from 0.7558 for retracement of recent rise to the upper Kumo (now at 0.7147) and then 0.7090-00 but reckon downside would be limited to the lower Kumo (now at 0.7026) and psychological support at 0.7000 would hold from here.
On the upside, expect recovery to be limited to 0.7300-10 and the Tenkan-Sen (now at 0.7375) should hold, bring another decline later. Above 0.7417 resistance would risk a stronger rebound to 0.7490-00 but still reckon said resistance at 0.7558 would limit upside and bring another retreat later. Only a break of 0.7559 would extend medium term erratic upmove from 0.6074 (2015 low) has resumed and may extend gain to 0.7690-00 (61.8% projection of 0.6074-0.7485 measuring from 0.6818) and later towards 0.7780-85 (61.8% Fibonacci retracement of 0.8836-0.6074), however, reckon upside would be limited to 0.7890 and price should falter well below resistance at 0.8035.