
Sample Category Title
DAX Higher As Markets Eye German CPI Report
The DAX index has posted slight gains in the Wednesday session, after considerable losses on Tuesday. The DAX is currently trading at 11,999.00, up 0.53% on the day. On the release front, German Preliminary CPI will be published later in the day, with the indicator expected to weaken and post a small gain of 0.1%. In the US, Preliminary GDP is expected to gain 2.7%. On Thursday, Germany releases Retail Sales and the euro zone releases CPI Flash Estimate.
Geopolitical tensions have once again grabbed the attention of global stock markets. The DAX posted considerable on Tuesday, after North Korea fired a ballistic missile over Japanese territory. Japan and the US sharply condemned the missile launch, with President Trump saying that “all options remain on the table”. With tensions once again climbing in the Korean peninsula, investors are bracing for more stock market losses, and both gold and the Japanese yen, which tend to rise in periods of crisis, have gained ground this week.
It’s up, up and away for the euro, which as soared 12.0% since April 1. On Tuesday, the currency pushed above the 1.20 level for the first time since January 2017. The euro has benefited from stronger growth in the eurozone in 2017, led by robust growth in Germany. However, the euro’s streak has weighed on the shares of automobile makers and other exporters, as a stronger euro has made exports more expensive. Investors are anticipating that the ECB will provide some guidance on plans regarding its asset purchase program (QE), which is scheduled to terminate in December. The ECB is widely expected to taper its QE program early next year, but so far has been mum about its plans. Analysts expect the ECB to address its stimulus package at the next policy meeting on September 7.
Last week’s meeting of central bankers in Jackson Hole was a low-key affair. On Friday, ECB President Mario Draghi took a page out of Janet Yellen’s page book, opting to steer away from any discussion about ECB monetary policy. Instead, Draghi spoke about the importance of free trade and financial reforms. Draghi seems to have learned a lesson from a meeting of central bankers in Portugal in June, when the markets seized on his comments that the euro zone was undergoing a broad recovery, and the euro soared. However, Draghi won’t receive another free pass next month, when the ECB holds its next policy meeting, and is expected to address its ultra-accommodative monetary policy.
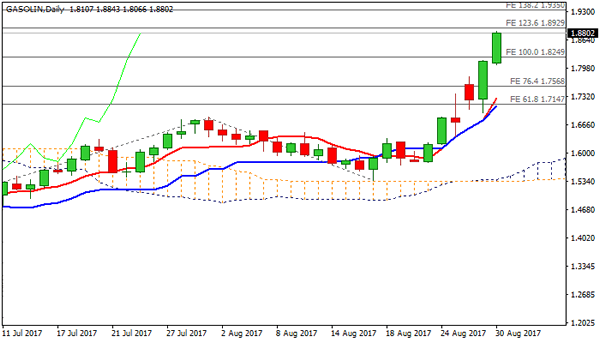
Technical Outlook: Gasoline Surges On Wednesday, Extending Previous Day’s Over 5% Rally
Gasoline contract for September delivery remains in uninterrupted steep ascend and hits new 25-month highs on probe above $1.8700 barrier. The contract extends rally on Wednesday, following gains of over 5% the previous day, boosted by fears of fuel shortage in the markets after production was disrupted by closure of several refineries, caused by hurricane Harvey which hit Texas.
Gasoline currently rides on the third wave of five-wave cycle from $1.3953 (2017 low) which extended above FE 100% and could travel to $1.8929 (FE 123.6%), with psychological $2.000 barrier coming in focus.
No signs of correction so far, despite strongly overbought daily studies, but some corrective action should be anticipated in the near future.
Res: 1.8800; 1.8929; 1.9000; 1.9350
Sup: 1.8249; 1.8171; 1.8066; 1.8000
USD Recovers Alongside Risk Appetite
The greenback recovered during the US trading session yesterday as US bond yields moved higher, with the currency erasing notable losses it posted earlier during the European morning. Besides the dollar, risk assets recovered across the board following their tumble after North Korea’s missile launch on Tuesday. US equity indices filled their negative gaps and managed to close in the green, while Asian indices are mostly higher today. Meanwhile, safe haven assets gave back most, if not all, of their missile-related gains.
In terms of fundamental catalysts, there was no obvious trigger behind this reversal. A potential explanation may be the cool-headed response from the US administration. Instead of the President responding to the escalation via twitter, as has happened on many recent occasions, the White House issued an official statement to condemn the action. This may have been interpreted by investors as a sign that the US will approach the situation in a more measured and diplomatic manner, as opposed to raining down 'fire and fury'.
Does the latest price action imply that we are out of the woods and that risk sentiment is set to continue recovering? We are not so convinced. North Korean leader Kim Jong-un warned today that more missile drills with the Pacific as the target are needed, and that yesterday’s launch was a first step in military action aimed to 'contain' the US territory of Guam. This implies that another wave of risk aversion is possible at any time. Meanwhile, Tropical Storm Harvey continues to wreak havoc in Southern US, and the deadline for raising the US debt ceiling is fast approaching (29th September), both of which pose threats to risk appetite as well.
Today’s highlights:
During the European day, Germany’s preliminary CPI rate for August is expected to have risen from the previous month. A pickup in German inflation could raise speculation that Eurozone’s inflation, due out the following day, may also accelerate. Something like that could bring the euro under renewed buying interest. However, we would like to stress that Germany only reports a headline, not a core, inflation rate. Thus, investors may focus primarily on Eurozone’s core CPI in order to gauge the timing of the ECB’s next policy action.
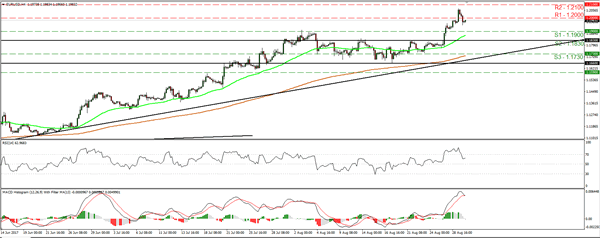
EUR/JPY traded higher yesterday, after it hit support at 129.60 (S3), fractionally above the upper bound of the falling wedge that contained the price action from the 24th of July until the 25th of August. The pair emerged above 130.40 (S2) and subsequently above the resistance (now turned into support) hurdle of 131.30 (S1), marked by the peaks of the 2nd and 3rd of April. In our view, this keeps the short-term picture positive and as such, we expect the break above 131.30 (S1) to open the way for our next obstacle of 132.20 (R1).
Zooming out to longer-term timeframes, we see that the rate continues to trade above the prior long-term downside resistance line drawn from back at the peaks of May 2015. What’s more, the price structure has been higher peaks and higher troughs since the French elections. As such, we consider the bigger picture to be positive as well.
In the US, the ADP employment report for August is due out. The forecast is for the private sector to have added 178k jobs, the same number as in July. Such a solid print could heighten speculation that the NFP print due out on Friday will also meet its forecast of 185k and thereby, help the dollar recover somewhat further. We also get the nation’s 2nd estimate of GDP for Q2, and expectations are for a slight upward revision.
EUR/USD traded higher during the early European morning Tuesday, breaking above the psychological barrier of 1.2000 (R1). Nevertheless, the rate fell short of reaching our next resistance of 1.2100 (R2) and during the afternoon, it retreated to fall back below 1.2000 (R1). Taking a look at our short-term oscillators, we see the case for the latest retreat to continue for a bit more. The RSI exited its above-70 zone and looks to be headed towards 50, while the MACD, although positive, has topped and fallen below its trigger line. The catalyst for further declines may be a strong ADP number later today.
Having said that though, we maintain the view that the medium-term outlook of EUR/USD is positive. The price structure remains higher peaks and higher troughs above the uptrend line taken from the low of the 17th of April. Therefore, we would treat any further declines that stay limited above that line as a corrective move. We expect the bulls to take the reins again soon and if they prove strong enough to overcome once more the 1.2000 (R1) barrier, then we expect them to challenge the 1.2100 (R2) this time.
We have only one speaker on the agenda: Fed Board Governor Jerome Powell. He is a permanent FOMC voting member and as such, his comments are always closely followed. His latest remarks at the Jackson Hole were on the dovish side. He appeared willing to be patient with further rate hikes until inflation is higher.
EUR/USD
Support: 1.1900 (S1), 1.1830 (S2), 1.1730 (S3)
Resistance: 1.2000 (R1), 1.2100 (R2), 1.2170 (R3)
EUR/JPY
Support: 131.30 (S1), 130.40 (S2), 129.60 (S3)
Resistance: 132.20 (R1), 133.80 (R2), 136.00 (R3)
EURUSD – Remains Vulnerable To The Downside On Price Rejection
EURUSD - With the pair backing off higher prices on Tuesday, weaken further on Wednesday, more decline is likely in the days ahead. Resistance comes in at 1.2000 level with a cut through here opening the door for more upside towards the 1.2050 level. Further up, resistance lies at the 1.2100 level where a break will expose the 1.2150 level. Its daily RSI is bullish and pointing higher suggesting further upside pressure. Conversely, support lies at the 1.1900 level where a violation will aim at the 1.1850 level. A break of here will aim at the 1.1800 level. Its daily RSI is bearish and pointing lower supporting this view. All in all, EURUSD faces further downside pressure on corrective pullback.
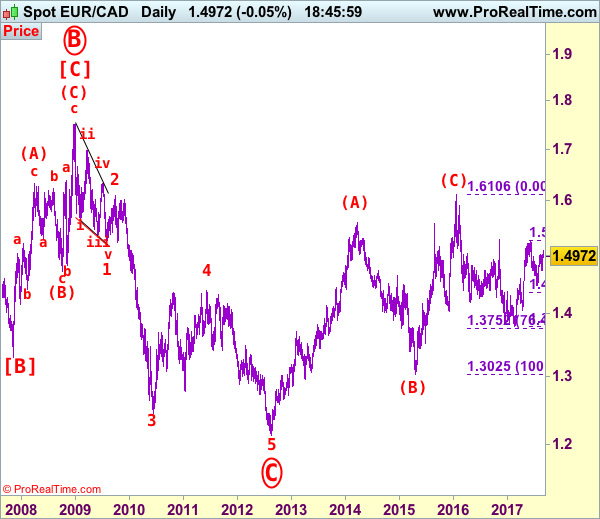
EUR/CAD Elliott Wave Analysis
EUR/CAD – 1.4975
Although the single currency broke above previous resistance at 1.5018, lack of follow through buying and current retreat from yesterday’s high of 1.5076 suggests consolidation below this level would be seen and pullback to 1.4900 is likely, however, downside should be limited to 1.4845-50 and support at 1.4726 should remain intact, bring further consolidation. Only a drop below said support at 1.4726 would shift risk to the downside and suggest the rebound from 1.4478 has ended and extend weakness to 1.4700, then 1.4640-50 but reckon 1.4590-00 would contain downside.
Our latest preferred count is that larger degree wave [C] from 1.3289 as well as circle wave B ended at 1.7509 in Dec 2008 with (A): 1.6325, (B): 1.4719 followed by wave (C) at 1.7509, hence circle wave C is unfolding with wave 1 ended at 1.5186 (diagonal wave 1), wave 2 at 1.6096, impulsive wave 3 has ended at 1.2451, followed by wave 4 at 1.4380, in view of recent strong rebound, we are now treating the wave 5 as well as larger degree circle wave C has ended at 1.2129, hence (A)-(B)-(C) correction has commenced from there with impulsive wave (C) now unfolding and indicated initial upside target at 1.6000 had been met and reckon 1.6500 would hold.
On the upside, expect recovery to be limited to 1.5040-50 and said resistance at 1.5076 should hold, bring retreat later. A firm break of 1.5076 would extend the erratic rise from 1.4478 to 1.5140-50, then towards 1.5200 but resistance at 1.5259 should remain intact. Looking ahead, only break of resistance at 1.5259 would retain bullishness and signal the erratic rise from 1.3784 has finally resumed and extend gain to 1.5282, then 1.5350 but near term overbought condition should limit upside to 1.5400-10, bring retreat later.
Recommendation: Stand aside for this week.
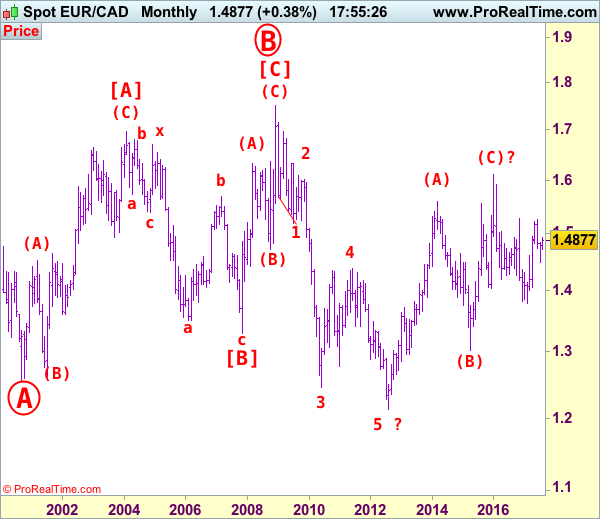
On the bigger picture, our long-term count on the monthly chart is that a big sideways consolidation from 2000 low of 1.2557 has possibly ended at 1.7509 as circle wave B with [A]: 1.6976 ( (A): 1.4513, (B): 1.2612, (C): 1.6976), wave [B]: 1.3289 is a double three with 1st a-b-c: 1.5384, x: 1.6709 and 2nd a-b-c: 1.3289. As indicated above, the wave [C] has ended at 1.7509. The selloff from there is now unfolding which itself should be labeled as an impulsive wave with wave 1: 1.5186 (diagonal wave 1), followed by wave 2: 1.6096 and wave 3: 1.2451, wave 4: 1.4380, wave 5 as well as larger degree circle wave C has possibly ended at 1.2129 and major correction has possibly commenced for retracement of recent decline towards 1.4000, then 1.4180-90 (38.2% Fibonacci retracement of 1.7509-1.2129). Below said support at 1.2129 would risk weakness to psychological support at 1.2000 and then 1.1851 (50% projection of 1.7509-1.2451 measuring from 1.4380) but reckon 1.1500 would remain intact, bring reversal later.
Market Update – European Session: German State CPI Data Edging Back Towards The ECB Target
Overnight
Concerns over North Korea's latest missile test eased for now
German State CPI data towards ECB target; but yet to confirm any early ECB taper
Overnight
Asia:
UN Security Council: Condemned North Korea's firing of a ballistic missile over Japan as an "outrageous" act and demanded that Pyongyang not launch any more missiles and abandon all nuclear weapons and programs
North Korea Leader Kim Jong Un: Test firing of missile over Japan was “meaningful prelude” to containing territory of Guam; watching response of US before deciding on further action
Moody's: G20 economies will collectively grow at an annual rate of slightly more that 3% in 2017 and 2018. Raised China 2017 GDP growth forecast from 6.6% to 6.8% and 2018 GDP growth forecast from 6.3% to 6.4%
Japan July Retail Sales M/M: 1.1% v 0.3%e; Retail Trade Y/Y: 1.9% v 1.0%e
RBNZ Gov Wheeler: Policy a key driver in economic performance; reiterates lower NZD needed to increase tradable inflation
Europe:
UK govt has been warned Brexit transition deal cannot last more than 2 years or it will risk being challenged in European Court of Justice (ECJ) or shot down in German parliament
UIK PM May: Britain looking at ways to replicate EU’s existing external trade deals after Brexit
UK Aug BRC Shop Price Index y/y: -0.3% v -0.4% prior
Americas:
S&P: United States would maintain its AA+ sovereign rating as long as the federal government avoids a default even if it does not increase the debt ceiling in a timely manner
Energy:
Weekly API Oil Inventories: Crude: -5.8M v -3.6M prior
Colonial, the biggest fuel pipeline in the U.S., system is starting to have problems in Texas
Economic data
(NL) Netherlands Aug Producer Confidence: 5.4 v 6.6 prior
(JP) Japan Aug Small Business Confidence: 49.0 v 50.0 prior
(CH) Swiss July UBS Consumption Indicator: 1.38 v 1.30 prior
(NO) Norway July Retail Sales (includes Auto/Fuel) M/M: 0.4% v 0.3%e
(DE) Germany Aug CPI Saxony M/M: 0.2% v 0.3% prior; Y/Y: 1.9% v 1.7% prior
(ES) Spain Aug Preliminary CPI M/M: 0.2% v 0.3%e; Y/Y: 1.6% v 1.7%e
(ES) Spain Aug Preliminary CPI EU Harmonized M/M: 0.2% v 0.2%e; Y/Y: 2.0% v 1.8%e
(SE) Sweden Aug Consumer Confidence: 100.3 v 103.0e; Manufacturing Confidence: 117.1 v 119.3e; Economic Tendency Survey: 110.7 v 111.8e
(CH) Swiss Aug KOF Leading Indicator: 104.1 v 107.0e
(DE) Germany Aug CPI Bavaria M/M: 0.2% v 0.4% prior; Y/Y: 1.8% v 1.6% prior
(DE) Germany Aug CPI Brandenburg M/M: 0.1% v 0.4% prior; Y/Y: 1.8% v 1.4% prior
(DE) Germany Aug CPI Hesse M/M: 0.0% v 0.4% prior; Y/Y: 1.8% v 1.9% prior
(CH) Swiss Aug Credit Suisse Expectations Survey: 25.0 v 34.7 prior
(DE) Germany Aug CPI North Rhine Westphalia M/M: 0.1% v 0.4% prior; Y/Y: 1.9% v 1.8% prior
(UK) July Mortgage Approvals: 68.7K v 65.5Ke
(UK) July Net Consumer Credit: £1.2B v £1.5Be; Net Lending: £3.6B v £3.8Be
(PT) Portugal Aug Consumer Confidence: 2.3 v 2.5 prior; Economic Climate Indicator: 2.1 v 2.2 prior
(EU) Euro Zone Aug Business Climate Indicator: 1.09 v 1.05e; Consumer Confidence (Final reading): -1.5 v -1.5e
Fixed Income Issuance:
(FI) Finland opened its books to sell 10-year note via syndicate; guidance seen -21bps to mid-swaps
(IN) India sold total INR160B vs. INR160B indicated indicated in 3-month and 12-month Bills
(DK) Denmark sold total DKK 7.82B in 3-month and 6-month bills
(EU) ECB allotted $35M in 7-day USD Liquidity Tender at fixed 1.66% vs $35M prior
(SE) Sweden sold total SEK10B vs. 10B indicated in 3-month and 6-month bills
(NO) Norway sold NOK3.0B vs. NOK3.0B indicated in 2027 Bonds; Avg Yield: 1.54% v 1.65% prior; Bid-to-cover: 2.24x v 2.22x prior
(IT) Italy Debt Agency (Tesoro) sold total €5.5B vs. €4.5-5.5B indicated range in 5-year and 10-year BTP Bonds
Sold €3.0B vs €2.5-3.0B indicated in new 0.90% Aug 2022 BTP; Avg Yield: 0.84% v 0.88% prior; Bid-to-cover: 1.57x v 1.34x prior
Sold €2.5B vs €2.0-2.5B indicated in 2.2% Aug 2027 BTP; Avg Yield: 2.09% v 2.16% prior; Bid-to-cover: 1.60x v 1.71x prior
(IT) Italy Debt Agency (Tesoro) sold €1.75B vs. €1.25-1.7B indicated range in Oct 2024 CCTeu (Floating Rate Note); Avg Yield: 0.81% v 0.77% prior; Bid-to-cover: 1.48x v 1.65x prior
SPEAKERS/FIXED INCOME/FX/COMMODITIES/ERRATUM
Equities
Indices [Stoxx600 +0.5% at 370.2, FTSE +0.3% at 7361, DAX +0.5% at 12006, CAC-40 +0.4% at 5049, IBEX-35 +0.3% at 10226, FTSE MIB flat at 10228, SMI +0.3% at 8836, S&P 500 Futures +0.1%]
Market Focal Points/Key Themes:
European Indices trade higher across the board tracking the rebound seen in the US yesterday and continued follow through in Futures this morning. On the Earnings front Biomerieux traded at all time highs following results, while Bertrandt, Baloise and James Fisher trade higher after reporting results. Home ware specialist Dunelm trades lower after its Chief Exec stepped down for personal reasons while HSS Hire trades over 10% lower after reporting a loss.
Looking ahead to the US morning, notable earners include Dycom, Chico FAS and Analog Devices.
Equities
Consumer discretionary [Bertrandt [BDT.DE] +5.2% (Earnings), Dunelm [DNLM.UK] -3.6% (CEO steps down), RTL [RTL.BE] +2.2% (Earnings)]
Industrials: [James Fisher [FSJ.UK] +3.8% (Earnings)]
Financials: [Baloise [BALN.CH] +2.6% (Earnings), HSS Hire [HSS.UK] -13% (Earnings), ASR Nederland [ASRNL.NL] +2.4% (Earnings)]
Healthcare: [Biomerieux [BIM.FR] +7.3% (Earnings),
Energy: [Petrofac [PFC.UK] +2.4% (Earnings)]
Speakers
UK PM May reiterated view that no Brexit deal is still better than a bad deal
German Bundesbank Survey: Low interest rates were weighing on small business. No sign of real-estate bubble
Moody's: Euro Area to grow above potential over the next two years; raised its GDP growth forecasts for Germany, France and Italy. Now forecasted Euro Area 2017 GDP growth of 2.1% and at 1.9% in 201; Germany 2018 GDP growth at 2.2% and at 2.0% in 2018
Canadian rating agency DBRS: Very unlikely Spain sovereign rating would be immediately damaged by Catalonia region voting for independence in October's referendum
Libya National Oil Company exec: 360K bpd of crude production shutdown by pipeline blockades that have closed 3 fields
Currencies
As concerns over the Korean Peninsula eased the USD managed to recover some of its lost luster. The USD Index tested 91.62 on Monday but advanced to approach 92.30 in today’s session to move off its 2 ½ year lows.
The EUR/USD was back below the 1.1950 level (over 100 pips lower from its recent 2 1/2 year highs. German State CPI data edged towards ECB target; but yet to confirm any early ECB taper
USD/JPY back above the 110 level after testing 4 1.2 month lows of 108.26 in the aftermath of the North Korean missile launch towards Japan.
Fixed Income
Bund futures trades at 165.20 down 6 ticks as Tuesday’ s risk-off moves, spurred by North Korea missile launch, begin to unwind. Downside targets 164.50 followed by 163.75. To the upside the 165.75 to 166.00 remains key resistance.
Gilt futures trades at 128.44 down 18 ticks as North Korean tensions ease. A resumption to the upside could eye 129.25 then 130.10. A move back below 128.25 targets 126.51
Wednesday’s liquidity report showed Tuesday’s excess liquidity rose to €1.716T from €1.700T and use of the marginal lending facility rose to €640M from €634M.
Corporateissuance saw $225M come to market via CBL & Associates offering
Looking Ahead
(GR) Greece Debt Agency (PDMA) to sell €875M in 26-Week Bills
(FI) Finland Government drafts 2018 Budget
05.30 (UK) Weekly John Lewis LFL sales data
05:30 (EU) ECB allotment in 3-month LTRO
06:00 (PT) Portugal July Industrial Production M/M: No est v 0.5% prior; Y/Y: No est v 0.6% prior
06:00 (EU) Juncker and German Chancellor Merkel to discuss the State of EU
06:45 (US) Daily Libor Fixing
07:00 (RU) Russia to sell combined RUB35.6 in 2022 and 2026 OFZ Bonds
07:00 (US) MBA Mortgage Applications w/e Aug 25th: No est v -0.5% prior
07:00 (BR) Brazil Aug FGV Inflation IGPM M/M: +0.1%e v -0.7% prior; Y/Y: -1.7%e v -1.7% prior
08:00 (DE) Germany Aug Preliminary CPI M/M: 0.1%e v 0.4% prior; Y/Y: 1.8%e v 1.7% prior
08:00 (DE) Germany Aug Preliminary CPI EU Harmonized M/M: 0.1%e v 0.4% prior; Y/Y: 1.7%e v 1.5% prior
08:00 (CL) Chile July Total Copper Production: No est v 453.2K prior
08:00 (CL) Chile July Manufacturing Production Y/Y: 2.0%e v 0.9% prior; Industrial Production Y/Y: +0.3%e v -2.1% prior
08:00 (ZA) South Africa July Budget Balance (ZAR): -66.1Be v +15.4B prior
08:05 (UK) Baltic Dry Bulk Index
08:15 (US) Aug ADP Employment Change: +185Ke v +178K prior
08:30 (US) Q2 Preliminary GDP Annualized (2nd reading) Q/Q: 2.7%e v 2.6% advance; Personal Consumption: 3.0%e v 2.8% advance
08:30 (US) Q2 Preliminary GDP Price Index: 1.0%e v 1.0% advance; Core PCE Q/Q: 0.9%e v 0.9% advance
08:30 (CA) Canada Q2 Current Account: -$17.6Be v –$14.1B prior
09:15 (US) Fed’s Powell (moderate, voter) at conference
09:30 (BR) Brazil July Primary Budget Balance (BRL): -17.1Be v -19.6B prior; Nominal Budget Balance: -44.2Be v -51.1B prior
10:30 (US) Weekly DOE Crude Oil Inventories
12:00 (CA) Canada to sell 2-Year Bonds
13:30 (MX) Mexico Central Bank (Banxico) Quarterly Inflation Report (QIR)
15:00 (US) July Agriculture Prices Received: No est 4.6% prior
15:30 (MX) Mexico July YTD Budget Balance (MXN): No est v 141.9B prior
Dollar Recovers, Pushing Euro And Pound Lower
Global equities are higher overnight as tensions surrounding North Korea have eased a tad. The yen (¥109.93) and Swiss franc ($0.9570) have dropped with gold as demand for haven assets began to fade.
President Trump's ‘measured' response to North Korea's missile launch and comments from Kim Jong Un suggested the situation may not escalate has most sovereign bond prices falling as the risk-off mood diminished.
Data today stateside, Q2 GDP and core-price data along with the ADP's monthly report on U.S hiring trends will set the tone for Friday's ‘granddaddy' of economic events, non-farm payrolls (NFP).
1. Stocks get the green light
In Japan, stocks regained ground lost after North Korea missile caused a four-month low. The Nikkei rallied +0.7% helped by exporters and a weaker yen, while the broader Topix index rose +0.6%.
In South Korea, the Kospi index added +0.3%, while down-under, Australia's S&P/ASX 200 Index was flat.
In Hong Kong, the Hang Seng index rallied +1.2%, while the China Enterprises Index gained +0.7%.
Note: In Hong Kong, the market has jumped roughly +28% in 2017, buoyed by China's economic recovery and cross-border investment from Chinese investors.
In China, stocks traded relatively flat as stronger airlines and resources were offset by losses in the financial sector. Both the blue chip CSI300 index and the Shanghai Composite Index were unchanged.
In Europe, most bourses are trading higher across the board tracking the rebound seen in Asia overnight and the U.S yesterday.
U.S stocks are set to open in the black (+0.1%).
Indices: Stoxx600 +0.5% at 370.2, FTSE +0.3% at 7361, DAX +0.5% at 12006, CAC-40 +0.4% at 5049, IBEX-35 +0.3% at 10226, FTSE MIB flat at 10228, SMI +0.3% at 8836, S&P 500 Futures +0.1%.
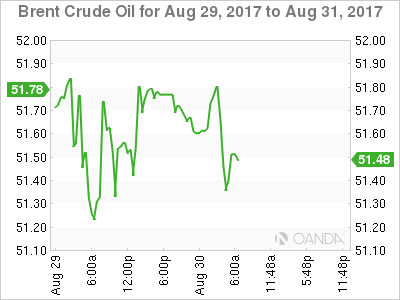
2. Crude slips as Harvey shuts a fifth of U.S fuel output, gold lower
Crude oil slid and gas jumped to its highest price in two-years as flooding and storm damage from Hurricane Harvey shut nearly a fifth of U.S refineries.
Note: Restarting plants even under the best conditions are expected to take a week or more.
Brent crude is down -30c at +$51.70 a barrel, while U.S light crude (WTI) fell -25c to +$46.19.
U.S gas was up more than +3% at +$1.8392 a gallon, while diesel advanced by +1.7% to +$1.6944 a gallon.
Note: In addition to shutting oil refineries due Harvey's impact, about +1.4m bpd of U.S crude production has been disrupted, equivalent to +15% of total U.S output.
The impact of the storm overshadowed last week's API report which showed Tuesday that U.S crude inventories fell by -5.78m barrels last week – does not reflect the impact from Harvey.
The market will take its cue from today EIA report (10:30 am EDT) to compare with Tuesday's API figures.
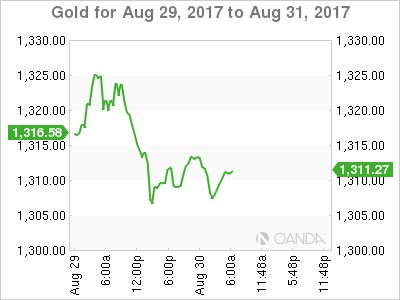
Gold prices have slipped overnight (down -0.1% at +$1,307.60), pressured by gains in the ‘big' dollar amid perception of a brief lull in tensions over North Korea. However, prices of the ‘yellow metal' remained supported on pullbacks as safe-haven demand remains supported that geopolitical risks could persist. It hit a nine-month peak yesterday at +$1,325.94.
3. Yields back up as N. Korea fears abate
The gradual risk off sentiment has sovereign bond yields backing up a tad in overnight trade. U.S 10-year Treasury yields are at +2.14% ahead of the U.S open, after touching a nine-month intraday low of +2.08% yesterday.
In Europe, eurozone government bond yields have edged up as forecast-beating inflation in Spain (+2% y/y) and Germany (see below) defies the EUR's recent strength. Gains of nearly +14% for the EUR outright should have held down prices in the bloc as imports become cheaper. Germany's 10-year yield increased +2 bps to +0.36%.
Elsewhere, Britain's 10-year yield gained +2 bps to +1.025%, the largest advance in more than a week.
4.The “Big” dollar finds some traction
The ‘mighty' dollar has managed to recover some of yesterday's sharp losses following a North Korea missile launch, helped by Tuesday's strong U.S consumer confidence data.
However, there remains little to dissuade investors from positioning in stronger activity/yield stories elsewhere in the world.
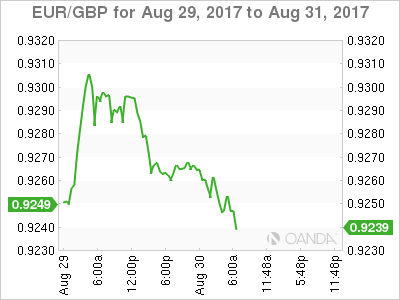
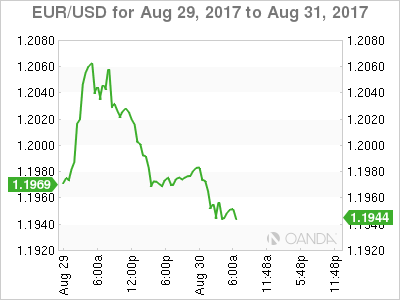
EUR/USD is down -0.2% at €1.1950, having traded well above €1.20 intraday yesterday. The pound has slipped further from the psychological £1.30 level, last down -0.1% at £1.2919, with the pound still seen vulnerable to a lack of progress in Brexit talks.
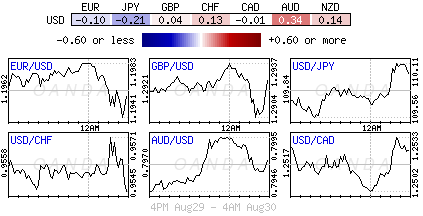
The yen and Swiss franc, which rallied hard yesterday on safe haven demand, have turned lower, with USD/JPY up +0.35% at ¥109.90 and USD/CHF up +0.06% at $0.9561. Down-under, the AUD has gained some ground, with AUD/USD trading just below A$0.80 at A$0.7970.
5. German State CPI data edging back towards the ECB target
Inflation data this morning from five German states suggest that Germany's consumer price index harmonized according to EU standards – HICP rallied to about +1.7% this month, y/y.
However, with core-inflation, it's still fairly soft which would suggest that the ECB might not be in any rush to begin tapering its QE program any time soon.
Digging deeper, energy inflation appears to have risen in line with expectations and the volatile food component seems to have seen an increase.
Expect the fixed income market to start pricing the ECB to begin to taper its asset purchases only slowly next year and put off raising interest rates until 2019.
US Data And Powell Comments Eyed
- Safe haven unwinding seen as traders eye data releases;
- Would dovish Powell signal an end to rate hikes this year?
- Oil slips ahead of inventory data.
With geopolitical risk once again appearing to subside, attention will turn back to the fundamentals on Wednesday as we enter the business end of the week with regards to economic releases.
The start of the week was shaping up to be much quieter with the bulk of the data coming between Wednesday and Friday but a missile launch by North Korea and the devastating impact of Hurricane Harvey ensured that was not the case. Risk aversion at the start of the week is not starting to be unwound, with Gold have come off its highs, the yen paring gains and equity indices and US futures in the green.
I think we're still some way from investors feeling comfortable with the situation but this is certainly a case of no news being good news. As long as we see no further escalation from either North Korea or the US, focus will likely shift to the economic data, with US GDP, ADP non-farm employment and crude inventories all being released. Growth for the second quarter is expected to be revised a little higher to 2.7% from 2.6% on an annualised basis, while ADP is expected to report 185,000 jobs were created in August.
The ADP is seen as an early estimate of Friday's NFP number but it hasn't historically been very accurate. It has however been useful in highlighting when expectations are perhaps far too high or too low. Should we see a big beat or a big miss, we may see people adjusting their expectations ahead of Friday's jobs report.
We'll also hear from Jerome Powell – a permanent voter on the FOMC – who we haven't heard from recently. Powell is typically lies between the doves and the hawks on the committee and was previously in favour of continuing gradual rate hikes this year and anticipated three in total. Any suggestion that he has since become less in favour of another increase may indicate that the tide has turned towards the doves within the committee, lessening the chances of another hike this year.
Oil is trading slightly lower again as we await the inventory numbers from EIA. The impact of Hurricane Harvey could lead to a near-term rise in crude inventories, which is weighing on WTI crude in particular. We're still expecting a drop this week, with API reporting a drawdown of 5.78 million barrels but it will be interesting to see what happens in the coming weeks. The widening gap between WTI and Brent will also be interesting to watch in the weeks ahead.
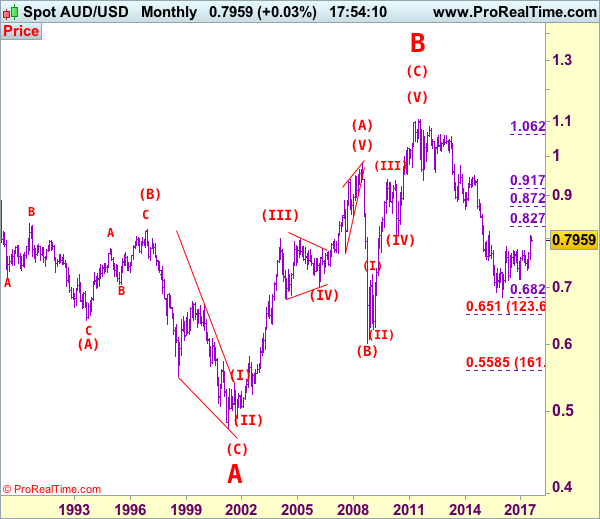
AUD/USD Elliott Wave Analysis
AUD/USD – 0.7955
Aussie’s breach of indicated resistance at 0.7963 signals low has been formed at 0.7808 earlier and consolidation with upside bias remains for further gain to 0.8000, however, break there is needed to signal the pullback from 0.8066 has indeed ended, bring retest of this level first. Looking ahead, a break above this level is needed to confirm medium term erratic rise from 0.6827 (2016 low) has resumed and extend gain to 0.8100, then towards previous resistance at 0.8163.
We are keeping our count that top has been formed at 1.1081 (wave 5 of V) and major correction (A-B-C-X-A-B-C) has commenced, indicated downside targets at 0.7945 (61.8% Fibonacci retracement of entire rise from 0.6007-1.1081) and 0.7750 had been met and downside bias is seen for further weakness to 0.6800, then 0.6700 but reckon 0.6500 would hold from here.
Our preferred count is that the rally from 0.6007 to 0.7270 (7 Jan 2009) is marked as wave A, the retreat to 0.6248 (2 Feb 2009) is wave B and the subsequent upmove is labeled as wave C with wave (iii) and wave (iv) ended at 0.8265 and 0.7700 respectively and wave (v) as well as 3 ended at 0.9407, then wave 4 ended at 0.8066 (instead of 0.8578). The wave 5 has met our indicated projection target of 1.1060 and could ended at 1.1081, this level is now treated as the peak of wave (C) as well as larger degree wave B, hence major fall in wave C has commenced, our initial downside target at psychological support at 0.7000 has just been met and further weakness to 0.6500 would be seen later.
On the downside, whilst pullback to 0.7920 cannot be ruled out, reckon 0.7905 would limit downside and bring another rebound later. Only a break below support at 0.7867 (last week’s low) would suggest the rebound from 0.7808 has ended, bring weakness towards this level. A break below there would shift risk back to downside for the corrective decline from 0.8066 top to bring retracement of early upmove to 0.7760 (61.8% Fibonacci retracement of 0.7571-0.8066) and then test of previous resistance at 0.7712 but reckon downside would be limited to 0.7640-50.
Recommendation: Buy at 0.7920 for 0.8120 with stop below 0.7820.

Our alternate count on the daily chart treated the top formed in 2008 at 0.9851 could be a larger degree wave I and was followed by a deep and sharp correction in wave II to 0.6007 and wave III is unfolding from there.
The long-term uptrend started from 0.4775 (2 Apr 2001) with an impulsive structure. Wave I is labeled as 0.4775 to 0.9851 (15 Jul 2008), wave II has ended at 0.6007 (Oct 2008) and wave III is still in progress which may extend further gain to 1.1265.
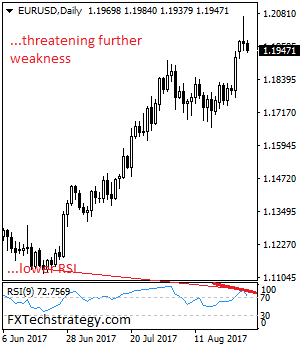
Euro Edges Lower Ahead Of German Preliminary CPI
EUR/USD has posted slight losses in the Wednesday session. Currently the pair is trading at 1.1945, down 0.22% on the day. On the release front, German Preliminary CPI will be published later in the day, with the indicator expected to weaken and post a small gain of 0.1%. In the US, there are two key events – ADP Nonfarm Payrolls is expected to rise to 185 thousand, and Preliminary GDP is expected to gain 2.7%. On Thursday, Germany releases Retail Sales and the euro zone releases CPI Flash Estimate. In the US, there are a host of key events, led by unemployment claims.
It's up, up and away for the streaking euro, which as soared 12.0% since April 1. On Tuesday, the currency pushed above the 1.20 level for the first time since January 2017. The euro has benefited from stronger growth in the eurozone in 2017, led by robust growth in Germany. As well, investors are anticipating that the ECB will provide some guidance on plans regarding its asset purchase program (QE), which is scheduled to terminate in December. The ECB is widely expected to taper its QE program early next year, but so far has been mum about its plans. Analysts expect the ECB to address its stimulus package at the next policy meeting on September 7.
Anyone hoping for some fireworks at last week's meeting of central bankers in Jackson Hole came away disappointed. On Friday, ECB President Mario Draghi took a page out of Janet Yellen's page book, opting to steer away from any discussion about ECB monetary policy. Instead, Draghi spoke about the importance of free trade and financial reforms. Draghi seems to have learned a lesson from a meeting of central bankers in Portugal in June, when the markets seized on his comments that the euro zone was undergoing a broad recovery, and the euro soared. However, Draghi won't receive another free pass next month, when the ECB holds its next policy meeting, and is expected to address its ultra-accommodative monetary policy.
The US economy continues to perform well, and the economy receives a report card on Thursday, with the release of Preliminary GDP for the second quarter. US growth in Q1 was weak, with Final GDP coming in at 1.4%. However, Q2 is looking much better, with Preliminary GDP expected to gain 2.7%. The US consumer remains very optimistic about the economy, buoyed by a red-hot labor market. In August, CB Consumer Confidence accelerated to 122.9 in August, above the estimate of 120.9 points. Still, the optimism has not translated into strong consumer spending, and the lack of spending has contributed to weak inflation levels.