Sample Category Title
Weak CHF Fails to Lift Sentiment, SNB to Keep Policy Easier for Longer
Recent weakness in Swiss franc against the euro has not yet boosted Switzerland's economic outlook in a meaningful way, evidenced by the disappointing KOF indicator and Credit Suisse (formerly conducted by ZEW) investor sentiment index for August. While, at the meeting on September 14, the SNB would certainly affirm the stance that the franc remains "overvalued" and the pledge the combat deflation, we are concerned that there would still be a long way to go for the country's economy to get back in shape, as the pass-through of exchange rate into inflation is subdued. Meanwhile, a recent study by the SNB suggests that its monetary policy would have to stay relatively more accommodative (than ECB's) for longer to push inflation higher. We believe this reinstates the central bank's commitment to leave the policy unchanged.
Economic and Investor Sentiment Fell
The KOF indicator surprisingly fell to 104.1 in August from an upwardly revised 108 a month ago. This came in weaker than 107. As the accompanying statement noted, the reading points to "a continuation of growth with rates above average, but no further acceleration should be expected". The disappointment was mainly driven by "more pessimistic assessment of the domestic firms' competitiveness", despite the recent depreciation of the Swiss franc. On a separate note, the Credit Suisse investor sentiment index fell -9.7 points to 25 in August. July retail sales and August manufacturing PMI data would be due Friday, while the 2Q17 GDP growth and the August inflation reports would be released on September 5. However, we believe the dataflow would unlikely deviate from the big picture of lackluster growth.
SNB to Keep Swiss Franc Weak
EURCHF will probably record modest pullback in August, after soaring +4.54% in July. While in consolidation over the past weeks, EURCHF has remained firm after rallying to 1.1537, the highest since SNB scrapped the 1.2 EURCHF floor in January 2015, on August 4. However, recent rise in safe-haven demand and broad-based weakness in US dollar have sent USDCHF to the lowest in 2 years, erasing all franc's depreciation against the greenback from mid-July to early-August. We believe the SNB is more tolerable over franc's strength against USD. Indeed, the mild increase in sight deposit over the past weeks has also signaled limited SNB intervention.
Certainly, SNB would prefer to see the franc to weaken further against the euro. Therefore, it would unlikely alter the monetary stance at the policy meeting on September 14, a week after the ECB meeting.
Accommodative Monetary Policy would Stay for Long Period of Time
SNB's major concern of Swiss economy is weak inflation. However, the central bank's working papers have revealed that the pass-through of exchange rate into Swiss inflation (i.e. weak currency of a country would eventually boost inflation) is very subdued (https://www.snb.ch/n/mmr/reference/economic_studies_2007_04/source/economic_studies_2007_04.n.pdf). In a recent working paper (https://www.snb.ch/n/mmr/reference/working_paper_2017_07/source/working_paper_2017_07.n.pdf), the SNB even suggests that, if ECB adjusts its monetary policy in response to a positive shock that drives up Eurozone inflation, SNB should maintain a relatively "less restrictive" monetary policy than the ECB. The paper noted that "as a result of the change in the relative monetary policy stance, the Swiss franc depreciates and inflation picks up even somewhat more than in the Eurozone". It suggests that the pass-through would be higher if SNB maintains a more accommodative monetary policy than the ECB for longer. We believe these findings reinstate the central bank's commitment to leave the policy unchanged for some time.
Investors Brush Away North Korea Concerns
"Sell volatility, buy the dip" has been the investor mindset for some time, when it comes to the equity markets. It appears that this mindset is holding firm, after investors brushed away the market uncertainty that was created in the early hours of Tuesday morning, following the news that North Korea fired a missile over Japan.
That said, I can't remember seeing such a rapid reversal of market fortunes as we saw yesterday, at least since Donald Trump shocked the world by winning the US elections in November 2016. Could yesterday's reversal have occurred because North Korean risks have been priced into the markets? I am unsure, because any news around North Korea is unpredictable at best; the announcement from North Korea that the firing of a missile over Japan was the first step of military operations in the Pacific, is something that investors simply cannot afford to ignore.
Perhaps the contributing factor for the market recovery, was because the response from President Trump was more measured than his previous "fire and fury" rhetoric that spooked investors earlier in August.
Is the Euro now a safe haven?
Much has been made about the Euro possibly emerging as a safe haven currency following the rapid appreciation to its highest levels since January 2015, but we shouldn't get carried away before we label the Euro as a new safe haven currency.
We have seen this trend in the past; when there is Dollar weakness, the correlation it encourages in terms of Euro strength is one of the easiest for traders to spot. The Euro did manage to peak at levels not seen since early 2015, at the same time that the Dollar dropped to its lowest levels since January 2015.
At the moment, investors are using any reason possible to buy the Euro, and they are also pricing in as much hawkish news from the European Central Bank (ECB), as can be expected before the next interest rate decision in September. The ECB will not be comfortable with the rapid appreciation in the Euro, but traders also know that the ECB will not be in a hurry to make changes to monetary policy. They want to price in as much in the Euro as they can, before taking profits on a pair that has rallied close to 14% year-to-date.
The likely eventual target for the EURUSD is probably between 1.22 - 1.25, which was roughly where the Eurodollar was trading, before traders priced in the fact that the ECB were set to announce its QE stimulus in January 2015. With expectations increasing that the ECB are going to announce an unwinding of QE as soon as September, we can consider the rally in the Euro over recent months, as "going full circle".
Dollar Index looking oversold
Traders need to remain mindful before jumping into any more selling positions, because the Dollar short is really starting to look like a crowded trade.
There is no doubt that the Dollar is horribly oversold, but the ongoing uncertainty when it comes to the ability of President Trump to implement his promised legislative reforms, and a reversal of ambition from the Federal Reserve to raise US interest rates are making traders very hesitant to purchase the Dollar from what looks like heavily oversold levels.
Additional anxiety over the debt ceiling, Nafta, geopolitics, and the likelihood that Federal Reserve Chair Janet Yellen could be replaced at the end of her term by someone more encouraged to support financial deregulation, are all seen as possible catalysts that could send the Dollar flying right through psychological support levels.
Investors need to pay very careful attention to where the Dollar concludes this month; if the Dollar Index does manage to conclude trading below 92, it increases the bias towards more sellers flooding the market. This could take the USD to levels not seen since investors began to price in that the Federal Reserve would raise US interest rates two years ago.
Still some time left to purchase the Yuan
After signaling a clear "buy" signal to the markets earlier in August, when the USD/CNH unexpectedly slipped through the psychological 6.70 level, the Chinese currency has exploded into buying pressure. Despite the advance this month, I think there is further room for appreciation.
If you compare the Chinese Yuan to a basket of different currencies, in terms of its performance year-to-date against the Dollar, you will see that the Yuan has only advanced around 5% against the Dollar in 2017. The Euro, Australian Dollar and Japanese Yen have all advanced more strongly against the Dollar; my view is that the Yuan needs to mirror the strength that has been noticed across these developed currencies. This one factor is behind why I am still bullish on the Yuan, while the market remains heavily negative on the Dollar.
6.55 is the likely eventual target for the USDCNH.
Dollar Rebounds; Euro Ignores Higher EMU Inflation
- European equities are up slightly more than 0.5%, which was mainly the gain at the opening (catching up with WS). During the session, there was no consistent directional bias. US equities open nearly flat.
- Eurozone economic confidence hit a pre-crisis high. The EC's economic sentiment indicator rose to 111.9 in August, compared to consensus forecasts and July reading of 111.3. The improvement was broad-based across sectors (manufacturing, services, retail and consumer). It points to ongoing strong or even stronger growth in Q3.
- The August US ADP employment report was very strong. ADP reported a net increase of 237 000 jobs in the private sector, more than the 185 000 expected. On top of it, the July job creation was revised higher to 201 000 from 178 000 reported previously. The gains were broad-based. It raises the expectations for Friday's payrolls report.
- Brits are still buying houses (surprise, surprise), but UK consumer credit appears to be coming off the boil, judging from the latest data of the BoE. Meanwhile, some companies at least appear to be borrowing while the going's good. Borrowing by manufacturing firms rose surprisingly strong.
- Moody's raised the growth forecasts of the euro area and sees now above potential growth in 2017 and 2018. It raised the forecasts for the German GDP to 2.2% this year and 2% next year. For France, it now sees 1.6% growth in both years (up from 1.3% and 1.4%), while even laggard Italy should grow by 1.3% in 2017/18 (up from 0.8%/1.1%).
- Analysts are still increasing the estimated cost of the passage of tropical storm Harvey, which is now making a second landfall, in Louisiana. History tells us that these costs impact short time some economic data, but not the underlying trend as repair work pushes growth higher beyond the short term.
- Spanish inflation rose to 2% Y/Y in August, up from 1.7% Y/Y in July and exceeding expectations for a 1.8% Y/Y increase. Belgian inflation crept higher to 1.9% Y/Y from 1.78% Y/Y previously.
- German HICP inflation rose to 1.8% Y/Y in August, up from 1.5% Y/Y in July and exceeding expectations for a 1.7% Y/Y increase. Coming on the heels of stronger Spanish HICP and Belgian HICP inflation, the risks for tomorrow's euro area inflation on the upside of the expected 1.4% Y/Y reading (up from 1.3% Y/Y in July). The higher inflation readings might be due to base effects and energy prices, more than increases in underlying inflation.
- US Q2 GDP was revised higher to an annualized 3% from 2.6% previously. The revision was largely due to the upward revision of consumption and business investment. That's a qualitative good revision and it likely leads to a bigger overhang for Q3, which may also come in around 3%.
Rates
Core bonds limit losses amid strong US/EMU eco data
Yesterday's potential technical trend reversal signal didn't find an audience today despite a batch of stronger-than-forecast eco data. The jury is still out with EMU CPI and US payrolls still coming this week. The damage in the German Bund and US Note future remained limited today. The US yield curve bear steepens with yields 0.7 bps (30-yr) to 2.2 bps (2-yr) higher. Changes on the German yield curve vary between +0.5 bps (2-yr) and +2.4 bps (10-yr). On intra-EMU bond markets, 10-yr yield spreads narrow up to 3 bps (Portugal).
The German Bund opened lower copying the US T-Note's losses in Asian dealings. The down-move was rapidly blocked though and followed by some technically insignificant return action higher. EC EMU confidence indicators, Spanish inflation and (regional) German inflation all beat consensus, but couldn't inflict losses on the Bund. The tepid comeback of (European) stock markets and weakness in oil prices (Hurricane Harvey after all?) offer a partial explanation. As US investors joined dealings, core bonds tested the intraday downside once more, but the move was lackluster in nature despite another stellar ADP-report which bodes well for Friday's US payrolls. The upward revision of US Q2 GDP to 3% Q/Qa also fell in deaf man's ears.
The Italian debt agency tapped the on the run 5-yr (€3B 0.9% Aug2022) and 10-yr BTP (€2.5B 2.05% Aug2027). The combined amount sold was the maximum of the targeted €4-5.5B. The auction bid cover was 1.58 which is rather good for Italian standards. Additionally, the Tesoro raised €1.75B via a floating rate note. The Finnish Treasury launched a new 10-yr benchmark via syndication (€3B Sep2027). The bond was priced to yield MS -24 bps, down from initial price takings around MS – 21 bps.
Currencies
Dollar rebounds; Euro ignores higher EMU inflation
The dollar extended the rebound which started yesterday in the US. Technical considerations prevailed, but good US eco data (strong ADP and upward revision of the US GDP) and positive risk sentiment reinforced the rebound. EMU inflation data were also higher than expected, but contrary to what was the case of late, they couldn't inspire euro bulls.
Overnight, Asian equity markets showed gains of about 0.5%/1.0% as uncertainty on North Korea subsided. USD/JPY held in the upper half of the 109 big figure as a better global sentiment supported the dollar across the board. EUR/USD stabilized in the 1.1975 area.
European markets also entered calmer waters after the constructive price action in the US yesterday evening, but the rebound of European equities was modest, given yesterday's losses. Still, the improved risk sentiment supported a further rebound of the dollar. EUR/USD dropped to the mid 1.1250 area. USD/JPY jumped temporary north of 110. The EMU eco data (EC confidence data, German inflation) were strong/better than expected, but the impact on EMU interest rates and on the euro was limited. Interest rate differentials were again no significant factor for FX (EUR/USD) trading. Global market sentiment and technical considerations (USD short squeeze) prevailed.
The dollar remained well bid as US traders joined the action and gained slightly further ground. A very strong ADP labour market report (237 000 net job growth) and a slight upward revision of the US Q2 GDP reinforced the dollar bid. Core yields returned to the intraday highs. USD/JPY trades in the 110.25 area. EUR/USD drifted to the low 1.19 area and trades currently at around 1.1925/30.
Conclusion: the dollar extended yesterday's rebound. A better risk sentiment supported the move, but technical considerations rather than fundamentals (data, expectations on the Trump administration) or interest rate differentials prevailed as driver for the rebound. EUR/JPY holds within reach of the recent highs which also indicates that the current move is a USD rebound rather than a euro correction. Key eco data later this week now have to decide whether there is room for a more fundamentally driven USD comeback.
EUR/GBP: profit taking, at last…
Global market positioning also dominated sterling trading today. The UK specific news flow remained sterling negative. The stalemate in the Brexit negotiations persists and the UK July money supply and lending data were softer than expected. Even so, EUR/GBP joined the correction of EUR/USD. EUR/GBP trades currently in the 0.9230 area. Remarkably, cable held up relatively well despite the overall USD rebound. This suggests some underlying GBP strength. We assume that technical considerations were also the main driver of this move. (profit taking on the recent, protracted EUR/GBP rally). At the same time, a further GBP-decline would at some point bring higher inflation again on the radar of the BoE. Let's call it some kind of self-destroying aspect of the recent GBP decline against the euro.
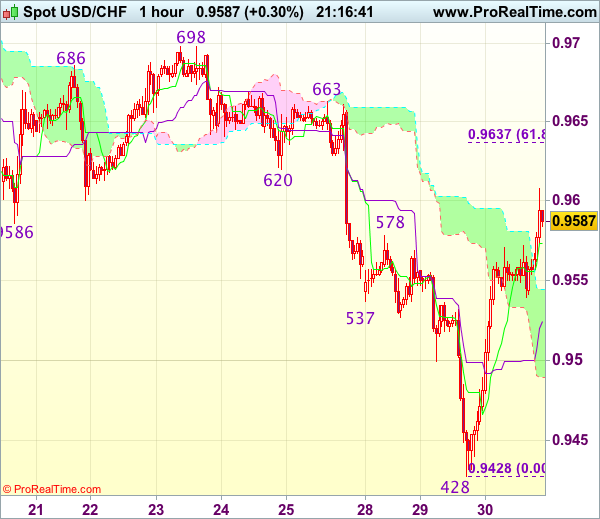
Trade Idea Update: USD/CHF – Buy at 0.9540
USD/CHF - 0.9597
New strategy :
Buy at 0.9540, Target: 0.9640, Stop: 0.9505
Position : -
Target : -
Stop : -
As the greenback found good support at 0.9428 and has staged a strong rebound, suggesting recent decline has formed a temporary low there and consolidation with upside bias is seen for gain to previous support at 0.9620 then 0.9637-40 (61.8% Fibonacci retracement of 0.9766-0.9428), however, near term overbought condition should prevent sharp move beyond resistance at 0.9663 and price should falter below 0.9698-99 resistance, bring retreat later.
In view of this, we are looking to buy dollar on pullback as 0.9539 support should limit downside and bring another rebound later. Below 0.9500-10 would defer and suggest first leg of rise from 0.9428 has ended, risk weakness to 0.9470 but price should stay well above said support at 0.9428, bring another rebound.
Moody’s Upbeat on G20 Growth But Warns of Geopolitical Risks and Protectionism
The credit rating agency, Moody's Investors Service, gave an upbeat assessment of the G20 economies in its latest outlook report on Tuesday. Moody's says it expects annual growth in the G20 countries to average at just above 3% in both 2017 and 2018, up from the 2.6% seen in 2016. Higher-than-expected growth in the first half of the year in the Asian powerhouses of China, Japan and South Korea, as well as strengthening momentum in the Eurozone has led Moody's to raise its growth forecasts.
China's growth for 2017 has been raised from 6.6% to 6.8% and for 2018 from 6.3% to 6.4%. The Japanese growth forecast has been upped from 1.1% to 1.5% in 2017 and from 0.8% to 1.1% in 2018. South Korea is expected to expand by 2.8% in 2017 and 2.5% in 2018, versus previous forecasts of 2.5% and 2.0% respectively. In the euro area, Moody's has raised its forecasts for 2017 and 2018 by 0.3 percentage points to 2.1% and 1.9%, respectively.
In contrast, growth forecasts in the US have been revised down from 2.4% and 2.5% to 2.2% and 2.3% in 2017 and 2018 respectively. Moody's said the downward revision was due to weaker-than-expected growth in the first six months of the year and reduced likelihood of a big fiscal stimulus.
While Moody's said the "balance of risks is more favourable than at the beginning of the year" and that growth has "potential for upside", it cited several potential risks that could harm growth, one of which is the geopolitical risk relating to North Korea. An escalation of tension in the Korean peninsula could damage the growth prospects of the region and hit confidence in emerging market economies. It could also trigger a more sustained rally in safe havens such as gold and the yen.
Moody's also saw risks from the US's more protectionist stance towards trade, while the possibility of the US government defaulting on its debt obligations in the event of a prolonged government shutdown would likely lead to a ratings downgrade, which would unsettle financial markets. Lingering political uncertainty in Washington and receding hopes of a fiscal stimulus have contributed to the dollar's more than 10% slide against a basket of currencies this year.
Another risk raised by Moody's is China's deleveraging efforts to tighten financial regulation, which could have spillover effects onto other countries. Debt concerns are also casting a shadow over Australia and the UK.
Ballooning household debt in Australia could become unsustainable once interest rates start to rise. Australian growth is expected to accelerate to 2.5% in 2017 and 2.7% in 2018, according to Moody's, and although the aussie has appreciated by 10% since the start of the year, a rally in base metal prices has mitigated the impact of a stronger currency, leaving the door open to an interest rate hike in 2018.
The UK is facing a similar risk, with rising household debt and higher inflation leaving consumers exposed as Brexit-related uncertainty starts to drag on growth. Moody's recently changed its collateral outlooks on the UK's structured finance sectors to negative as a result of the weakening consumer backdrop. The pound's sharp depreciation post the Brexit referendum has pushed up UK inflation, while wage growth has failed to pick up. Although sterling has gained some ground against the dollar this year (up almost 5% year to date), it has fallen by around 9% against the euro.
The Eurozone is not totally immune to downside risks either. While the chances of a negative market reaction to the European Central Bank's expected decision in the autumn to reduce its asset purchases are very low, there is still room for surprises that could upset investors. But perhaps a bigger challenge to the Eurozone economy than tighter monetary policy is the euro's rapid rise in the forex markets. The euro has gained almost 14% against the US dollar since the start of the year, breaking above $1.20 this week. Many European exporters are highly sensitive to a stronger currency, particularly in the periphery countries. A sharp appreciation could also hamper the ECB's efforts to boost inflation, potentially leading to a much more gradual withdrawal of stimulus.
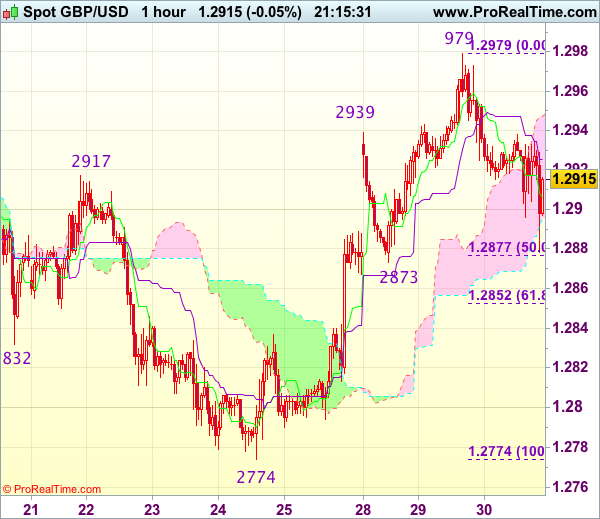
Trade Idea Update: GBP/USD – Buy at 1.2875
GBP/USD - 1.2910
Original strategy :
Buy at 1.2875, Target: 1.2975, Stop: 1.2840
Position : -
Target : -
Stop : -
New strategy :
Buy at 1.2875, Target: 1.2975, Stop: 1.2840
Position : -
Target : -
Stop : -
Cable’s retreat after rising to 1.2979 yesterday suggests a temporary top has been formed there and consolidation with initial downside bias is seen for correction to 1.2873 support, however, renewed buying interest should emerge there and bring rebound later, above 1.2955-60 would signal the retreat from 1.2979 has ended, bring retest of this level, break there would extend recent rise from 1.2774 (last week’s low) to 1.3000, then towards previous resistance at 1.3032 which is likely to hold from here.
In view of this, we are looking to buy sterling on further pullback as support at 1.2873 should limit downside. Below 1.2850 would defer and signal first leg of upmove from 1.2774 has ended, risk weakness to 1.2830 but support at 1.2813 should remain intact, bring another rebound later.
Impact of Hurricane Harvey on the U.S. Economy
Hurricane Harvey made landfall in Southeast Texas on August 25, 2017 and has brought heavy rains and unprecedented flooding to the area, with some counties expected to receive more than four feet of rain by the time it tapers off. Forecasters expect rains to cease tomorrow morning, but this could still change. Given the ongoing deluge, the situation remains fluid, with the economic impact estimates presented below subject to change as more information becomes available. At this point, early estimates of damage suggest roughly $30bn in property losses, which would make Harvey costlier than Andrew and nearly on par with Ike, but well below that of Sandy and Katrina.
The economic impact of the storm can be divided into two phases. The first, taking place right now, is a slump in economic activity related to the shuttering of refineries, ports, oil rigs, and other places of business. This is going to reduce economic activity during the current quarter and depends on the duration of the stoppage and the breadth of businesses affected. The second phase will be the rebuilding phase, which will add to economic activity as homes and businesses are rebuilt and automobiles and other equipment is replaced.
So far, FEMA has declared major disasters in 19 counties that make up the Houston, Victoria and Corpus Christi MSAs. These economies respectively produce $503bn, $5bn, and $23bn of output annually (as of 2015), for a combined total of $530bn - 2.9% of national output. They are also home to about 30% of the national refining capacity, with a sizeable portion of which is currently offline. Moreover, many of the Gulf of Mexico's offshore drilling platforms have been shuttered due to the storm.
Given the significance of refining and chemical industries in the region, most of the direct impact will come from the shutdown of refineries, chemical plants, and oil & gas production. Those two industries produce about $60 billion worth of output in the region (and a total of $100bn in Texas as a whole) - or about $1.2bn per week. The size of the oil & gas extraction industry is roughly the same, producing $70bn in the three metros (and $150bn statewide) - or about $1.3bn per week.
A two week shutdown of these industries would result in about $1.25bn drag, assuming the industry is running at quarter-capacity (as it is now) and $5bn if full shutdown of the industry takes place. There could also be downstream impacts in the rest of the state, decreasing output by another $625 million to $2.5bn.
The combined impact is estimated between $1.9bn to $7.5bn, placing it in line with Hurricane Ike in September 2008, when nondurable manufacturing output declined by $8bn.
Excluding the refining, chemical, and oil & gas industries, the remaining economic activity in the three affected metros amounts to roughly $7.5bn per week. A two-week disruption would reduce GDP by $1.9bn if activity is reduced by one-eighth and $7.5bn if economic activity is halved.
Key Implications
Taken together, the combined GDP impact of $3.75bn to $15bn would slow third quarter GDP down by 0.1 and 0.4 percentage points annualized. GDP was tracking 3% prior to Hurricane Harvey's appearance, suggesting a large cushion remains on overall economic growth during this quarter.
Going forward, clean-up, reconstruction and replacement efforts will provide an economic boost during Q4 and in early-2018. Depending on how staggered activity is, a modest and diminishing economic boost can extend several quarters. A relatively rapid return to full capacity for the refining, chemical, and oil & gas industries in Q4 would produce a sizeable economic boost of 0.1 to 0.4 percentage points, while activity in the first half of 2018 may see a more muted lift.
As far as job losses, these are largely expected to be temporary layoffs that will show up in the weekly initial claims data. The impact on nonfarm payroll numbers will depend on whether the shutdowns extend to the labor force reference week, which includes the 12th of the month. Since Harvey made landfall nearly two weeks after August 12th, there will be no impact on August payrolls in this Friday's employment report. Should layoffs extend into the September reference week, past experiences suggest that Harvey could result in about 20,000 to 50,000 draw down to nonfarm payrolls - something between the impact of Ike on Houston (24,800) and Sandy on New York (45,300).
Given the reduction in refining capacity, the shutdowns are causing gasoline inventories to dwindle and prices to increase, while the opposite has happened to crude oil - a market already weighed down by oversupply. The higher gas prices may reduce consumption spending nationwide during Q3, but this effect is unlikely to be significant unless prices surge.
In addition to the GDP and payroll impacts, other economic indicators including net exports and industrial production should show some weakness in the coming month or two given the importance of the region as an energy and export hub. Still, we don't expect these to impact the conduct of monetary policy with the Federal Reserve to judge the weakness as temporary. In fact, we don't expect the Fed to raise rates again until December, when economic data will already be largely free of the transitory effects of Harvey.
US: Economy Grows Faster than Previously Thought in the Second Quarter
Real GDP increased by an annualized 3.0% in the second quarter of 2017 according to the second BEA estimate (previously reported as a 2.6% gain). This was well above the consensus expectation for a 2.7% uptick.
The bulk of the upward revision was related to stronger consumption spending, which grew by 3.3% (prev. 2.8%). Growth was led by durable spending which rose 8.9% (prev. 6.3%) but the remaining spending categories also performed better than previously reported.
The remainder of the upward revision was related to nonresidential fixed investment, which increased by 6.9% (prev. 5.2%). The upward revision was most apparent in intellectual property which increased by 4.9% (prev. 1.4%) and structures which expanded by 6.2% (prev. 4.9%), while equipment spending was revised higher only slightly to 8.8%.
Residential investment subtracted less than previously thought, contracting by 6.5% (prev. -6.8%) as did net exports which totaled -$613.4bn (prev. -$614.9bn). Inventory investment was a touch higher at $1.8bn (prev. -$0.3bn).
The only major component to be revised down was government, which declined -0.3% (prev. +0.7%) as federal (1.9% vs. 2.3% prev.) spending provided less lift while state and local (-1.7% vs. -0.2% prev.) spending was more of a drag.
The GDP and PCE price deflators were little changed, increasing by 1.0% and 0.9% annualized in the second quarter.
Corporate profits (after IVA and CCA) increased by $26.8bn (1.3%) in the second quarter after a decrease of $46.2bn (2.1%) in the first quarter.
Key Implications
This morning's report suggests that the U.S. economy is on a more solid footing than previously thought with growth revised up more than expected - albeit on par with our own call. Even more encouraging was the breadth of the revisions with all segments of the economy, aside from government, in better shape than previously reported. The revision to consumer spending was the highlight of this report, indicating that the consumer, helped along by strong job and income growth, has definitely woken up after the first quarter lull.
We expect the strength of consumer and business spending to continue into the third quarter. However, the current devastation in Southeast Texas is likely to hit growth in the third quarter, with economic activity substantially disrupted in the Houston, Victoria, and Corpus Christi metro areas. Both consumer spending and business investment are likely to sustain weaker performance as a result, but most of the drag is likely to come from net exports - with refined product exports hard hit given the outages of Gulf Coast refineries and ports shuttered. We expect Harvey to slow GDP growth by anywhere between 0.1 and 0.4 percentage points, with Q3 growth likely to come in in the 2.5% to 3.0% range given current tracking. For a more detailed analysis of the impact of Hurricane Harvey click here.
This report should help solidify the notion that the U.S. economy remained resilient through mid-year and is well positioned to expand in the second half of 2017 and embolden Fed hawks to suggest additional rate rises. Still, the weak inflation figures remain a constraint at this point. We don't expect these to show much progress until later in the year and consequently feel that Fed is unlikely to act until at least December.
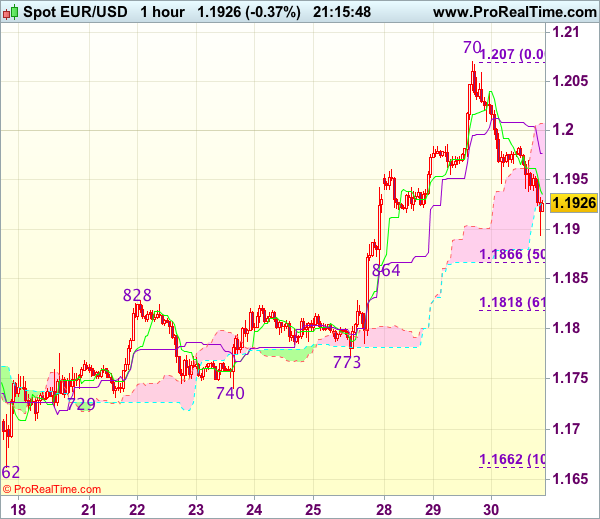
Trade Idea Update: EUR/USD – Stand aside
EUR/USD - 1.1932
Original strategy :
Bought at 1.1965, stopped at 1.1930
Position : - Long at 1.1965
Target : -
Stop : - 1.1930
New strategy :
Stand aside
Position : -
Target : -
Stop : -
The single currency slipped again in European session, dampening our bullishness and suggesting top has been formed at 1.2070 yesterday, hence downside risk remains for retracement of the rise from 1.1662 and weakness to 1.1890-95 cannot be ruled out, however, reckon downside would be limited to 1.1864-66 (previous support and 50% Fibonacci retracement of 1.1662-1.2070) and price should stay above previous resistance at 1.1828, bring rebound later.
On the upside, whilst recovery to 1.1955-60 cannot be ruled out, reckon 1.1980-85 would limit upside and 1.2005-10 should hold, bring retreat later. Above 1.2035-40 would suggest the retreat from 1.2070 has ended, bring another rise towards this level but break there is needed to signal upmove has resumed for headway to 1.2100.
Trade Idea Update: USD/JPY – Buy at 109.55
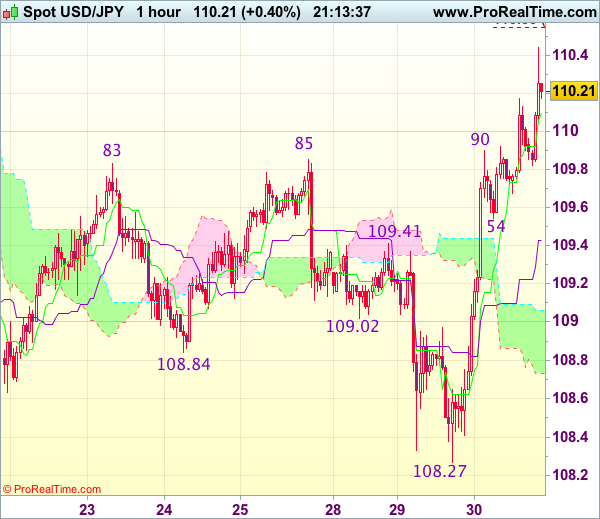
USD/JPY - 110.16
Original strategy :
Buy at 109.45, Target: 110.45, Stop: 109.10
Position : -
Target : -
Stop : -
New strategy :
Buy at 109.55, Target: 110.55, Stop: 109.20
Position : -
Target : -
Stop : -
As the greenback has staged a strong rise after holding above previous chart support at 108.13, suggesting the decline from 114.50 has ended at 108.27 yesterday and mild upside bias is seen for this move to bring retracement of recent decline, hence bullishness remains for further gain to 110.55 (61.8% projection of 108.27-109.90 measuring from 109.54), however, reckon 110.75-80 would limit upside and price should falter below resistance at 110.95, bring retreat later.
In view of this, would not chase this rise here and we are looking to buy dollar on pullback as support at 109.54 should limit downside and bring another upmove. Below the Kijun-Sen (now at 109.43) would defer and suggest an intra-day top is formed instead, bring weakness to 109.05-10 first.