Sample Category Title
USD Thunders Back To Life
USD thunders back to life
The USD thundered back to life augmented by startlingly positive US GDP and labour market data. Also, investors were quick to put the recent North Korean flair up in the rear view mirror as haven assets lost their endearment and US equity markets rebounded.
Risk off flows are becoming an increasingly ephemeral event and are proving to be excellent opportunities for strapping on risk. The latest round of risk aversion was over in a heartbeat as investors continue to bank on amiable central bank policy as opposed to a militaristic escalation in North Korea
Also, the lack of fire and fury from President Trump and a more calculated While House response was viewed far more market friendly and quickly eased investor angst. All in all the markets regained their composure quickly.
Hurricane Harvey continues to leave a nasty footprint devastating Southeast Texas, and the Louisiana coastal communities while weighing negatively on crude demand from the heart of the U.S. petroleum refining industry. So while gasoline premium rises, WTI prices continue to fall as there are few venues available to pick up the processing slack.
But as significantly for currency traders, Harvey’s fallout has inspired a whole new level of debate regarding the debt ceiling showdown as to how the US government will meet federal assistance needs among the debt ceiling debate. But logic should dictate that to not approve a debt ceiling extension would prove to be political suicide for those in opposition given the humanitarian element of this recent natural disaster.
Euro
The ECB will certainly take some consolation the Euro assent reversed as an unexpectedly boisterous US GDP data has lit a fire under the USD dollar overnight. Also, the US ADP report had tongues wagging +237k (vs the +185k expected) – not surprisingly sending analysts scurrying to rethink their NFP headline. But the chance of an uptick in the wage growth component of NFP is what has traders buying the buck in the wake of back to back strong employment reading from both Tuesday’s surging US consumer confidence and last nights stellar ADP.
Japanese Yen
Dollar yen continues to move higher as the risk recovery had begun late in the US trading session on Tuesday rolled on overnight as Wall Street extended gains while haven assets were sold off. However not to completely sugar coat recent events, traders remain dispassionate with the UN resolution on North Korea but with risk rebounding and robust US economic data leading the charge, the current move higher could have some more room to play out.
Australian Dollar
The Australian dollar retreated, giving up earlier gains against the greenback after building approvals fell less than expected in July as the resurgent Greenback takes centre stage after a forecast-beating US GDP print. However with risk sentiment surging the Aussie is unlikely to run too far south from current base levels
USD/CAD Canadian Dollar Lower After US GDP Improvement And Tax Reform Talk
The Canadian dollar depreciated on Wednesday after the private payroll processor ADP posted a 237,000 monthly job gains in the US. The positive news for the US dollar would keep coming in with an improvement on the quarterly GDP estimate now at 3.0 percent after the first forecast of 2.6 percent delivered last month. President Donald Trump made a big push for tax reform earlier today in Missouri but was short on details while putting the onus on making the reform a reality on congress. Tax reform was one of the early supporters of the dollar rally after the November US presidential election results, but it now faces a different political landscape than when Trump first announced it.
A rise in imports to Canada drop the current account deficit higher in the second quarter but it did so at a lower pace than forecasted and the first quarter data was also revised to show a lower deficit than originally reported. Tomorrow's release of monthly GDP will be the highlight on the CAD economic calendar with Canadian production expected to have slowed down to 0.1 percent.
US refineries continue to shut operations in the aftermath of Hurricane Harvey. The storm has taken offline almost 24 percent of refiners with a week or more until they can restart work. West Texas Intermediate is down as there is a supply glut of crude while gasoline prices have risen. Hurricane Harvey ended up closing more refineries than Katrina, which mostly affected platforms reducing the supply of crude. With a world awash in crude it is easier to replace than the capacity for refining those into distillates which explains the sudden rise of gasoline prices. Even the bigger than expected drawdown in last week's US crude inventory data did little to push prices higher.
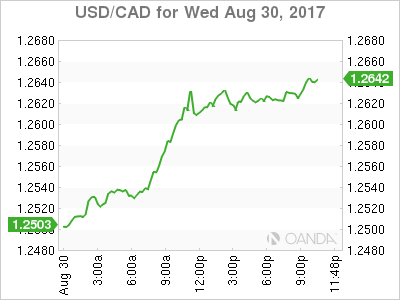
The USD/CAD gained 0.794 percent on Wednesday. The currency pair is trading at 1.2621 near daily highs after a strong ADP private payrolls report has raised expectations of a strong U.S. non farm payrolls (NFP) on Friday. The two employment reports don't have a strong correlation as the NFP report is a more complete look at the jobs component. With the market's confidence in a third rate hike by the U.S. Federal Reserve this year slowing evaporating a strong showing in wage growth could boost the USD.
The main indicator release this week for CAD traders will be the monthly GDP data due on Thursday, August 31 at 8:30 am EDT. The Canadian GDP is expected to have slowed down after a strong first half of the year.
NAFTA negotiations will start on Friday with sources pointing out that Mexico has already started to work out a plan B if US President Donald Trump does indeed withdraw from the trade agreement. Canada has been active pushing trade talks with the United Kingdom, Europe and China but they are far from being active in time to be a reliable backup option to a world without NAFTA.
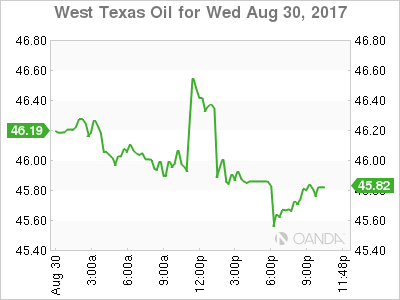
The price of West Texas Intermediate fell 0.845 percent in the last 24 hours. WTI is trading at 45.86 after Hurricane Harvey continues to reduce refinery capacity in Texas. Close to a quarter of refineries are now shut down due to flooding with a week or more before they can reopen.
US weekly inventories did little to stop the drop in crude prices. The Energy Information Administration (EIA) published today a 5.4 million drawdown that eclipsed the 1.9 million barrels that were forecasted. The report data comes just days before Hurricane Harvey hit, as it still shows 96.6 percent refining utilization, which has been the stat that has come down more after the storm.
Market events to watch this week:
Thursday, August 31
8:30 am CAD GDP m/m
8:30 am USD Unemployment Claims
9:45 pm CNY Caixin Manufacturing PMI
Friday, September 1
4:30 am GBP Manufacturing PMI
8:30 am USD Average Hourly Earnings m/m
8:30 am USD Non-Farm Employment Change
10:00 am USD ISM Manufacturing PMI
USD Extends Bounce On Data
Tentative signs of a turnaround turned into something more concrete Wednesday as the US dollar rally continued on strong data. The USD was the top performer while the Swiss franc lagged. USDX finally regains its 200-week MA, a triple bottom beckons, USD jobs around the corner and a potential Draghi jawboning is less than 10 days away. Seems like the perfect USD play. Ashraf's special-edition Premium video on how to play the USD stabilisation.
We wrote yesterday about the positive signs in the US dollar but worried that it hadn't come with any upper-tier data. That changed Wednesday on strong growth and jobs numbers. Q2 GDP was revised to 3.0% from 2.7% on strong corporate profits and consumer spending. The ADP employment report hit a 5-month high at 237K compared to 185K expected.
On the political front, speculation also mounted that relief funding from Hurricane Harvey will make it easier to raise the debt ceiling, at least for a short time. Trump also focused on corporate tax cuts in a speech in Missouri.
The moves in the dollar were substantial. After rising as high as 1.2070 a day ago, EUR/USD sank to 1.1881 and finished on the lows. The commodity currencies were also hit hard late in the day as AUD/USD fell a full cent from the highs in an outside reversal. USD/CAD was one of the reversals we highlighted yesterday and that pair posted its best day in four weeks, climbing 120 pips.
The loonie will stay in focus in the day ahead with Canada delivering the first report on Q2 GDP. Expectations are for a sparking 3.7% reading but the risks are to the downside after soft current account numbers Wednesday.
A full slate of data is up beforehand including the China official PMIs, Australian private sector credit, speeches from the BOJ's Masai and RBA's Harris. That's followed by German retail sales, French CPI, Eurozone CPI, a speech from the BoE's Sanders, the US PCE report and the Chicago PMI among others.
It's safe to say that the summer lull is over.
Gold Yawns as Preliminary GDP Revised Upwards
Gold is showing little movement in the Wednesday session. In North American trade, spot gold is trading at $1309.06, down 0.03% on the day. In economic news, Preliminary GDP posted a strong gain of 3.0%, beating the estimate of 2.7%. There was more positive news from the employment front, as ADP Nonfarm Payrolls jumped to 237 thousand, crushing the forecast of 185 thousand. On Thursday, the US releases unemployment claims.
US numbers looked sharp on Wednesday. Preliminary GDP (second estimate) for the second quarter was revised to 3.0%, a marked improvement from the first estimate of 2.6%. Consumer confidence and spending remain strong and helped contribute to the strong GDP report, as the economy posted its strongest gain since the first quarter of 2015. However, solid consumer spending has failed to boost inflation, which continues to hover at low levels. The lack of inflation could hamper the Federal Reserve's plans to raise interest rates, with the likelihood of a rate hike in December standing at just 35%. On the employment front, ADP Nonfarm Payrolls jumped to 237 thousand, marking a 3-month high. The official Nonfarm Payrolls report will be released on Friday, and if this indicator also beats the forecast, it would be a strong signal that the economic momentum has continued into the third quarter.
Gold is considered a safe-haven asset, and renewed tensions in the Korean peninsula earlier this week propelled the metal above the symbolic $1300 level. On Tuesday, North Korea fired a missile over Japanese territory, drawing sharp condemnations from Japan and the US, with President Trump declaring that "all options remain on the table". However, tensions have since eased somewhat, restoring risk appetite and sending gold prices lower. Still, if North Korea decides to fire another missile towards Japan or the US military base on Guam, it is likely that gold prices will move higher.
Pound Shows Little Change as US GDP Jumps
The British pound continues to have an uneventful week. In Wednesday's North American session, the pair is trading at 1.2914, down 0.04% on the day. On the release front, British Net Lending to Individuals slowed to GBP 4.8 billion, missing the estimate of GBP 5.3 billion. This marked a 3-month low. In the US, Preliminary GDP impressed with a sharp gain of 3.0%, beating the estimate of 2.7%. There was more positive news from the employment front, as ADP Nonfarm Payrolls jumped to 237 thousand, crushing the forecast of 185 thousand. Later in the day, Japan releases Preliminary Industrial Production, with the markets braced for a decline of 0.4%. On Thursday, there are a host of key events in the US, led by unemployment claims.
The US economy scored well on its GDP report card on Wednesday. Preliminary GDP (second estimate) for the second quarter was revised to 3.0%, a marked improvement from the first estimate of 2.6%. Consumer confidence and spending remain strong and helped contribute to the strong GDP report, as the economy posted its strongest gain since the first quarter of 2015. However, solid consumer spending has failed to boost inflation, which continues to hover at low levels. The lack of inflation could hamper the Federal Reserve's plans to raise interest rates, with the likelihood of a rate hike in December standing at just 35%. On the employment front, ADP Nonfarm Payrolls jumped to 237 thousand, marking a 3-month high. The official Nonfarm Payrolls report will be released on Friday, and if this indicator also beats the forecast, it would be a strong signal that the economic momentum has continued into the third quarter.
Have the Brexit negotiations hit a brick wall? Talks have resumed in Brussels, as the two sides are meeting for a third round of talks this week. There are large gaps between the sides, and even the range of topics to be discussed at the onset is in dispute. Britain wants to discuss a future trading relationship with the EU at the same time that points in contention are dealt with, but the Europeans insist on solving the contentious issues first, such as the size of Britain's bill and the jurisdiction of the European High Court on European citizens living in the UK. With plenty of distrust between the sides, the negotiations could grind to a halt if both sides don't show greater flexibility.
Trade Idea Wrap-up: USD/CHF – Buy at 0.9540
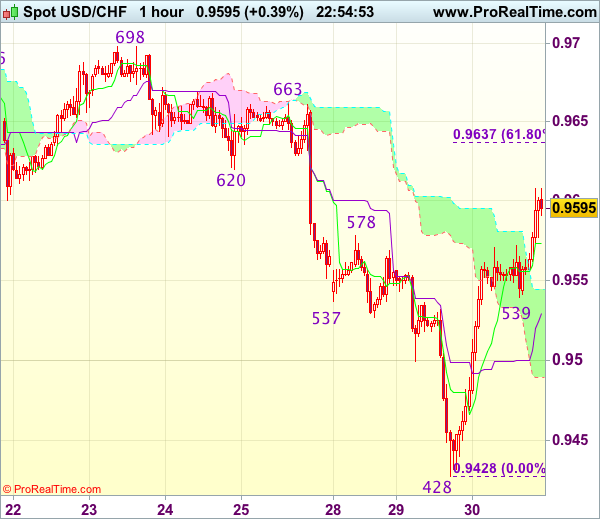
USD/CHF - 0.9596
Most recent candlesticks pattern : N/A
Trend : Down
Tenkan-Sen level : 0.9574
Kijun-Sen level : 0.9534
Ichimoku cloud top : 0.9545
Ichimoku cloud bottom : 0.9489
Original strategy :
Buy at 0.9540, Target: 0.9640, Stop: 0.9505
Position : -
Target : -
Stop : -
New strategy :
Buy at 0.9540, Target: 0.9640, Stop: 0.9505
Position : -
Target : -
Stop : -
As the greenback found good support at 0.9428 and has staged a strong rebound, suggesting recent decline has formed a temporary low there and consolidation with upside bias is seen for gain to previous support at 0.9620 then 0.9637-40 (61.8% Fibonacci retracement of 0.9766-0.9428), however, near term overbought condition should prevent sharp move beyond resistance at 0.9663 and price should falter below 0.9698-99 resistance, bring retreat later.
In view of this, we are looking to buy dollar on pullback as 0.9539 support should limit downside and bring another rebound later. Below 0.9500-10 would defer and suggest first leg of rise from 0.9428 has ended, risk weakness to 0.9470 but price should stay well above said support at 0.9428, bring another rebound.
Dollar Extends Rebound on US Data; Euro Runs Out of Steam
Risk sentiment improved notably on Wednesday as geopolitical risks ebbed, helping the US dollar extend its gains into the European session. The euro was the worst performing major currency as the three-day sharp rally ran out of steam. The commodity-driven Canadian, Australian and New Zealand dollars also came under pressure against the resurgent dollar but the pound was a surprise outperformer.
The euro was unable to hold on to the $1.20 handle after rising above the level yesterday for the first time since January 2015. Stronger-than-expected Eurozone business survey data was unable to lift the euro, which stood 0.4% lower at $1.1923 in late session. It was down a similar amount against the pound at 0.9227, but was flat versus the yen at 131.41.
The European Commission's economic sentiment index beat expectations of 111.3 to rise to 111.9 in August (the highest since 2007) from 111.3 in July. The business climate index also came in above forecasts, rising to 1.09 from the prior 1.04.
The pound benefited from the weakness in euro/pound with cable holding above 1.29 for most of the day. Sterling was up the most against the Canadian and New Zealand dollars, as well as the yen. There was little reaction to Bank of England data showing UK consumer lending expanded at the slowest rate in a year in July, adding to concerns of weakening consumer spending. The pound was last trading flat on the day at $1.2919.
The greenback's overnight rebound gathered momentum at the start of US trading today on the back of upbeat US data. The ADP employment report, seen as a good indication for the official nonfarm payrolls report due on Friday, showed a surprise jump in private-sector jobs of 237k in August. This was the biggest increase in five months and was well above forecasts of 183k and higher than July's upwardly revised 201k.
Further boosting the dollar was the second estimate of GDP growth for the second quarter. Annualized growth in the three months to June was revised up from 2.6% to 3.0%, beating forecasts of 2.7%. US consumer spending rose more strongly than initially estimated but there was no revision to the core PCE price index, which was left unchanged at 0.9% in the second quarter.
The dollar hit a two-week high of 110.43 yen immediately after the data, while the dollar index rose to 92.87, which was a three-day high. A tweet by US President Trump created a brief panic that drove the dollar down to just above the 110 level, before recovering to around 110.20 yen. Trump tweeted "talking is not the answer". However, it was unclear if the President was talking about military action as some reports suggested he may have been referring to US efforts to impose an oil embargo on North Korea.
The Australian dollar could not keep its Asian session gains as the greenback's rebound pushed the aussie lower to $0.7911. The New Zealand dollar fell even more steeply to trade around $0.7210, following another exchange rate warning by RBNZ Governor Graeme Wheeler earlier in the day.
Gold prices were steadier today after coming off 9½-month highs on Tuesday. The precious metal was marginally higher on the day at $1309.50.
Oil prices fell on Wednesday despite another drop in crude stocks in the latest weekly inventory numbers from the US Energy Information Administration. US oil stocks fell by a bigger-than-expected 5.39 million barrels last week versus forecasts of a drawdown of 1.91 million. Gasoline stocks rose unexpectedly but the trend will likely reverse next week for both crude and gasoline stocks as the impact of Tropical Storm Harvey starts to affect inventory levels.
WTI crude was down 1.3% at $45.84 a barrel, while Brent crude declined by 1.4% to $51.29.
The inventory data weighed on the Canadian dollar which fell 0.7% against its US counterpart. A smaller-than-forecast current account deficit for Canada in the second quarter provided little support. Dollar/loonie recovered sharply from yesterday's 4-week lows to reclaim the 1.26 level in late European trading today.
Trade Idea Wrap-up: GBP/USD – Buy at 1.2855
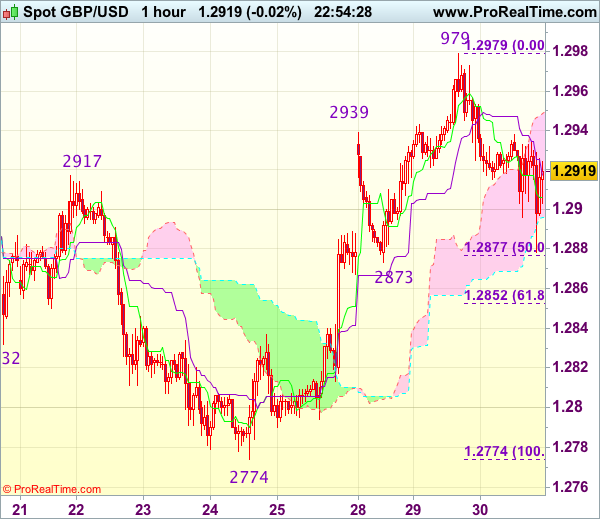
GBP/USD - 1.2917
Most recent candlesticks pattern : N/A
Trend : Near term up
Tenkan-Sen level : 1.2906
Kijun-Sen level : 1.2916
Ichimoku cloud top : 1.2950
Ichimoku cloud bottom : 1.2896
Original strategy :
Buy at 1.2875, Target: 1.2975, Stop: 1.2840
Position : -
Target : -
Stop : -
New strategy :
Buy at 1.2855, Target: 1.2955, Stop: 1.2820
Position : -
Target : -
Stop : -
Cable’s retreat after rising to 1.2979 yesterday suggests a temporary top has been formed there and consolidation with initial downside bias is seen for correction to 1.2873 support, however, renewed buying interest should emerge around 1.2852-55 (61.8% Fibonacci retracement of 1.2774-1.2979) and bring rebound later, above 1.2955-60 would signal the retreat from 1.2979 has ended, bring retest of this level, break there would extend recent rise from 1.2774 (last week’s low) to 1.3000, then towards previous resistance at 1.3032 which is likely to hold from here.
In view of this, we are looking to buy sterling on further pullback as 1.2852-55 should limit downside. Below previous resistance at 1.2837 would defer and signal first leg of upmove from 1.2774 has ended, risk weakness to support at 1.2813 but price should stay well above support at 1.2774, bring another rebound later.
Greenback Restores Previously Lost Positions
Today's trading session was full of important events. First up, the head of the Reserve Bank of New Zealand, Governor Wheeler, stated that the weakening of the New Zealand dollar is needed to balance economic growth in the country. This statement together with the US dollar strengthening has led to a confident price decline of the NZD/USD. International rating agency, Moody's, released positive news for China's GDP growth forecast with an increase to 6.8% from the previously forecasted 6.6%. As a key trading partner for New Zealand, the good news out of China was still unable to change price dynamics for the kiwi dollar.
Moody's also improved the forecast on economic expansion in the Eurozone for 2017 and 2018 to 2.1% and 1.9% respectively. Despite this fact, the EUR/USD was under pressure from the strong GDP report out of the US, according to which the American economy increased by 3.0% in the second quarter - 0.3% better than the expected figure. Traders are still waiting for the labor market report in the US, which will be released on Friday. Additional pressure on the pair's quotes may come from profit taking after a prolonged rally and short position accumulation by the bears on the background of fears that the euro is overbought at the moment.
The USD/CAD is growing on the background of strong macro data from the US and increased demand for the USD. The current account balance deficit in Canada has grown to 16.3 billion in the second quarter against 12.9 billion in the previous period and that, together with the fall of oil quotes, is negative for the Canadian dollar.
EUR/USD
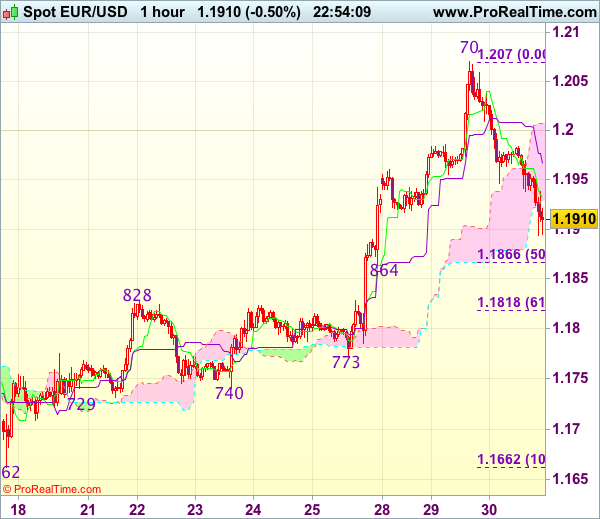
On the EUR/USD price chart we saw the formation of the "head and shoulders" figure that is considered to be a reversal pattern. As a result, quotes tested the support at 1.1900 and its breaking may become the trigger for continued declines to 1.1825 and 1.1700. The upward correction is limited by the local resistance at 1.1950 and its overcoming may lead to further growth up to 1.2000 and 1.2060.
NZD/USD
The NZD/USD fell sharply today and the closet objective within the current impulse is located at 0.7200. Fixing below this line may become the signal to accumulate short positions with the fall potential to 0.7150, 0.7050 and 0.7000. The RSI on the 15-minute chart is in the oversold zone which points to a potential upward correction soon. In this case the price may return to the 0.7260-0.7300 range.
USD/CAD
The USD/CAD price has broken through the local high at 1.2550 and the upper limit of the descending channel. This fact may become a trigger for the trend change to positive with immediate goals at 1.2665 and 1.2800. After the sharp increase, we do not exclude a price correction with the first objective at 1.2550.
Trade Idea Wrap-up: EUR/USD – Stand aside
EUR/USD - 1.1906
Most recent candlesticks pattern : N/A
Trend : Up
Tenkan-Sen level : 1.1932
Kijun-Sen level : 1.1966
Ichimoku cloud top : 1.2008
Ichimoku cloud bottom : 1.1928
New strategy :
Stand aside
Position : -
Target : -
Stop : -
The single currency slipped again after yesterday’s sharp retreat from 1.2070, dampening our bullishness and suggesting top has been formed there, hence downside risk remains for retracement of the rise from 1.1662 and weakness to 1.1890-95 cannot be ruled out, however, reckon downside would be limited to 1.1864-66 (previous support and 50% Fibonacci retracement of 1.1662-1.2070) and price should stay above previous resistance at 1.1828, bring rebound later.
On the upside, whilst recovery to 1.1955-60 cannot be ruled out, reckon 1.1980-85 would limit upside and 1.2005-10 should hold, bring retreat later. Above 1.2035-40 would suggest the retreat from 1.2070 has ended, bring another rise towards this level but break there is needed to signal upmove has resumed for headway to 1.2100.