
Sample Category Title
USD/CAD: Raw Materials Price Index
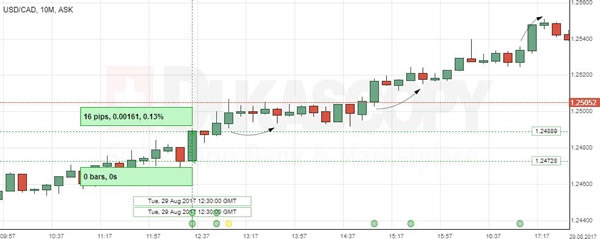
Tuesday reports on the Canadian producer prices managed to sustain an upmove in the USD/CAD currency pair. The Greenback strengthened against the Canadian Dollar by 16 base points to reach the 1.2488 mark, as data showed raw materials and industrial product prices fell more than expected in the month of July.
Statistics Canada reported that its Raw Materials Price Index fell 0.6% in the reported month, below forecasts for a 0.2% drop, while the Industrial Production Price Index marked a 1.1% monthly decline. The decrease was driven by lower prices of recreational and motorised vehicles. The next significant move is expected to be seen after the Canadian GDP report, which is due on Thursday.
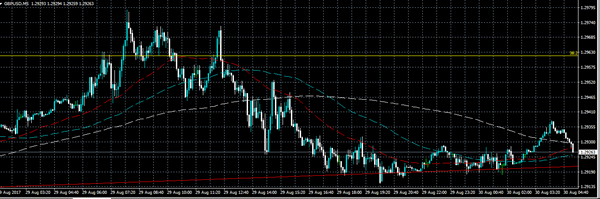
Trade Idea : GBP/USD – Buy at 1.2875
GBP/USD - 1.2916
Most recent candlesticks pattern : N/A
Trend : Near term up
Tenkan-Sen level : 1.2917
Kijun-Sen level : 1.2938
Ichimoku cloud top : 1.2930
Ichimoku cloud bottom : 1.2879
Original strategy :
Buy at 1.2880, Target: 1.2980, Stop: 1.2845
Position : -
Target : -
Stop : -
New strategy :
Buy at 1.2875, Target: 1.2975, Stop: 1.2840
Position : -
Target : -
Stop : -
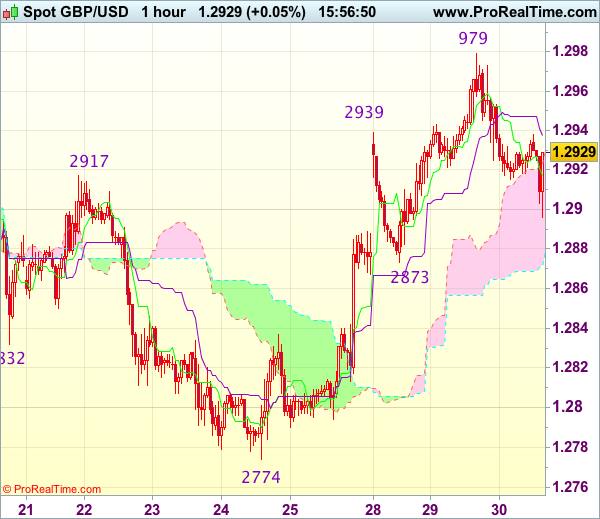
Cable’s retreat after rising to 1.2979 yesterday suggests a temporary top has been formed there and consolidation with initial downside bias is seen for correction to 1.2873 support, however, renewed buying interest should emerge there and bring rebound later, above 1.2955-60 would signal the retreat from 1.2979 has ended, bring retest of this level, break there would extend recent rise from 1.2774 (last week’s low) to 1.3000, then towards previous resistance at 1.3032 which is likely to hold from here.
In view of this, we are looking to buy sterling on further pullback as support at 1.2873 should limit downside. Below 1.2850 would defer and signal first leg of upmove from 1.2774 has ended, risk weakness to 1.2830 but support at 1.2813 should remain intact, bring another rebound later.
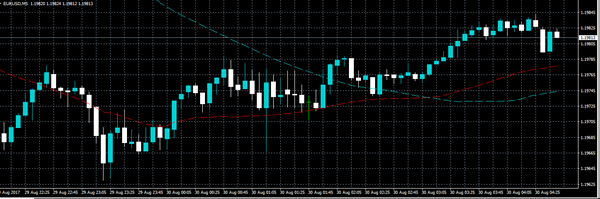
Trade Idea : EUR/USD – Hold long entered at 1.1965
EUR/USD - 1.1948
Most recent candlesticks pattern : N/A
Trend : Up
Tenkan-Sen level : 1.1961
Kijun-Sen level : 1.2004
Ichimoku cloud top : 1.1977
Ichimoku cloud bottom : 1.1896
Original strategy :
Bought at 1.1965, Target: 1.2065, Stop: 1.1930
Position : - Long at 1.1965
Target : - 1.2065
Stop : - 1.1930
New strategy :
Hold long entered at 1.1965, Target: 1.2065, Stop: 1.1930
Position : - Long at 1.1965
Target : - 1.2065
Stop : - 1.1930
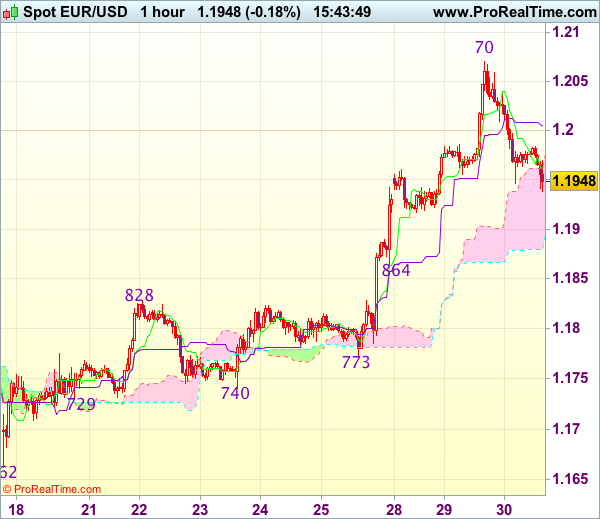
Although the greenback has remained under pressure after retreating quite sharply from yesterday’s high of 1.2070 and further consolidation below this level would be seen, reckon downside would be limited and bring rebound to the Kijun-Sen (now at 1.2004), break there would bring test of 1.2040 but break there is needed to signal the retreat from 1.2070 has ended and bring retest of this level.
In view of this, we are holding on to our long position entered at 1.1965. Below 1.1930 would risk test of support at 1.1917, break there would signal a temporary top has been formed at 1.2070 yesterday, bring retracement of recent rise to 1.1890-95 but support at 1.1864 should remain intact.
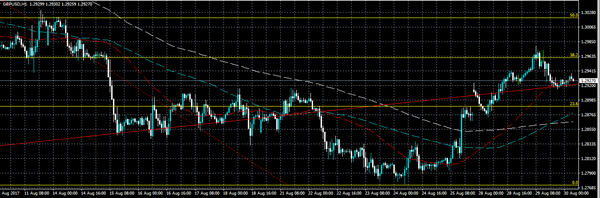
Technical Outlook: GBPUSD – Rising Downside Risk On Formation Of Reversal Pattern And Return Into Daily Cloud
Technical Outlook: GBPUSD – Rising Downside Risk On Formation Of Reversal Pattern And Return Into Daily Cloud
Cable stays in red in early European trading on Wednesday and returned back into daily cloud after Tuesday's rally spiked at 1.2978 but subsequent quick pullback erased all gains.
Tuesday's action formed Shooting Star reversal pattern which was negative signal, with today's close lower needed to confirm.
Formation of 20/55SMA bear cross also weighs on near-term action.
Downside attempts were so far contained by rising 100SMA and Fibo 38.2% of 1.2773/1.2978 upleg and firm break here would be next bearish signal, for extension towards daily Tenkan-sen 1.2875 and daily cloud base (1.2857).
Negatively aligned daily studies are also supportive for bearish near-term action.
Alternative scenario requires close above cracked Fibo 38.2% of 1.3268/1.2773 (1.2962) descend to shift near-term bias higher for test of 30SMA (1.2986) and psychological 1.3000 barrier.
UK data are due in a while and expected to generate fresh signals.
Res: 1.2929, 1.2962, 1.2986, 1.3000
Sup: 1.2900, 1.2875, 1.2857, 1.2821
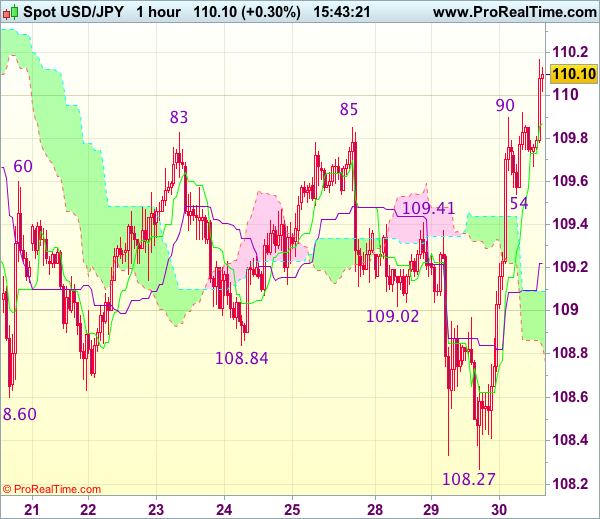
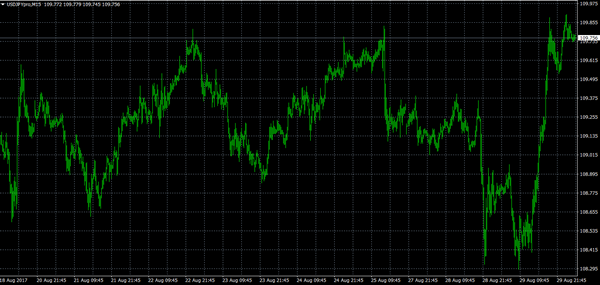
Trade Idea : USD/JPY – Buy at 109.45
USD/JPY - 109.97
Most recent candlesticks pattern : N/A
Trend : Near term down
Tenkan-Sen level : 109.87
Kijun-Sen level : 109.22
Ichimoku cloud top : 109.09
Ichimoku cloud bottom : 108.83
New strategy :
Buy at 109.45, Target: 110.45, Stop: 109.10
Position : -
Target : -
Stop : -
As the greenback has staged a strong rise after holding above previous chart support at 108.13, suggesting the decline from 114.50 has ended at 108.27 yesterday and mild upside bias is seen for this move to bring retracement of recent decline, hence test of resistance at 110.37 would be seen, however, reckon 110.55 (61.8% projection of 108.27-109.90 measuring from 109.54) would limit upside and price should falter well below resistance at 110.95, bring retreat later.
In view of this, would not chase this rise here and we are looking to buy dollar on pullback to 109.40-45 should limit downside and bring another upmove. Below the Kijun-Sen (now at 109.22) would defer and suggest an intra-day top is formed instead, bring weakness to 108.95-00 first.
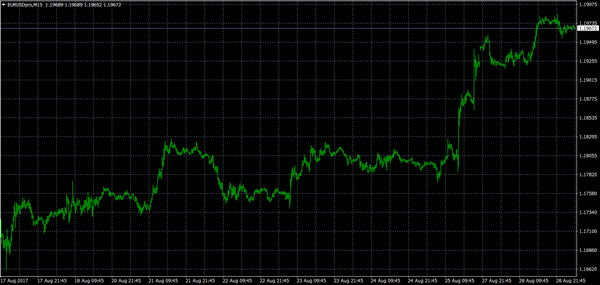
Technical Outlook: EURUSD Is Consolidating After Initial Probe Above 1.2000 Failed To Sustain Gains
The Euro is in red in early Wednesday's trading and holding below 1.2000 barrier, entrenched within 40-pips range in Asian session.
Extension of strong three-day bullish acceleration from 1.1773 trough peaked at 1.2070 on Tuesday, but probe above psychological 1.2000 target proved to be short-lived, as close of Tuesday's trading occurred below 1.2000 handle after traders booked profits.
Risk of deeper pullback is rising as Tuesday's action ended in red Doji with long upper shadow and fresh easing on Wednesday threatens of forming reversal pattern on daily chart.
In addition, daily RSI is turning south after touching o/b zone border line while slow stochastic reversed from overbought territory, showing a plenty of room at the downside.
The price is focusing pivotal supports at 1.1910/00 zone (former top of 02 Aug / Fibo 38.2% of 1.1662/1.2070 upleg / base of ascending hourly cloud which was penetrated on extension of pullback).
Sustained break here would signal deeper pullback and put immediate bulls on hold.
However, overall bullish structure favors fresh upside after correction, with extended pullback expected to hold above 1.1818 (Fibo 61.8% of 1.1662/1.2070 upleg / rising 20SMA).
Res: 1.1984, 1.2000, 1.2070, 1.2101
Sup: 1.1941, 1.1910, 1.1850, 1.1818
Euro Awaits Key German Inflation Data
The EURUSD pair has moved back below the psychological 1.2000 level, dropping over 100-pips from the new 2017 price high set on Tuesday, with price finding intraday support from the 1.1946 level.
At present, the euro is trading around the 1.1980 level, with the 50-hour moving average currently supporting price-action, as traders await the release of German inflation data for the month of August.
On an intraday basis, the EURUSD remains vulnerable to further losses while trading below the daily pivot point, at 1.1997. The euro remains strongly bullish in the medium and long-term while trading above the 1.1660 level.
Key intraday technical resistance for the EURUSD is found at 1.1997, 1.2030 and yesterday's price high, at 1.2070.
To the downside, EURUSD support is found at 1.1959, today's current swing price low, at 1.1946.
The euro's 100-day moving average is found at 1.1903, just below the current weekly price low, at 1.1916.
Sterling Cautious Ahead Of High Impact U.S Data
Sterling continues to move lower in early Wednesday trading, finding support from the 1.2914 level, after price-action was strongly rejected from the pairs 50-day moving average, at 1.2979.
Currently, the GBPUSD pair is trading back above the hourly time frame 100-period moving average, at 1.2920, as investors await the U.S ADP jobs report for August, and second quarter GDP figures from the U.S.
On an intraday basis, GBPUSD turns bearish below the 1.2920 level, while the medium-term outlook is still bullish above 1.2856 level, the long-term outlook remains bearish below the 1.3080 level.
Key intraday technical support is found at 1.2914, 1.2890, with the GBPUSD weekly pivot point offering strong support, at the 1.2856 level.
Key technical GBPUSD resistance is found at 1.2940, with the daily time frame 50-period moving average, at 1.2979. Above the 1.2979 level, the pair has scope for further advancement towards 1.3047 and 1.3125.
US Payrolls Data Take Centre Stage
The economic data returns to the limelight on Wednesday, with reports on German inflation and US employment making headlines.
Action begins in Europe at 08:00 GMT with a ZEW survey on Switzerland’s business climate. A half hour later, attention shifts to the United Kingdom with reports on consumer credit, net lending to individuals and mortgage approvals.
The European Commission’s statistical agency will release a batch of sentiment indicators at 09:00 GMT. These include services sentiment, consumer confidence, industrial confidence, business climate and economic sentiment.
The biggest news release from the continent comes at 12:00 GMT when Germany’s Federal Statistical Office reports on inflation. The preliminary consumer price index (CPI) is forecast to come in at 1.8% annually in August, up slightly from 1.7% the previous month. The harmonised index of consumer prices (HICP) is forecast to come in at 1.7% year-over-year.
In North America, the ADP Research Institute will release its monthly private sector payrolls report at 12:15 GMT. The report, which is released 48 hours in advance of the official nonfarm payrolls data, is expected to show the creation of 185,000 private-sector jobs for the month of August. That follows a gain of 178,000 the previous month.
Just 15 minutes later, the US Commerce Department will release revised second quarter GDP numbers. The revised estimate is forecast to show annual growth of 2.7%, up slightly from the advance estimate of 2.6%.
Oil traders will also look for the weekly inventory report from the US Energy Information Administration (EIA). The weekly data set is forecast to show a 2.1 million-barrel drawdown in commercial crude inventories for the period ended 25 August.
USD/JPY
The US dollar rebounded against the yen on Tuesday, but continues to move with a bearish bias. The pair was up 0.2% at 109.77 ahead of the European session after coming within a few pips of 110.00. A reversal back toward 108.60 raises the risk of a bigger downtrend. In the opposite direction, another close above the 20-day simple moving average (109.60) may draw more bidders into the mix.
EUR/USD
The euro continued to trade near multiyear highs on Wednesday after briefly eclipsing the 1.20 barrier. Prices were up 0.1% at 1.1979 during Asian trade. The psychological 1.20 barrier continues to be the major test for the EUR/USD. On the opposite side of the ledger, immediate support is located at 1.1910 followed by 1.1848.
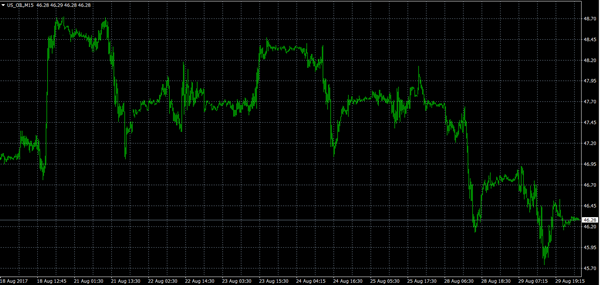
WTI OIL
US crude prices have declined in back-to-back sessions, as traders assess the fallout from Hurricane Harvey. Prices were down 0.3% during the Asian session to reach $46.31 a barrel. The short-term outlook remains bearish, with the Relative Strength Index (RSI) in the low-40s and the MACD in negative territory.
Dollar Pares Losses As North Korean Risks Ease, Aussie Hits 3-Week High On Upbeat Construction Spending
While the US counts the damage from the ongoing disastrous tropical storm Harvey, the dollar managed to reverse losses during the Asian trading hours as investors' fears over a dangerous escalation of tensions between North Korea and the US eased. Meanwhile, the aussie peaked at a 3-week high after construction projects recorded the highest growth in six years.
Despite catastrophic thunderstorm Harvey continuing to move slowly around Texas, causing the death of 12 people and a damage amounting to 10bn dollars so far, the dollar surged on Wednesday against a basket of major currencies as investors gave up a part of their safe-haven assets. This came after the UN Security Council in an emergency meeting yesterday did not punish North Korea with further sanctions. In the same day, the US president during his visit to Houston said in response to the latest and most dangerous North Korea's missile test that “the world has received North Korea's latest message loud and clear”. Moreover, he added that “all options are on the table”.
The dollar index, which gauges the dollar's strength against a trade-weighted basket of currencies, jumped to 92.48 after It touched a 2 ½ -year low of 91.52 on Tuesday.
Dollar/yen bounced up by 0.26% to overcome the key 110 level, recovering from yesterday's losses which pushed the pair to a 4-month low of 108.25.
Dollar/swiss franc was moving sideways around 0.9560 during the Asian session after it climbed above the 0.9500 key level on late Tuesday.
In Australia, the Australian Bureau of Statistics released data on building approvals and construction projects completed. According to the numbers, building approvals fell unexpectedly by 1.7% m/m in July, following a substantial rise of 11.7% in the previous month. Expectations were for a decline of 5% instead. On the other hand, construction works completed in the second quarter surprised analysts as the figure revealed a growth of 9.3% q/q compared to 1.0% forecasted and 0.9% seen in the previous quarter. This was the highest increase posted since November 2011. As a result, the aussie rose to a 3-week high of $0.7994 during early Asian trading before it pulled back to $0.7967.
The kiwi retreated against the dollar to $0.7252 after the RBNZ Governor Graeme Wheeler, who steps down from his role at the end of September, argued on Wednesday that a lower kiwi was needed to support exports and inflation.
Looking at commodities, oil prices continued weakening, while gold experienced a sharp fall amid softer geopolitical risks. WTI crude dropped by 0.19% to $46.35 per barrel, whilst Brent declined by 0.10% to $51.95. Gold sank to $1308.06 per ounce, after touching a 9-month high of $1325.85.