Sample Category Title
Elliott Wave View: CL_F Oil Pullback In Progress
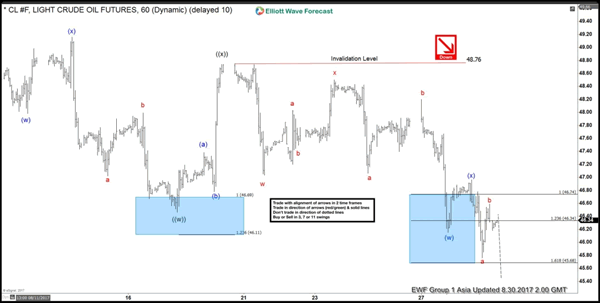
Oil Short Term Elliott Wave suggests that the decline from 8/1 peak is unfolding as a double three Elliott Wave Structure where Minute wave ((w)) ended at 46.46 and Minute wave ((x)) ended at 48.76. Oil has since made a new low below Minute wave ((w)) at 46.46 suggesting the next leg lower has started. Wave ((y)) is in progress and also subdivided as a double three where Minutte wave (w) ended at 46.15 and Minutte wave (x) is proposed complete at 46.96.
Near term, while bounces stay below Minute wave ((x)) at 48.76, Oil has scope to extend lower towards 43.92 – 44.85. This is an inflection area where Minute wave ((w)) = Minute wave ((y)) and buyers can appear in this area for at least a 3 waves bounce. We don’t like selling Oil and expect buyers to appear at 43.92 – 44.85 area (if reached) for at least a 3 waves bounce, provided that pivot at 6/21 low (42.07) remains intact.
Oil 1 Hour Elliott Wave Chart
EURUSD Breaks 1.20 For The First Time Since December 2014
EURUSD broke 1.20 for the first time since December 2014 on Tuesday, as further tensions between the US and North Korea brought in USD Bears, and ECB President Draghi's recent lack of information on the ECB's monetary policy brought in EUR Bulls.
The latest North Korea missile firing had Japan stating that such action posed an 'unprecedented, grave and serious threat'. Japan has requested that the United Nations Security Council hold an emergency meeting. Tensions between North Korea and the US will become even more 'strained with President Trump stating that the U.S. will consider 'all options' in its response. North Korean leader Kim Jong Un said the test-firing of a missile over Japan on Tuesday was a 'meaningful prelude' to containing the American territory of Guam, adding he will 'continue to watch the response of the US before deciding on further action'.
The US Conference Board released Consumer Confidence on Tuesday. The release beat market estimates and improved upon the last reading of 120.0 by coming in at 122.9. The release was the strongest level seen in 5 months, as consumers are more confident about the improving labor market. With US house prices rising in June, it suggests a recent improvement in consumer spending is likely to be sustained. Overnight the markets have seen some risk-on sentiment returning with USD making gains across the board.
EURUSD climbed over 0.5% on Tuesday, reaching a high of 1.20697, a level not seen since December of 2014. Currently, EURUSD has given up its Tuesday gains to trade around 1.1960.
USDJPY, favored as a safe-haven, declined over 0.7% on Tuesday hitting a low of 108.264. USD bulls returned overnight, pushing USDJPY higher with the pair currently trading around 110.00.
GBPUSD traded in a 60-pip range on Tuesday, but did, nonetheless, hit a 2-week high at 1.29782 before retracing lower to currently trade around 1.2915.
Gold continued to strengthen, benefitting from its safe-haven status. Gold traded to a yearly high of $1,325.96 on the day before retracing overnight to currently trade around $1,309.
WTI continued its decline on Tuesday, impacted by Tropical Storm Harvey's devastation on the US refining industry, to trade nearly 2% lower at $45.98pb. More than 16% of refining capacity in the US has shut down due to the storms devastation. Currently, WTI is trading around $46.56pb.
The major economic releases for Wednesday will come out of the US:
At 13:15 BST, US ADP Employment Change for August will be released. Consensus calls for an improvement to 185K from the previous 178K. The ADP report will be a crucial data point ahead of Friday's NFP. Whilst there is limited correlation between ADP and NFP, the markets will be looking for wage growth information ahead of Friday's Average Earnings release.
At 14:30 BST, the US Bureau of Economic Analysis will release Gross Domestic Product Annualized for Q2. The markets are expecting the release to come in at 2.7%. Forecasts call for a slight increase, from the previous reading of 2.6%, as a strong US labor market is expected to fuel personal consumption, the largest contributor to US economic growth. If GDP comes in stronger than 2.7% markets will expect to see some USD buying, yet, with current geopolitical tensions and a lack in confidence in the current Administration, this is likely to be short lived.
USDJPY Intraday Analysis
USDJPY (109.78): USDJPY fell sharply yesterday to mark a 4-month low at 108.26. The greenback managed to recover as the currency pair closed bullish on the day. Further near-term gains can be expected if the momentum to the upside continues. Price action is seen breaking past the second falling trend line. In the near term, we cannot rule out another dip to the support level at 109.15. However, the bullish momentum can be expected only on a breakout above the resistance level that was established at 110.72. The breakout is also marked be the descending triangle pattern that is seen suggesting some near term upside to 110.72.

GBPUSD Intraday Analysis
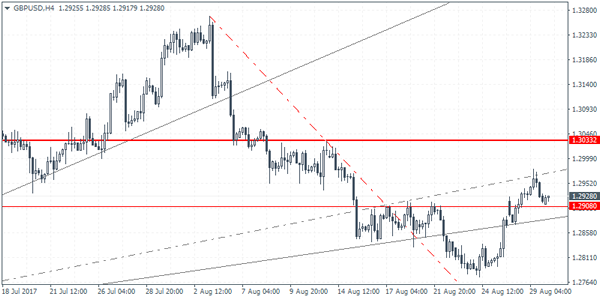
GBPUSD (1.2928): The British pound also posted modest gains, but price action fell to close bearish on the day. Still, the upside bias remains as the British pound could be seen pushing towards the 1.3032 handle where resistance could be most likely tested. In the event that GBPUSD posts a reversal, we could expect the declines to push back to the current support established at 1.2908. Therefore, GBPUSD remains range bound within these levels. A breakout off the support or resistance could suggest further continuation in the trend.
EURUSD Intraday Analysis
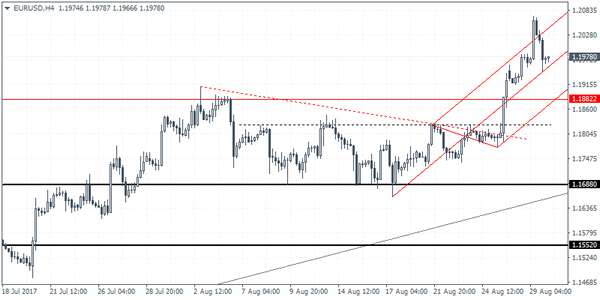
EURUSD (1.1978): The euro touched fresh highs at 1.2069 yesterday, filling the gap from January 2015. With price action pulling back off the session highs, we could expect to see some retracement in the near term. Price could potentially consolidate near 1.2000 handle before we can expect to see some declines. A near-term bounce could see EURUSD retest the 1.2000 resistance level while support is seen at 1.1882 and 1.1825. Further gains could be seen coming, but with the Friday's payrolls report and next week's ECB meeting, the common currency could head into a period of consolidation.
US Dollar Recovers, Eyes Q2 GDP Report And ADP Payrolls
The US dollar was seen pulling back from a 31-month low. The US dollar index fell to 91.54 yesterday as reports about the missile test from North Korea rattled the markets. However, the markets recovered later on with the greenback closing with modest gains.
On the economic front, the conference board's consumer confidence report rose to 122.9, beating estimates of 120.9, although the previous month's report was revised down to 120.0. The U.S. housing price index was also seen rising at the same pace as the previous month at a rate of 5.7% on the month.
Looking ahead, the economic calendar starts to gain pace. The US private payrolls data will be coming out today with forecasts showing that private sector hiring rose 186k in August. This is above July's print of 178k. Later, the second revised estimates for the quarterly GDP data is expected to show that the US economy expanded 2.7% in the quarter ending June.
Currencies: Dollar Decline Shows Tentative Signs Of Slowing Down
Sunrise Market Commentary
- Rates: Potential trend reversal signal?
Today's eco calendar is interesting. German inflation readings and the ADP employment report will get most attention from a market point-of-view. US yields show potential trend reversal signals (while simultaneously testing key support!). This would be especially valid if disappointing data fail to initiate a new bond rally. - Currencies: Dollar decline shows tentative signs of slowing down
Yesterday, the dollar rebounded impressively intraday after an initial sell-off. USD/JPY, the trade-weighted dollar and USD/JPY show trend reversal signals. Will the USD decline take a breather? The EUR/GBP rally also looks like running into resistance.
The Sunrise Headlines
- US equities ended with small gains yesterday, recovering from early weakness on the back of European risk aversion (North Korea-linked). Overnight, Asian stock markets paint a similar picture as WS.
- Flooding from Tropical Storm Harvey has shut nearly a fifth of US oil-refining capacity, triggering worries about a gasoline supply crunch as the slow-moving tempest lumbers through the heart of America's petrochemicals industry.
- The UN strongly condemned North Korea's launch of a ballistic missile over Japan, calling the actions "outrageous,". They didn't discuss new sanctions. The US and Japan sought an oil embargo on Pyongyang, but China resisted.
- US consumer confidence ticked higher in August (from 120 to 122.9) and remains near its multiyear high. Both the sub-indices, present situation and expectations, improved.
- Growth in Japan's retail sales moderated in July – but less than had been expected after an earlier reading for household consumption in July fell into unexpected contraction. Retail sales rose 1.9% Y/Y.
- The Czech central bank may debate tightening monetary policy at any upcoming policy meeting, Vice-Governor Hampl said in an interview, and he might vote to raise interest rates as early as the next meeting, in September.
- Today's eco calendar heats up with EC EMU confidence indicators, German inflation, the US ADP employment report and the second reading of Q2 GDP. The Italian debt agency auctions BTP's and Fed Powell is scheduled to speak
Currencies: Dollar Decline Shows Tentative Signs Of Slowing Down
Dollar succeeds nice intraday comeback
Yesterday, geopolitical uncertainty on north Korea and the potential negative impact of hurricane Harvey initially installed an outright risk-off sentiment in European trading. The yen, the CHF and the euro were the safe haven currencies. EUR/USD cleared the 1.20 mark. USD/JPY came within reach of the 1.0813 key support. However, equities and the dollar rebounded in US trading. The comeback was supported by a good US consumer confidence. EUR/USD finished a volatile session at 1.1972 (from 1.1979). USD/JPY more than reversed the initial setback and closed at 109.71.
Overnight, Asian equity markets show gains of about 0.5% as uncertainty on North Korea subsides. Japanese retail sales were strong, but as usual had little impact on the yen. USD/JPY holds in the upper half of the 109 big figure as a better global sentiment supports the dollar across the board. EUR/USD stabilizes in the 1.1975 area. The Aussie dollar rebounded close to the AUD/USD 0.80 barrier after strong construction data.
Today, the eco calendar contains German inflation and the confidence data of the EC. In the US the APD labour market report and the second reading of the US GDP will be published. EC confidence is expected to confirm recent strong national reports. German HICP inflation is expected to rise 0.1% M/M to be up 1.7% Y/Y (from 1.5% Y/Y in July). A rise in German headline inflation might be slightly supportive for the euro. ADP private job growth is expected at a solid 185K. We side with the consensus. In globo, the data might be slightly more in favour of the euro than the dollar. However, global sentiment will be at least as important as the data. If sentiment on risk improves further and if core/US yields rebound, the dollar might get some further relief. The jury is still out, but USD/JPY, the tradeweighted dollar, EUR/USD and the 10-y US yield yesterday showed some trend reversal signals. The US payrolls (and wage data) on Friday, will be key about the room for a sustained USD rebound. Given today's calendar (e.g. higher German inflation), it would already be constructive signal for the dollar if it maintains yesterday's intraday rebound (against the euro).
Broader context and technical picture. Late June, EUR/USD started a new up-leg as investors anticipated a reduction of ECB bond buying. The Fed was expected to normalize policy only in a very gradual way as US inflation remains soft. Uncertainty on the policy of the Trump administration was a secondary negative factor for the dollar. EUR/USD set a new correction top north of 1.19 before consolidating in a narrow 1.1662/1.1910 range. The top of this range was broken after Jackson hole and EUR/USD jumped (temporary) above 1.20, but couldn't maintain this break. Sentiment on the dollar remains fragile, but there are signs of a EUR/USD topping out. Strong key US data later this week need to confirm these. In MT perspective, the EUR/USD rally might have gone far enough. A return of EUR/USD to the 1.15/16 area is possible. Pockets of US political risk are a (negative) wildcard for the dollar. We wait for a technical signal. A downward correction in core (US and European) yields supported the yen in August. USD/JPY declined from mid-114 mid-July and came within reach of the key 108.13 range bottom yesterday, but the support did its job. We maintain the working hypothesis that this level won't be easy to break as a lot USD bad news is discounted. A cautious buy-on-dips (with stop-loss protection below 108) may be considered.
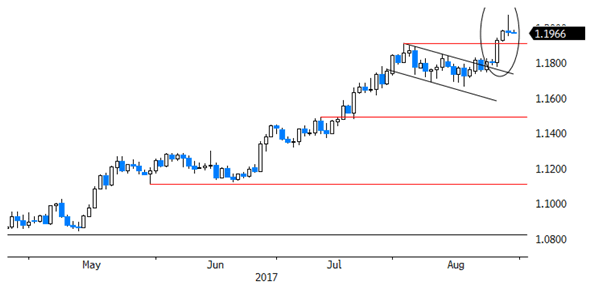
EUR/USD fails to sustained break north of 1.20. Is the rally a bit exhausted?
EUR/GBP
EUR/GBP: test of +0.93 rejected?
Sterling trading was both affected by technical/global market considerations and by fundamental issues yesterday. Regarding the 'fundamentals': the third stage in the Brexit-negotiations between the EU and the UK still look like a dead end street. EU commission President Juncker simply earmarked the UK's position papers as not satisfactory. Initially USD weakness prevailed though, pushing cable temporary to the 1.2975/80 area. At the same time, the Brexit noise clearly caused a substantial underperformance of cable versus EUR/USD. EUR/GBP jumped temporary north of 0.93. However, later in the session, EUR/USD reversed the euro losses and so did EUR/GBP. The pair closed the session at 0.9267.
UK July money supply and lending data will be published today. We expect them to be only of intraday significance for sterling trading. The stalemate in the Brexit negotiations is no help for sterling, but should be more or less discounted. Global factors might dominated sterling trading. An extension of EUR/USD's correction and improvement in risk sentiment, might also trigger a corrective comeback of sterling against the euro. As is the case for EUR/USD, EUR/GBP also shows some doji-like topping out signal yesterday.
From a technical point of view, EUR/GBP cleared the 0.8854/80 resistance (top end June), opening the way for further gains. The move was the result of euro strength. Simultaneously, UK price data were soft enough to keep the BoE sidelined. MT, we maintain a buy EUR/GBP on dips approach as we expect the combination of relative euro strength and sterling softness to persist. The 0.9415 'flash-crash spike' is the next target on the charts. However, we don't jump on the up-trend anymore after the recent rally and wait for a correction, e.g. to the technical support in the 0.88/89 area
EUR/GBP: rally to take a breather?
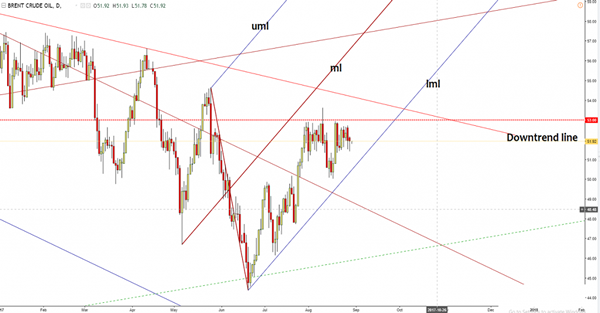
Brent Oil Seems Undecided
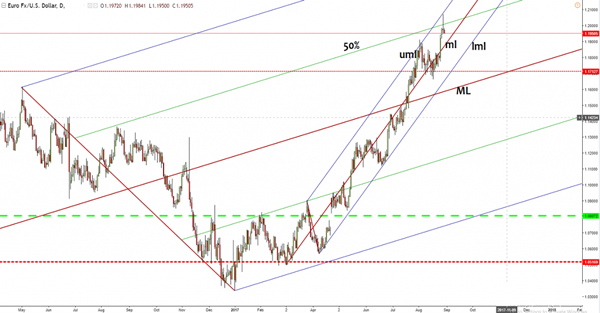
Brent has decreased in the last two days, but now looks undecided again. Needs a spark to be able to start a significant move. Is moving in range on the short term after the failure to close above the 53.03 static resistance. I’ve said in the previous reports that it could decreae to retest the lower median line (lml) of the minor ascending pitchfork. Technically should drop much below the $50 per barrel after the failure to approach and reach the median line (ml).
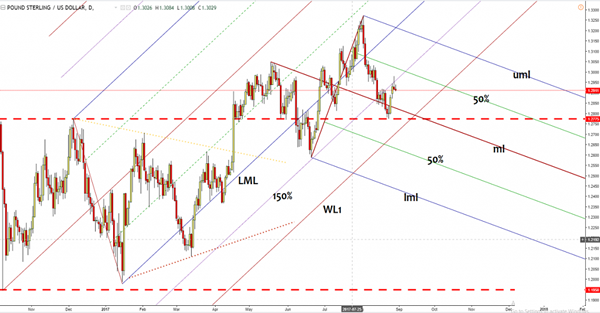
GBP/USD Rejected By Dynamic Resistance
Price has found strong resistance at the 150% Fibonacci line (ascending dotted line) and now is going down again. GBP/USD failed to approach and reach the 50% Fibonacci line and now could drop towards the median line (ml) of the descending pitchfork, actually could be attracted by the confluence area formed by the median line (ml) with the WL1 of the ascending pitchfork.
EUR/USD Too Exhausted To Stay Higher
Price is trading in the red rigth now and could resume the yesterday’s bearish candle. Technically is expected to decrease a little on the short term after the yesterday’s spike. EUR/USD rallied on Tuesday, but failed to stay near the 1.2070 high and now seems heavy and poised to correct after the bullish momentum.
The USDX is trading in the red right now, but is less likely to reach the 91.62 yesterday’s low. The behavior could change on the USDX, a minor accumulation will signal a rebound. USD needs a helping hand from the United States economy, only some positive data will force it to turn to the upside again.
The US ADP Non-Farm Employment Change is expected to increase from 178K to 185K, while the Prelim GDP could increase by 2.7%, more versus the 2.6% in the previous month. The FOMC Member Powell’s speech should bring some action as well. I want to remind you that another disappointment will demolish the USD.
Price has found strong resistance right below the upper median line (uml) of the minor ascending pitchfork, failing to touch this dynamic obstacle. Has show exhaustion signs because has closed the day also much below the 50%Fibonacci line. Should come down to retest the median line (ml) of the minor ascending pitchfork. A breakdown below it will attract more sellers.