Sample Category Title
Technical Outlook: GBPUSD – Initial Attempt Above Daily Cloud Failed But N/T Bulls Are Still In Play
Cable opened with gap-higher on Monday and spiked at 1.2924, probing briefly above daily cloud top (1.2912) but gains were so far short-lived and capped by 55SMA.
Subsequent pullback so far found footstep above strong support at 1.2857 (daily cloud base, reinforced by 10SMA). Good demand lies at this zone and bulls need to hold above here for renewed attempts higher.
Technical studies are mixed on daily chart but bullish signal was generated on completion of reversal pattern on Friday.
Sustained break above daily cloud/55SMA would open psychological 1.3000 barrier (also 30SMA for test). Conversely, return and close below daily cloud would be negative signal and shift near-term focus lower.
Res: 1.2912, 1.2924, 1.2962, 1.2992
Sup: 1.2873, 1.2857, 1.2811, 1.2793
Technical Outlook: EURUSD Remains Steady In Early Monday And Eyes Target At 1.2000
The Euro maintains firm tone and holding near fresh high at 1.1959, posted in early hours of Asian session on Monday.
The single currency accelerated strongly on Friday, gaining 1.05% for the day, boosted after speech of ECB President Mario Draghi at Jackson Hole economic symposium, when the ECB’s chief avoided giving any comment about central bank’s monetary policy and indication of the start of tapering stimulus program.
Instead, Draghi said that the recovery in the Eurozone is gaining momentum.
Friday’s strong rally and eventual close above 1.1910 (former top of 02 August) was strong bullish signal for resumption of broader uptrend after completion of bullish flag continuation pattern.
Near-term focus turns towards 1.2000 target, which marks strong psychological / option barrier and the price may show stronger hesitation on approach. Overbought slow stochastic on daily chart supports the notion.
Mild downside action was seen so far, however, stronger dips cannot be ruled out. Good supports lay at 1.1900 zone and 1.1845 (Fibo 38.2% of 1.1662/1.1959 upleg) with 10/20SMA bull-cross forming at 1.1800 and underpinning the action.
Firm break above 1.2000 barrier would trigger large stops parked above and spark fresh acceleration towards targets at 1.2100 (round-figure) and 1.2166 (50% retracement of larger 1.3992/1.0340 descend).
Res: 1.1959, 1.2000, 1.2063, 1.2100
Sup: 1.1916, 1.1845, 1.1800, 1.1773
Key Things To Watch As We Start A New Trading Week
The Euro made most of the headlines on Friday, after extending gains to a 2.5 year-high and approaching the 1.2 key psychological level. The single currency has appreciated more than 13.4% since the beginning of the year, and many traders were looking for a signal to cover their long Euro positions. However, ECB President Mario Draghi didn't provide this opportunity; failing to touch on the Euro's recent display of strength at Jackson Hole, Mr. Draghi provided investors an opportunity to keep adding to long positions. On the other side, although Fed Chair Janet Yellen seemed optimistic about progress made to reach the full employment and inflation target of 2%, she didn't give away any hints on interest rates or balance sheet reduction. This disappointed dollar bulls who needed further guidance on monetary policy.
U.S. Wage growth remains the missing ingredient
Investors have probably priced in a September 'taper' by the ECB, but the big question remains - will the Euro manage to extend gains from current levels, or will it begin a short-term correction? I believe the answer lies in U.S. data this week. When looking at U.S. bonds behavior, spreads between 2-year and 10-year treasury bonds have been shrinking since 7 July and are currently standing at 0.83 basis points, which is not good news for the greenback. While the flattening yield curve may be partially explained by recent geopolitical tensions and a spike in equity market volatility, inflation expectations remain the key contributor. If inflation expectations remain low, the Fed will find it difficult to tighten monetary policy at the desired pace. That's why U.S. wage growth is the most significant piece of data to watch on Friday.
The U.S. jobs report, due for release on Friday, will likely show a slowdown in job creation. Markets expect 180k jobs to be added to the U.S. economy in August, versus 209k in July and 231k in June. Despite the expected slowdown, the numbers still look healthy. The key focus remains on wage growth; this has been disappointing, with little growth shown over the past two years and remaining flat at 2.5% since April. Expectations are to see a 0.1% uptick for August, but for the yield curve to steepen and convince investors of a third rate hike in December, we need to see wages accelerating further.
Brexit Negotiations
With no tier-one economic data on the calendar and markets in U.K. closed today, Sterling traders are awaiting the results of a new round of talks between the U.K. and the E.U. So far, there are no signs of progress and differing opinions of Brexit Secretary David Davis and his E.U. equivalent Michel Barnier suggest there's a lot to be done to bring both sides into an agreement. Although the pound seems oversold, it is likely to remain under some pressure until positive developments materialize.
Will Gold finally breach $1,300?
The yellow metal is trading slightly higher on Monday, and it seems gold bulls are trying another attempt to break above $1,300. Data from the Commodity Futures Trading Commission showed traders have continued to add long positions as yielding assets, and are still providing very little to encourage investors. However, I think U.S. politics will play a significant role in gold's next move. The debt ceiling and Nafta deal are amongst things to be watched closely. If gold gathers momentum and manages to close the week above $1,300, I believe we'll be seeing another leg higher, with a potential to test 2016 highs, around $1,375.
EUR/USD Analysis: Jumps On Friday
The results of the Jackson Hole symposium can be observed on the charts on Monday. The Euro has skyrocketed against the US Dollar. Both speeches of the ECB and the FED leaders have caused a surge in the currency pair. However, the impact of the speech of Janet Yellen was larger than the one of Mario Draghi.
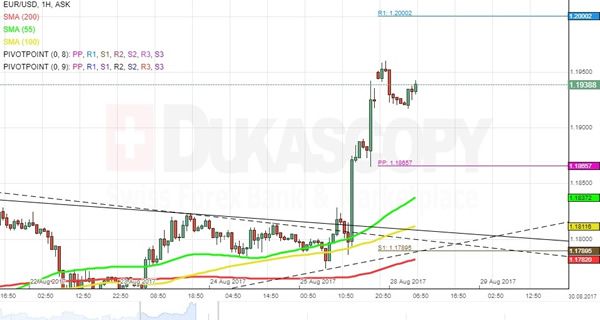
Meanwhile, from a technical perspective it was a perfect break out from the triangle pattern that Dukascopy analysts were talking and writing about constantly. The breakout has occurred to the upside.
In regards to the future situation, it can be expected that the currency rate will reach for the 1.20 mark . However, a full review is required first.
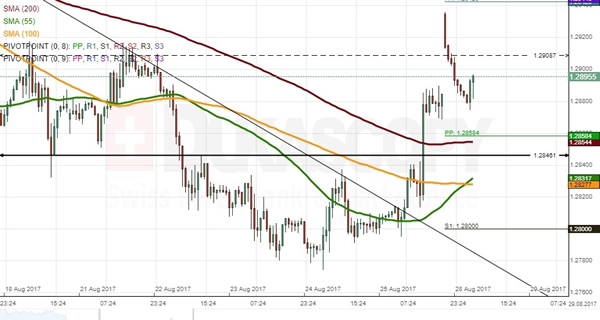
GBP/USD Analysis: Opens Near 1.2940
GBP/USD was driven by strong upside momentum on Friday that resulted in the pair closing at the 1.2886 mark, as sluggish US Durable Goods Orders sent the rate for a 57-pip hourly surge.
The Pound opened at 1.2934 this session just below the monthly S1 and the weekly R1. Ths level, however, was not sustainable, as bears managed to push the pair back to the 1.2880 area by early Monday.
Technical indicators support the rate edging lower. A significant level of support is set by the weekly PP and the 200-hour SMA near 1.2860. As no strong market movers are expected today, the rate should remain between 1.2860/1.2940.
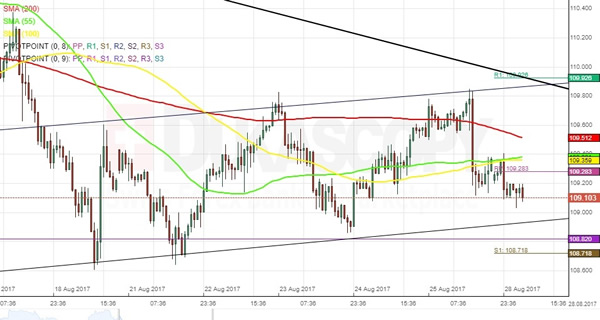
USD/JPY Analysis: Finds Resistance At 55 – And 100-Hour SMAs
The US Dollar was heading towards the 109.08 mark against the Yen prior to being pushed down by sluggish US Durable Goods Orders. The given move resulted in the rate dashing through the 200-, 55– and 100-hour SMAs down to 109.10.
Subsequently, the rate has remained in a relatively stable level between the weekly PP and the monthly S1 in 109.28/108.82.
It is likely that the Greenback tries to appreciate once again towards the 200-hour SMA—a level that should be today's upside limit. On the other hand, the aforementioned monthly S1 together with the weekly S1 circa 108.80 is expected to limit losses for Dollar bulls.
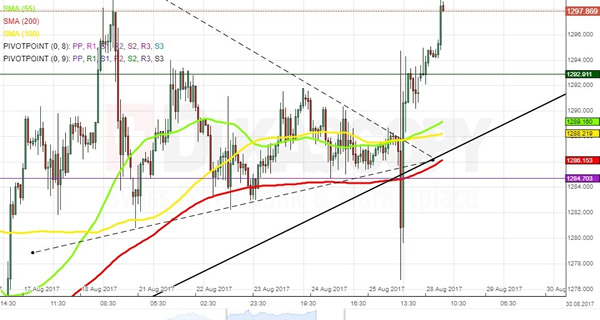
XAU/USD Analysis: Breaks Both Ways
If one had his positions set right, a trader could have cashed in double from the Jackson Hole event in regards to the yellow metal's price.
As soon as the central bankers opened their mouths and started spilling information about global monetary policy in the future, the commodity price started bouncing in a range from 1,276 to 1,295 just during the first hour.
Such move was not initially expected, as it is not consistent with the theory of a triangle pattern, which was active before the event.
However, the end result is a surge, which seems to be unopposed heading once more to reach above the 1,300 mark.
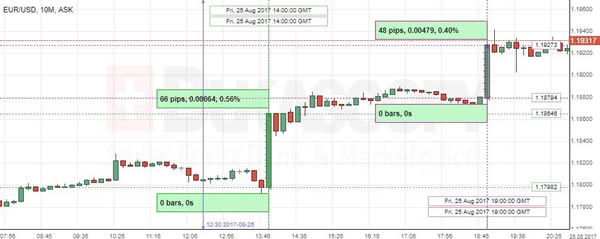
EUR/USD: Durable Goods Orders, Yellen, Draghi
The Commerce Department showed that the US Durable Goods fell 6.8% in July amid weaker demand for commercial jets, while its Core measure marked a better-than-expected gain of 0.5% in the same period.
The US Durable Goods reports on early Friday caused a modest market reaction additionally muted ahead of two economic leaders’ speeches. However, while the Fed Chair Janet Yellen avoided commenting the US Central Bank’s monetary policy, the Greenback weakened against the Euro by 66 pips or 0.56%. Moreover, the EUR/USD jumped again by 48 base points to consolidate near the 1.1927 level following Mr. Draghi, as the markets focused on positive sides of his speech, ignoring notice on growing threats of trade protectionism.
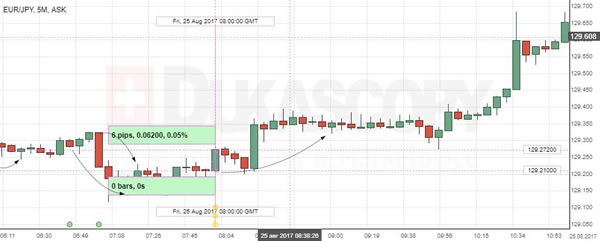
EUR/JPY: German Ifo Business Climate
The Friday report showed that German business sentiment eased slightly in August after reaching three highest levels in a row, resulting in a modest increase in the EUR/JPY currency pair. The Euro gained 6 base points or 0.05% to the 129.27 mark and continued to grow steadily.
The Munich-based Ifo Institute for Economic Research reported that its Business Climate Index edged lower to 115.9 in the reported month, down from the 116.0 registered previously. The German strong economic expansion remained in line with firm GDP growth in the Euro Area. However, the country's businesses were less optimistic about the current situation, suggesting that the economic growth in the largest EU country could reach its peak in the near future.
Forex Technical Analysis: EUR/USD, USD/JPY, GBP/USD
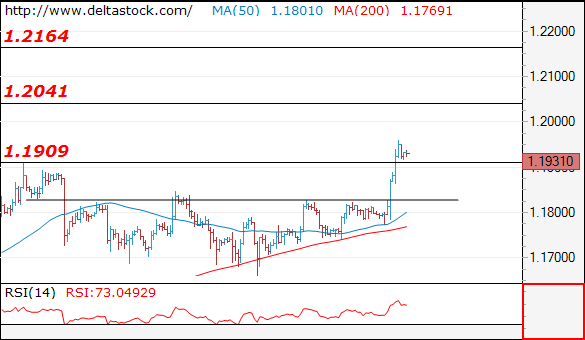
EUR/USD
Current level - 1.1931
Friday's break through 1.1830 static resistance shows, that the prolonged consolidation below 1.1909 is already over and the general uptrend has been renewed, heading towards 1.2040, en route to 1.2160 area. Initial intraday support lies at 1.1909 and crucial on the downside is 1.1830.
| Resistance | Support | ||
| intraday | intraweek | intraday | intraweek |
| 1.1950 | 1.2040 | 1.1909 | 1.1830 |
| 1.2040 | 1.2160 | 1.1830 | 1.1580 |
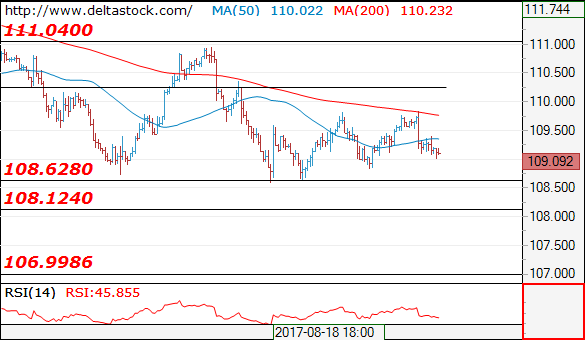
USD/JPY
Current level - 109.09
The outlook here remains bearish, for a slide towards 108.60, en route to 108.10 low. Minor intraday resistance lies at 109.50.
| Resistance | Support | ||
| intraday | intraweek | intraday | intraweek |
| 109.50 | 111.00 | 108.60 | 108.10 |
| 110.30 | 112.20 | 108.10 | 107.00 |
GBP/USD
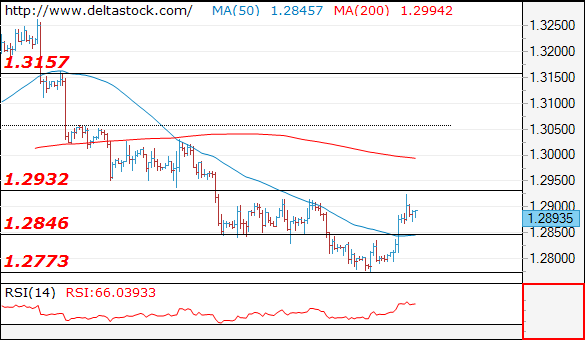
Current level - 1.2893
The low at 1.2773 signals a reversal of the whole downtrend from 1.3260 and the bias is already positive above 1.2846, for a break through 1.2930, towards 1.3050 zone.
| Resistance | Support | ||
| intraday | intraweek | intraday | intraweek |
| 1.2930 | 1.3157 | 1.2846 | 1.2773 |
| 1.3050 | 1.3260 | 1.2773 | 1.2606 |