
Sample Category Title
Gold Neutral Between 1280 And 1300
Gold staged a strong bounce from the key 1280.00 level last Friday. Near-term upside momentum has been maintained as RSI rose above 50 into bullish territory on the 4-hour chart. Looking back since mid-August, gold has been neutral.
If the top of the range at the key psychological level of 1300.00 can be broken, a clear and sustained move above this resistance would open the way to the next major high at 1337.24 (November 2016 peak).
Until then, consolidation between the range-low of 1280.00 and 1300.00 is expected in the short-term. Gold has failed to record a daily close above 1300.00 since November 4, 2016.
A break below 1280.00 would indicate that the upside risk has diminished. The next support level is expected at 1267.25 which prices reached on August 15 and it was also approached a few times. From here there is scope to reach 1251.49 (August 8 low). This is seen as an important level since it is close to the 50% Fibonacci retracement level of the upleg from 1204.79 to 1300.77. A break of this level would increase downside risk and change the current uptrend from 1204.79 on the 4-hour chart.
Overall, there are no clear signals that would indicate a shift from the current neutral phase. The level at the lower end of the range at 1280.00 is expected to offer solid support and is unlikely to yield so easily in the near-term, while 1300.00 remains a strong resistance level.
EURUSD Hits 2 ½-Year High, Bullish After Rising Above 1.19
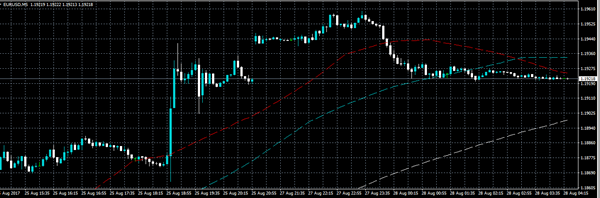
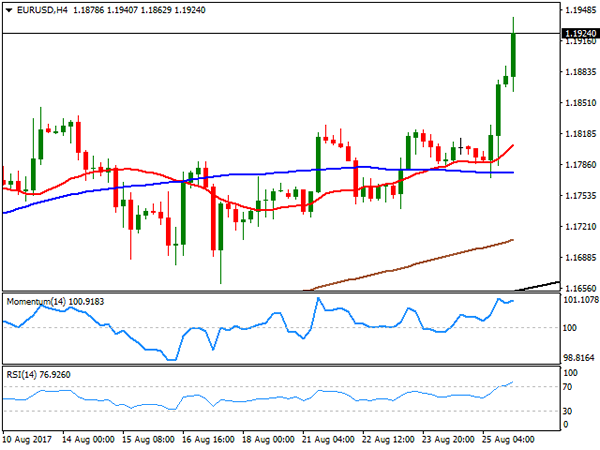
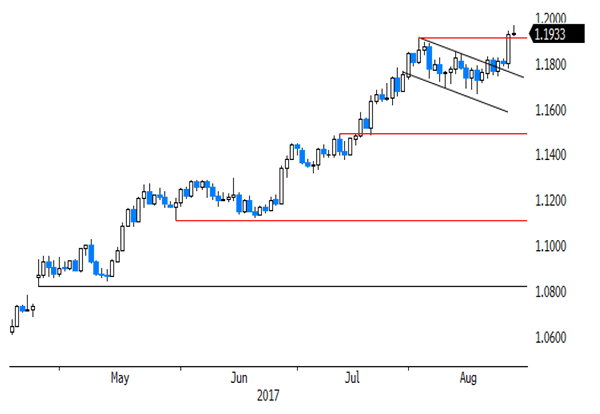
EURUSD hit a fresh 2 1/2 -year high of 1.1959 today. The pair has shifted to bullish from neutral after breaking out of a 3-week consolidation phase between 1.1661 and 1.1900.
What was previously the top of the range and a strong resistance level, the key 1.1900 level is now expected to act as support. There is scope to target the next key round-figure at 1.2000.
But technical studies show that the market is close to being overextended since RSI is approaching 70 (overbought level), suggesting that upside momentum is fading. MACD has turned back down. A correction to the downside cannot be ruled out.
A break below the range-low of 1.1661 would open the way for a more significant decline towards 1.1471, which was tested as both support and resistance recently. A move back below 1.1312 would indicate that the upside bias has weakened since this would result in a more than 50% retracement of the uptrend from 1.0820 to 1.1959. A deeper correction would target major levels at 1.1300 and 1.1100.
Sustained trading above 1.1900 would increase the odds for further upside. A rise above 1.2000 would open the way towards 1.2200.
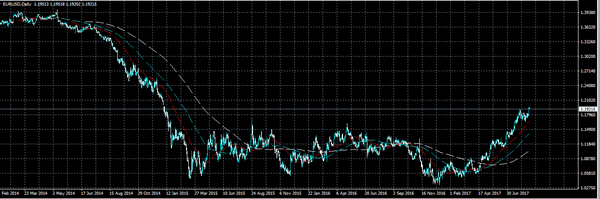
The bullish market structure in the medium-term remains intact and the pair continues to rise within an ascending channel. The crossover of the 50-day above the 200-day moving average on May 23 highlights the bullish picture.

Euro Holds Above 2½-Year High, Oil Prices Mixed In Wake Of Hurricane Harvey
As Asian trading was about to end for the day, the euro managed to hold above the two and a-half-year high, despite being under pressure in early trades. Euro/dollar was last trading at 1.1926, after reaching 1.1940 on Friday, levels last recorded in January 2015. Oil prices surged in early trading but gave up on some of the gains as the Asian session was coming to a close.
The euro came under some pressure during the Asian session, but managed to stay above the $1.19 mark it breached on Friday following European Central Bank President Draghi’s speech. While Mr. Draghi followed his counterpart, Janet Yellen in keeping their lips tight on the monetary policy outlook and focus on the financial regulation instead, the fact that he failed to talk down the single currency down gave euro-bulls more reason for going long. Forex markets welcomed that the ECB Head was neither dovish nor hawkish. This implies critical months ahead as new data gets released and assessed for potential clues of central banks’ moves.
The euro was trading at $1.1926 ahead of the European open, just shy of Friday’s intra-day high of $1.1940. Meanwhile, the dollar extended its losses following Friday’s plunge, with the greenback last trading at 109.09 yen.
The yen gained against the US currency despite the dovish speech by Bank of Japan Governor Haruhiko Kuroda. He pledged that the very accommodative monetary policy would continue “for some time” as the BOJ is far from its inflation target. Mr. Kuroda also made a parallel between the Japanese and US economy, assessing the latter is in a much better situation. This comes as a contrast to the other two key central bankers that kept very silent on their monetary policy stance.
While UK markets are closed for business due to a bank holiday, the UK government is positioning itself for the next round of Brexit talks. David Davis, Brexit secretary, will be in Brussels today calling for “flexibility and imagination” on both sides to make further progress in this process. The latest hold came on discussions around the Northern Ireland border. The pound was under pressure following a spike in Friday’s trading. Pound/dollar was trading at 1.2895 ahead of the Asian close.
In the wake of the weakness in the US currency, both the aussie and kiwi rose and were last trading at $0.7939 and $0.7237, respectively.
Oil prices had a mixed performance ahead of the European session after surging in early trades. As a result of disrupted supply due to Hurricane Harvey in the Gulf of Mexico, WTI surged to $48.20 a barrel and Brent was at $52.84. However, later WTI declined and last traded at $47.63 a barrel, while Brent was still up at $52.42. Different news channels have reported that around 20% of production in the heart of US oil fields has been shut-down, but that the impact on refineries is much bigger and it make take longer for them to come back online. This could create a glut of unrefined crude oil that would weigh on price.
Gold was up on the day and was testing the $1,300 an ounce mark in the wake of the dollar weakness. The precious metal was last trading at $1,297.89.
EURO Touches 1.1960
The EURUSD pair has moved to a new 2017 trading high, hitting 1.1960 during the Asian trading session, as investors continue to react to ECB President Mario Draghi's speech at the Jackson Hole Symposium.
Mario Draghi's failure to address the recent appreciation of the single currency at Jackson Hole, caused the euro to rise sharply. Additionally, Federal Reserve Chair Janet Yellen offered no indication the FED will raise rates in the upcoming September meeting, causing the U.S dollar to fall.
The EURUSD pair has now pulled back towards the 1.1920 region, finding support from the August 2nd price high, at 1.1910.
Intraday technical resistance for the EURUSD is found at the 1.1960, the psychological 1.2000 level, and the 50 percent Fibonacci retracement of the all-time EURUSD price high, to price low, at 1.2030.
Key intraday technical support for the EURUSD is found at the former 2017 price high, at 1.1910, the daily pivot point, at 1.1879, and the key monthly time frame, 50 period moving average, at 1.1860.
GBPUSD Moves Above 1.2900
The GBPUSD pair has moved to a ten-day trading high, hitting 1.2924 during the weekly price open. Sterling's move higher in Asia was provoked by broad-based weakness in the U.S dollar index.
At present, the GBPUSD pair has fallen back below the 1.2900 handle, with price currently trading around the key 1.2875 region, as day traders take profits from over extended levels.
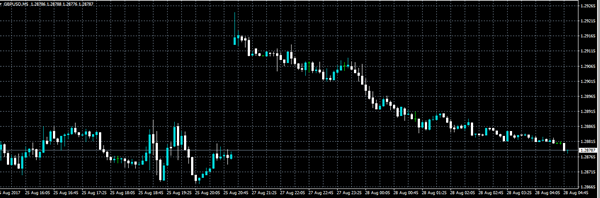
The GBPUSD pair is currently strongly bullish on an intraday basis, but remains bearish in the medium and long-term below the 1.2920 level.
Key intraday technical support is found at the daily and weekly pivot points, converging in the 1.2854-1.2856 region. Below the 1.2854 level, the 1.2932 level offers critical weekly support.
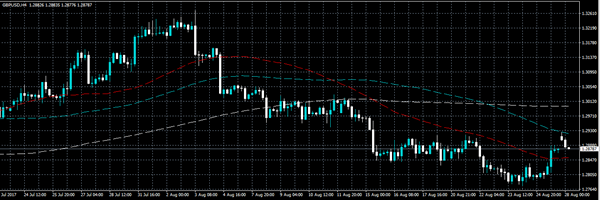
Key intraday technical resistance is found at the 1.2890 level, with the 100-day moving average, acting as critical resistance, at 1.2920.
A move above the 1.2924 level, opens the door for a bullish advancement towards the GBPUSD pairs 50-day moving average, at 1.2982.
US Data Headlines Post-Jackson Hole Session
With the conclusion of the annual Jackson Hole Symposium, investors are once again turning their attention to the economic data. Monday features a relatively light release schedule in comparison with the rest of the week.
The only notable European release occurs at 08:00 GMT when the Italian government reports on consumer confidence and business confidence data. Italy is the Eurozone's third-largest economy in terms of GDP.
In US economic data, the Commerce Department will report on wholesale inventories at 12:30 GMT. The report captures sales and inventory statistics from the second stage of manufacturing.
At the same time, the Commerce Department will report on the July goods trade balance. Trade is a highly contentious issue under the Trump administration, which is looking to rewrite the North American Free Trade Agreement (NAFTA) with Canada and Mexico. NAFTA talks are set to resume early next month.
The Federal Reserve Bank of Dallas will release its manufacturing business index at 14:00 GMT. The report provides a snapshot of regional factory activity.
The economic calendar heats up toward the end of the week, with US nonfarm payrolls making headlines on Friday.
The Jackson Hole Symposium concluded on Saturday with no major headlines. On Friday, Janet Yellen gave what may have been her final Jackson Hole Speech as Federal Reserve chief.
In currencies, the US dollar was down during the Asian session, with the DXY basket falling 0.3%. The greenback is trading at it slowest level of the year.
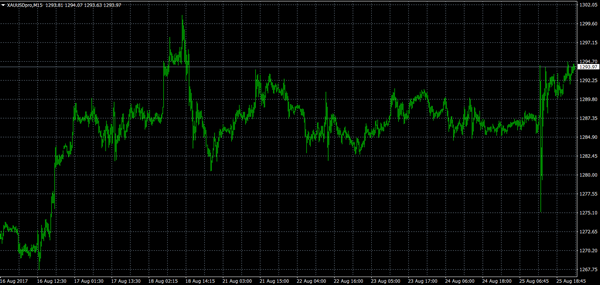
GOLD
Gold prices were well supported at the start of Asian trading, as the market continues to eye the psychological $1,300.00 level. Bullion has benefited from several bouts of risk aversion this month, and its latest uptrend is being supported by a weak US dollar. The yellow metal is bullish, according to the Relative Strength Index (RSI) and MACD.
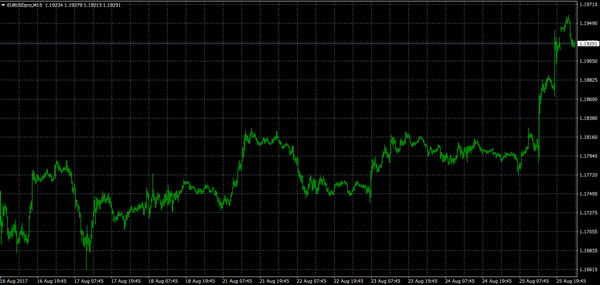
EUR/USD
The euro appears poised to extend its post-Jackson Hole recovery after the EUR/USD spiked more than 100 pips on Friday. The pair is currently trading at 1.1928, where it was little changed compared to the previous close. The EUR/USD faces immediate support at 1.1910, followed by 1.1860. On the opposite side of the ledger, immediate resistance is located at 1.1940. A break above this level would lead to new yearly highs.
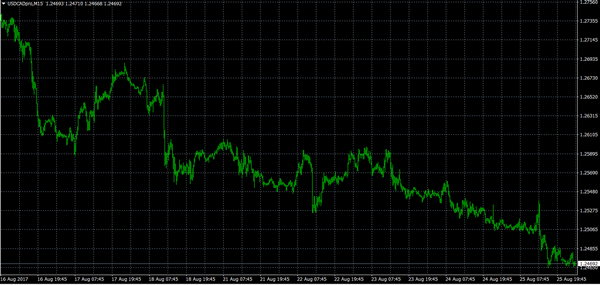
USD/CAD
The US dollar's breakdown following Jackson Hole is clearly reflected in the USD/CAD exchange rate. The pair is trading at nearly one-month lows, having declined more than 300 pips from the mid-August high. The USD/CAD was last seen trading around 1.2470. The greenback is approaching oversold levels relative to the loonie, according to the Relative Strength Index (RSI). This may prompt a short-term correction for the pair.
Harvey To Impact US Economic Growth?
Tropical Storm Harvey caused extensive flooding along the US Gulf coast over the weekend and markets are evaluating the damage caused to US oil refining centers and the impact this will have on crude oil production. The region is home to 25% of US crude oil refining capacity, and some areas are expected to see 12 months' worth of rainfall in the span of a week. Although the full impact of the storm's damage is yet to be determined, the markets expect the impact will be felt globally and affect energy markets for many weeks. Following Hurricane Katrina in 2005, US economic growth dropped by 50% in a Quarter, therefore markets will be closely watching the damage from Harvey and its effect on the US economy.
On Friday, the markets focused on speeches from the Jackson Hole Symposium. ECB President Mario Draghi said 'the central bank's ultra-easy monetary policy was working and the euro zone's economic recovery had taken hold' – such comments helped EUR rise to levels not seen since 2015. The markets were disappointed with Fed Chair Yellen's speech, which focused more on financial stability. The markets had been looking for clues/hints on interest rates and with no information forthcoming sold USD.
EURUSD traded as high as 1.09594 in early Monday trading, before retracing to currently trade at 1.1925.
USDJPY is little changed over the weekend, currently trading around 109.15.
GBPUSD is down 0.3% in early trading. Currently, GBPUSD is trading around 1.2885.
Gold remains firm, up 0.3% in early trading and currently trading near Monday's high of $1,295.63.
WTI, down 0.62% on Monday, will be influenced by news from the US Gulf coast with regards to Tropical Storm Harvey's impact on the region and the US's major refining region. Currently, WTI is trading around $47.80pb.
A relatively quiet day for data releases, today is a UK Bank Holiday, with the only moderately impactful release coming out of the US:
At 15:00 BST, the Federal Reserve Bank of Dallas will release their Manufacturing Business Index for August. The markets will be looking to see another monthly improvement, as the previous general business activity index edged up to 16.8, marking a 10th consecutive positive reading. A strong reading will see USD buying – with the reverse being true for a weak reading.
Houston Flood And Jackson Hole Speeches Economic Impact
Greenback Slides After Janet Yellen's Speech. Markets were disappointed on the Janet Yellen speech last Friday. Traders sold the dollar and pushed bond yields down. The dollar index slid nearly 1% to the 92.4 area continuing its bearish trend. Catastrophic flooding in Houston would likely further weigh on the U.S. dollar as it is a major negative weather event and obviously bad for the economy.
Euro Jumps After ECB's President Speech. The euro climbed to a 2-1/2-year high on Monday after the ECB President Mario Draghi held back from talking down the currency and as markets worried about the impact of Tropical Storm Harvey on the U.S. economy. The euro reached $1.1966, its highest since January 2015.
Gold Rises To 1-Week High. Gold price advanced on Monday to its key resistance levels at US$1,295, extending gains from the previous session, after Federal Reserve Chair Janet Yellen skipped any mention of monetary policy in a speech at a central bankers meeting in Jackson Hole.
Hurricane Harvey Drives Oil Up. Oil prices rose as the dollar fell and as the U.S. petroleum industry braced for Hurricane Harvey, which could become the biggest storm to hit the U.S. mainland in more than a decade.
Foreign Exchange Market Commentary: EUR/USD, USD/JPY, GBP/USD, GOLD, WTI CRUDE, DJIA, FTSE100, DAX
EUR/USD
At the end of a dull trading week, the EUR/USD pair settle at 1.1924, its highest since January 2015, following speeches from Fed´s Yellen and ECB's Draghi, within the Jackson Hole annual Symposium. The American dollar sold off after US Federal Reserve Head focused her speech in defending the post-crisis financial regulation, confronting Trump's view on the matter, whilst the EUR rallied further when Draghi favored free trade, indicating that multilateral cooperation is crucial in responding to concerns about fairness, and that a turn towards protectionism would pose a serious risk for continued productivity growth and potential growth in the global economy. None of them talked monetary policy, yet the rally came anyway, as Yellen was anticipated to define next steps towards normalization, while Draghi started his speech saying that the global recovery is firming up.
The greenback fell across the board, and the negative momentum may extend early into the weekly opening, gapping lower particularly against safe-havens, given that over the weekend, North Korea fired multiple short-range projectiles into sea, usually a risk aversion trigger. The week with start with a holiday in the UK, which may result in limited volumes during European trading hours, exacerbating market's movements.
Having traded as high as 1.1940, the pair broke higher after a consolidative phase, indicating that a continued advance is now likely, supported by technical readings, as in the daily chart, the pair finally detached from a horizontal 20 DMA, whilst technical indicators accelerated north above their mid-lines, maintaining a strong upward momentum heading into the weekly opening. Shorter term, and according to the 4 hours chart, the pair is also biased north, with technical indicators heading higher within overbought territory and the price well above its moving averages. A break above the mentioned high could see the pair extending its gains up to 1.2030 short term, with steady gains beyond this last favoring a continued advance towards the 1.2300 region, during the upcoming days, a major long term resistance.
Support levels: 1.1910 1.1860 1.1820
Resistance levels: 1.1940 1.1985 1.2030
USD/JPY
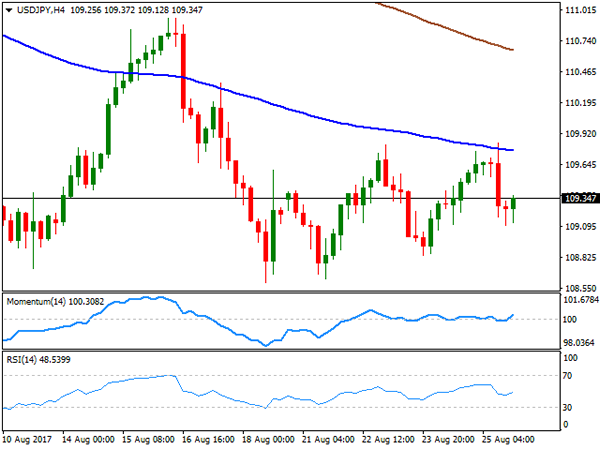
The USD/JPY pair ended the week unchanged at 109.34, a sign of receding JPY demand, despite persistent dollar's weakness, this last fueled on Friday by poor US data and Yellen's speech later on the day. Political uncertainty in the US has also been in the spotlight this past week, resulting in US-Treasury yields ending the week at their lowest in 2-month, with the 10-year note benchmark settling at 2.17% and the 30-year note interest at 2.75%. News over the weekend that North Korea has continued performing military test, this time firing short-range projectiles, may result in the Japanese currency appreciating at the beginning of the week. Over the weekend, BOJ's Kuroda said that the latest pace of growth in Japan is probably unsustainable, indicating also that they plan to maintain the accommodative monetary policy “for some time.” The USD/JPY pair trades in a well-defined range near its August low of 108.59, and the daily chart shows that the price is well below its 100 and 200 DMAs, both gaining downward strength far above the current level, whilst technical indicators remain within negative territory, lacking directional strength, presenting a neutral-to-bearish stance. The 4 hours chart shows that the price retreated from a bearish 100 SMA on Friday, now acting as dynamic resistance around 109.75, while technical indicators aim modestly higher within neutral territory, not enough to confirm an upward extension ahead.
Support levels: 109.00 108.60 108.15
Resistance levels: 109.75 110.10 110.45
GBP/USD
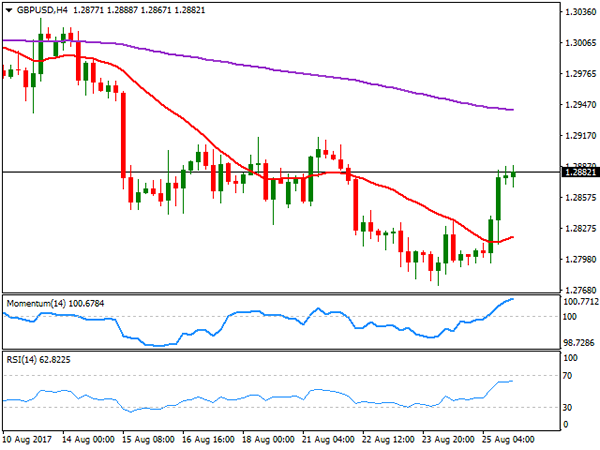
The British Pound closed the week with a strong note against the greenback at 1.2882, getting a boost early US session by soft US Durable Goods Orders data released early Friday, further fueled by Yellen's comments at Jackson Hole, seen as dollar-negative as she avoided discussing monetary policy, while challenged Trump and his economic chief Gary Cohn, who are planning to take down the Dodd Frank regulations put in place after the latest US financial crisis. Cohn sounds loud as the one to replace Yellen when her term ends this year. The strong Friday's advance in the GBP/USD pair was just enough to revert early weekly losses, with the pair ending it pretty much flat, as investors are cautious ahead of the next round of Brexit negotiations starting this week. The UK prepared some papers to clarify his stance over different matters, which were saw as an encouraging sign by markets, but on Friday, UK's foreign minister Boris Johnson said that Britain will pay “not a penny more, not a penny less” than what the government thinks its legal obligations are to the EU, denting demand for Pound. Technically, the latest advance seems just corrective, as in the daily chart, the pair remains well below a strongly bearish 20 DMA, whilst technical indicators have recovered within bearish territory, with limited upward potential at the time being. Additionally, the pair stalled below the 1.2920/30 region, where selling interest has contained advances for over a week. In the 4 hours chart, the pair settled above a modestly bullish 20 SMA, while technical indicators entered bullish territory, but lost upward strength as the price was unable to surpass the mentioned critical resistance.
Support levels: 1.2850 1.2810 1.2770
Resistance levels: 1.2930 1.2965 1.3000
GOLD
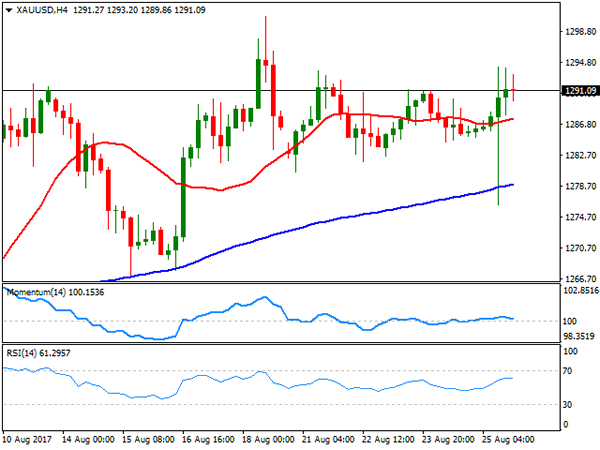
Gold prices saw some wild price action ahead of Yellen's speech last Friday, falling down to $1,276.32 a troy ounce ahead of the event, as investors were waiting for a more hawkish stance from the US Federal Reserve's head, changing course afterwards to end the week marginally higher at $,1291.09 a troy ounce. Nevertheless, the commodity was unable to regain the 1,300.00 critical threshold, as despite seen as dovish, Yellen didn't provide hints on upcoming monetary policy. From a technical point of view, the daily chart shows that the bright metal met buying interest around its 20 DMA that maintains its bullish slope far above the 100 and 200 DMAs. In the same chart, the Momentum indicator heads lower within positive territory, while the RSI hovers around 60, with no certain directional strength, all of which indicates that the risk is towards the upside, but further gains would need additional technical confirmations. In the 4 hours chart, the technical picture is neutral-to-bullish, as the price settled above all of its moving averages, but with the 20 SMA horizontal amid the lack of directional strength seen over this past week, while technical indicators head nowhere, the Momentum around its 100 level and the RSI around 61.
Support levels: 1,288.10 1,280.55 1,273.95
Resistance levels: 1,294.25 1,300.90 1,309.25
WTI CRUDE OIL
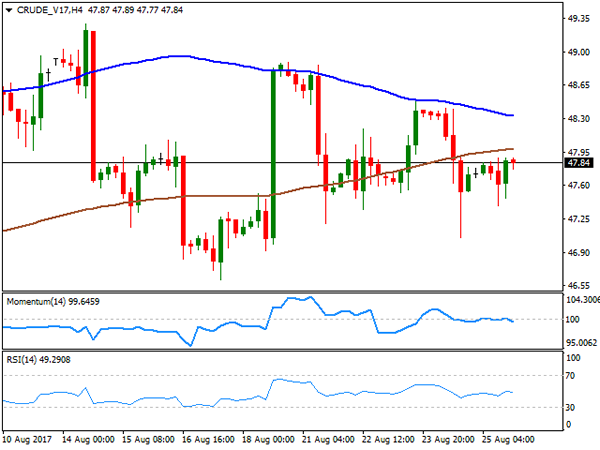
West Texas Intermediate crude oil futures closed modestly higher on Friday at $47.84 a barrel, down, however, for a fourth consecutive week. Friday's advance came as a consequence of broad dollar's weakness and a decline in the US rig count, as according to Baker Hughes, the number of rigs drilling for oil fell by 4 to 759. Also affecting oil prices is the hurricane Harvey hitting the Gulf Coast, which is home to nearly half of U.S. refining capacity. Speculative interest anticipates declining demand for crude at refineries for the upcoming days, which may end up sending prices lower. The commodity held within its early weekly range, still at risk of easing according to technical readings in the daily chart, as indicators remain within bearish territory, with the Momentum presenting a bearish slope but the RSI consolidating around 48. In the same chart, the 100 DMA has acted as dynamic support, attracting buying interest and currently at 47.30, a few cents above the weekly low of 47.05. In the 4 hours chart, the price settled below its moving averages, whilst technical indicators turned marginally lower within neutral territory, not enough to confirm a bearish extension, but leaning the scale towards the downside anyway.
Support levels: 47.05 46.60 46.00
Resistance levels: 47.90 48.50 49.10
DJIA
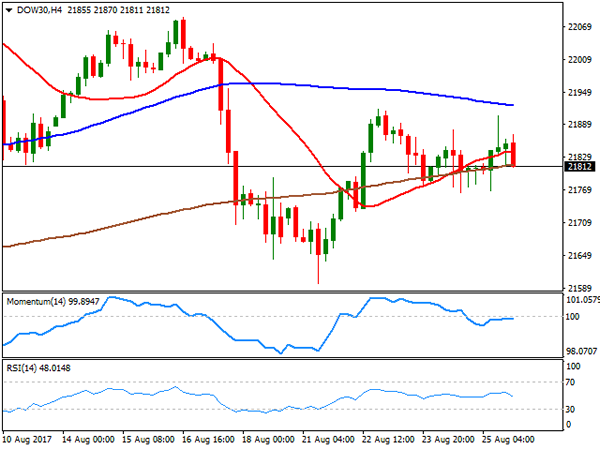
US indexes closed mixed on Friday, with the DJIA up for the day 30 points, to end at 21,813.67, also up for the week. The S&P added 4 points and closed at 2,443.05, but the Nasdaq Composite shed 0.09%, ending the week at 6,265.64. Investors will focus on the long-promised US tax reform this week, as Trump's chief economic advisor, Gary Cohn, said that the US president will begin calling for it next Wednesday in Missouri. If the tax reform ends at good port, stocks will likely rally to fresh record highs. Most Dow members closed up on Friday, with Home Depot leading gainers with a 0.94% gain, followed by Walt Disney that added 0.88%. Boeing was the worst performer, down 1.19%, with Goldman Sachs ending also in the red, down 0.23%. In the meantime, the upward potential remains limited for the index as the intraday advance was again contained by selling interest around a marginally bearish 20 DMA, whilst in the daily chart, technical indicators consolidate below their mid-lines. Shorter term, and according to the 4 hours chart, the index presents a neutral-to-bearish stance, with the benchmark stuck around its 200 SMA but below the 20 and 100 SMAs, and with technical indicators also holding right below their mid-lines, but with limited directional strength.
Support levels: 21,764 21,725 21,672
Resistance levels: 21,836 21,862 21,900
FTSE100
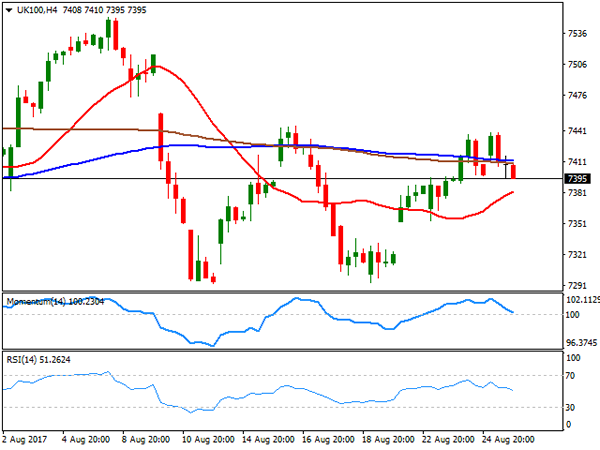
The FTSE 100 ended 5 points lower at 7,401.46 on Friday, weighed by a resurgent Pound following Yellen's speech right ahead of the close. Equities traded choppily in Europe ahead of the key speeches from Fed and ECB's heads, with most members closing down in London, albeit a sharp recovery in Provident Financial, offset most of the losses. The company added 22.46%, its third consecutive large advance after plummeting over 66% on Tuesday, after announcing changes in the management of its consumer credit division. Materials CRH led decliners, down 2.61%, followed by Paddy Power Betfair that lost 2.02%. Technically, the daily chart shows that the index was unable to settle above its 20 and 100 SMAs, both converging horizontally within a tight range, while the RSI indicator consolidates within neutral territory, but the Momentum heads south below its mid-line, all of which favors a leg lower for this upcoming sessions. In the 4 hours chart, the index is above a bullish 20 SMA, while technical indicators have turned south, now pressuring their mid-lines, also favoring a downward extension to be confirmed on a bearish acceleration through 7,380, the immediate support.
Support levels: 7,380 7,353 7,309
Resistance levels: 7,412 7,444 7,482
DAX
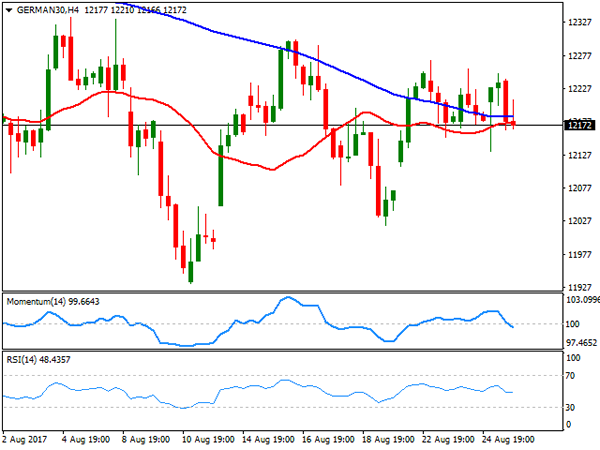
European indexes swung between small gains and losses Friday, as investors geared up for Draghi and Yellen's speeches, ending up mostly with marginal losses. The German DAX closed at 12,167.90, down 12 points on the day, and barely up for the week. Financial-related equities were among the best performers through the region, with Deutsche Boerse leading gaining in Germany, up 1.16%, followed by Merck which added 1.10%. Deutsche Post, on the other hand, led decliners with a 1.21% loss, followed by Deutsche Telekom that shed 0.75%. The index may come under pressure early Europe, given EUR's appreciation late Friday, amid market's conviction that the ECB is getting ready to announce tapering. From a technical point of view, the daily chart shows that the index continues trading around a flat 20 DMA, but between the 100 and 200 DMAs, whilst technical indicators lack directional strength, holding right below their mid-lines, poising a limited downward risk. In the 4 hours chart, the index settled a few points below its 20 and 100 SMAs, while technical indicators barely entered negative territory with firm downward slopes, also favoring a downward extension for this Monday, particularly on a break below 12,132, Friday's low and the immediate support.
Support levels: 12,132 12,099 12,065
Resistance levels: 12,222 12,263 12,301
Currencies: EUR/USD Extends Gains As Draghi Stays Muted On Recent Strength
Sunrise Market Commentary
- Rates: US eco data are key this week
The Jackson Hole meeting turned out to be a non-event with markets now looking to this week's US eco data to get trading guidance. The calendar is back-loaded, suggesting a slow start today. US Hurricane Harvey left no traces on markets with Brent crude stable around $52.5/barrel. The US Treasury's supply operation could weigh on US Treasuries. - Currencies: EUR/USD extends gains as Draghi stays muted on recent strength
Yellen and Draghi didn't bring any news on monetary policy last Friday. However, markets interpreted it as a 'Nihil obstat' to further sell the dollar and buy the euro. Today, the eco calendar is thin. Especially the price data in the EMU and the US later this week might by key for EUR/USD trading. Is enough bad news for the dollar discounted?
The Sunrise Headlines
- US equities closed the final session of last week's trading mixed with a small outperformance of the Dow Jones. Overnight, most Asian equity indices trade positive with China outperforming.
- Theresa May is facing renewed pressure from her own party over Brexit after Labour announced it would change tack and campaign to keep Britain in the EU single market, at least during a transitional period.
- The ECB's ultra-easy monetary policy is working and the euro zone's economic recovery has taken hold even if more time is needed to lift inflation to the bank's 2% target, ECB President Draghi said on Friday in Jackson Hole.
- Earnings growth for China's industrial firms cooled in July after accelerating for three straight months, reinforcing expectations the economy will slow over coming quarters as higher lending costs and property market curbs bite.
- China's central bank raised its official yuan midpoint to 6.6353 per dollar, the strongest level since Aug. 19, 2016, reflecting broad weakness in the US currency in global markets.
- Houston and surrounding areas faced epic flooding and more days of heavy rain from Tropical Storm Harvey, which turned freeways and roads into rivers, inundated homes and required rescues for thousands of stranded people.
- Today's eco calendar contains EMU M3 money supply data and the US trade balance. The US Treasury starts its end-of-refinancing operation with a $26B 2-yr Note and a $34B 5-yr Note auction.
Currencies: EUR/USD Extends Gains As Draghi Stays Muted On Recent Strength
EUR/USD up as Draghi is muted on EUR strength
On Friday, the speeches of Fed's Yellen and of ECB's Draghi at Jackson Hole didn't bring any concrete news on monetary policy. The focus was on the appropriate level of financial regulation and on free trade. Even so, currency markets still reacted to what wasn't said. Yellen stayed muted on the timing of further US rate hikes and ECB's Draghi didn't give an open warning on the recent rise of the euro. Especially the latter was considered as a 'nihil obstat' for further euro gains. EUR/USD set a correction top north of 1.19 and closed the week at 1.1924. USD/JPY also dropped off the intraday highs and finished the session at 109.36.
Overnight, Asian equities trade mixed to slightly higher. Japanese indices are little changed as USD/JPY returned to the low 109 area post-Jackson Hole. The PBOC set the fixing of USD/CNY at the strongest level for the yuan since August last year. The dollar remains in the defensive across the board. The trade-weighted dollar trades in the 92, 50 area. EUR/USD remains well bid and trades in the 1.1920 area.
The economic calendar is thin today. In EMU, the M3 money supply is expected marginally lower for July (4.9% Y/Y from 5% Y/Y). We look whether the growth continues to recover. However, markets usually ignore the M3 release. In the US, the inventory and the trade balance figures for July are interesting for fine-tuning the early estimates of Q3 GDP. However, we expect it only to be of intraday significance. Investors will look forward to a series of important eco data in EMU (CPI) and the US (consumer confidence, PCE deflators, payrolls) later this week. Markets will look for confirmation that recent good US eco data might allow the Fed to continue its path of gradual rate hikes. The fiscal plans of the Trump administration, unveiled later this week, are a wildcard for USD trading. In a day-to-day perspective dollar sentiment clearly remains fragile. Friday's reaction of the dollar and the euro told more about underlying market sentiment than on content of the speeches of Draghi and Yellen. For now, there is no indication that a the dollar decline/euro rally will halt right now. However, Friday's jump in EUR/USD occurred even as changes in interest rate differentials remained very limited. This kind of divergence between interest and FX markets can't continue for ever. We also look out for more outspoken comments from ECB members on the recent euro rally and on its impact on inflation and monetary policy .
Broader context and technical picture. Late June, EUR/USD started a new up-leg as investors anticipated a reduction of ECB bond buying. The Fed was expected to remove policy stimulation only in a very gradual way as US inflation remains soft. Uncertainty on the policy of the Trump administration was a secondary negative factor for the dollar. EUR/USD set a new correction top north of 1.19 before consolidating in a narrow 1.1662/1.1910 range. The top of this range is now again under severe strain post Jackson hole. The day-to-day momentum remains euro positive. However, we assume that the EUR/USD rebound has gone far enough if the recent improvement in USD eco will be confirmed. A return of EUR/USD to the 1.15/16 area is possible. Pockets of US political risk are a (negative) wildcard for the dollar.
A downward correction in core (US and European) yields supported the yen in August. USD/JPY declined from mid-114 mid-July to 108.60. The April correction low (108.13) remains the line in the sand. For now, this level won't be easy to break as quite some USD bad news is discounted after the recent protracted setback. A cautious buy-on-dips approach (with stop-loss protection below 108) may be considered.
EUR/USD: 'by default' euro buying persists
EUR/GBP
EUR/GBP rally resumes on euro strength
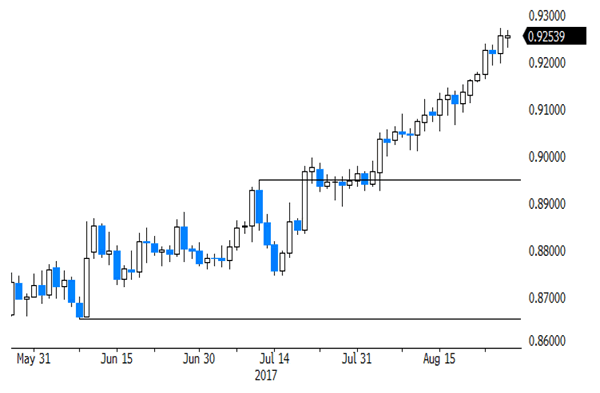
Sterling trading was order-driven in absence of eco releases. There was again a lot political position talking ahead of this week's new round of the Brexit-talks. EUR/GBP initially hovered in the 0.92 area, but jumped higher in lockstep with the rise of EUR/USD after the speeches of Yellen at Jackson hole. EUR/GBP finished the session at 0.9255. At the same time, cable also profited from the USD decline and finished the session at 1.2882.
There are again no UK data today. So, FX traders will focus on the start of the third round of Brexit negotiations. The focus remains on the separation issues rather than on the cooperation between the two blocks in the post-Brexit era. In theory , this should be negative for sterling. However, we have the impression that the UK negotiators are turning less strict. For now, this didn't help sterling. Even so, especially the EUR/GBP cross rate already discounts a lot UK negative news. We look for a signal that the rally has run its course.
From a technical point of view, EUR/GBP cleared 0.8854/80 resistance (top end June), opening the way for further gains. The move was the result of euro strength (strong EMU data and expectations of APP tapering). Simultaneously, UK price data were soft enough to keep the BoE side-lined as the Brexit negotiations continue. MT, we maintain a buy EUR/GBP on dips approach as we expect the combination of relative euro strength and sterling softness to persist. The 0.9415 'flash-crash spike' is the next target on the charts. However, we don't jump on the up-trend anymore after the recent rally and wait for a correction, e.g. to the technical support in the 0.88/89 area.
EUR/GBP: rally resumes on Euro strength