
Sample Category Title
EUR/JPY: German Ifo Business Climate
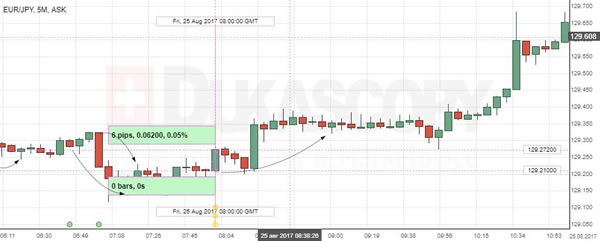
The Friday report showed that German business sentiment eased slightly in August after reaching three highest levels in a row, resulting in a modest increase in the EUR/JPY currency pair. The Euro gained 6 base points or 0.05% to the 129.27 mark and continued to grow steadily.
The Munich-based Ifo Institute for Economic Research reported that its Business Climate Index edged lower to 115.9 in the reported month, down from the 116.0 registered previously. The German strong economic expansion remained in line with firm GDP growth in the Euro Area. However, the country's businesses were less optimistic about the current situation, suggesting that the economic growth in the largest EU country could reach its peak in the near future.
Forex Technical Analysis: EUR/USD, USD/JPY, GBP/USD
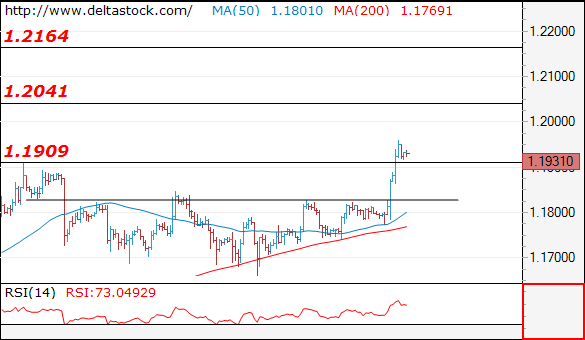
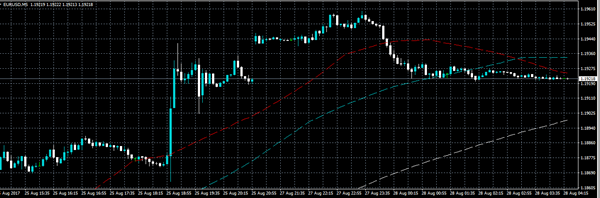
EUR/USD
Current level - 1.1931
Friday's break through 1.1830 static resistance shows, that the prolonged consolidation below 1.1909 is already over and the general uptrend has been renewed, heading towards 1.2040, en route to 1.2160 area. Initial intraday support lies at 1.1909 and crucial on the downside is 1.1830.
| Resistance | Support | ||
| intraday | intraweek | intraday | intraweek |
| 1.1950 | 1.2040 | 1.1909 | 1.1830 |
| 1.2040 | 1.2160 | 1.1830 | 1.1580 |
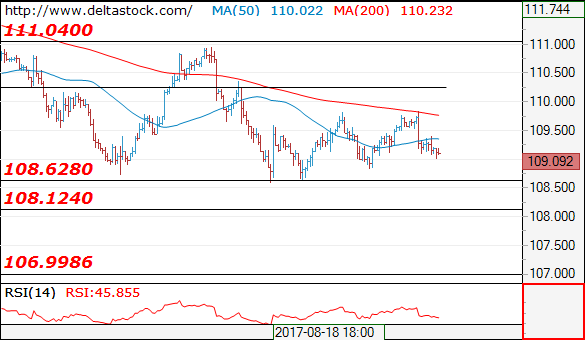
USD/JPY
Current level - 109.09
The outlook here remains bearish, for a slide towards 108.60, en route to 108.10 low. Minor intraday resistance lies at 109.50.
| Resistance | Support | ||
| intraday | intraweek | intraday | intraweek |
| 109.50 | 111.00 | 108.60 | 108.10 |
| 110.30 | 112.20 | 108.10 | 107.00 |
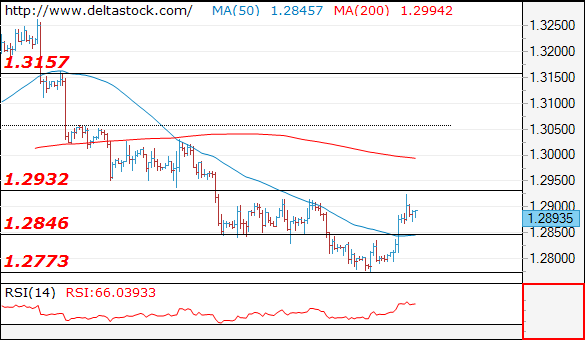
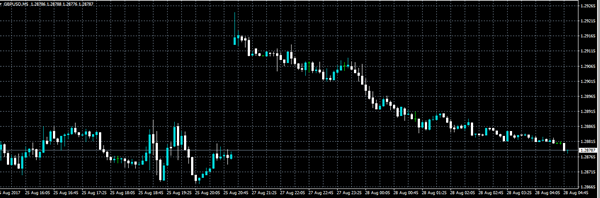
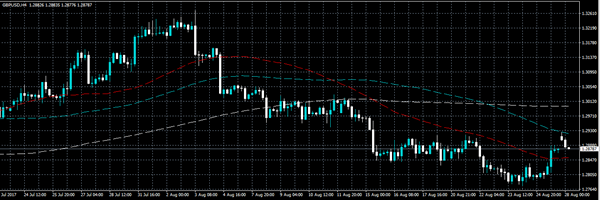
GBP/USD
Current level - 1.2893
The low at 1.2773 signals a reversal of the whole downtrend from 1.3260 and the bias is already positive above 1.2846, for a break through 1.2930, towards 1.3050 zone.
| Resistance | Support | ||
| intraday | intraweek | intraday | intraweek |
| 1.2930 | 1.3157 | 1.2846 | 1.2773 |
| 1.3050 | 1.3260 | 1.2773 | 1.2606 |
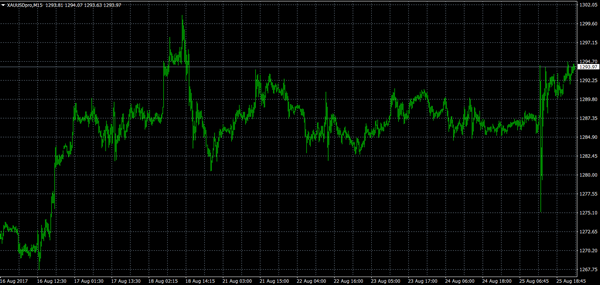
Gold Neutral Between 1280 And 1300
Gold staged a strong bounce from the key 1280.00 level last Friday. Near-term upside momentum has been maintained as RSI rose above 50 into bullish territory on the 4-hour chart. Looking back since mid-August, gold has been neutral.
If the top of the range at the key psychological level of 1300.00 can be broken, a clear and sustained move above this resistance would open the way to the next major high at 1337.24 (November 2016 peak).
Until then, consolidation between the range-low of 1280.00 and 1300.00 is expected in the short-term. Gold has failed to record a daily close above 1300.00 since November 4, 2016.
A break below 1280.00 would indicate that the upside risk has diminished. The next support level is expected at 1267.25 which prices reached on August 15 and it was also approached a few times. From here there is scope to reach 1251.49 (August 8 low). This is seen as an important level since it is close to the 50% Fibonacci retracement level of the upleg from 1204.79 to 1300.77. A break of this level would increase downside risk and change the current uptrend from 1204.79 on the 4-hour chart.
Overall, there are no clear signals that would indicate a shift from the current neutral phase. The level at the lower end of the range at 1280.00 is expected to offer solid support and is unlikely to yield so easily in the near-term, while 1300.00 remains a strong resistance level.
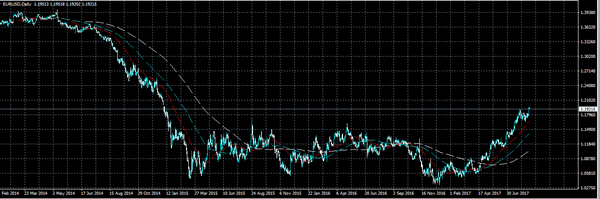
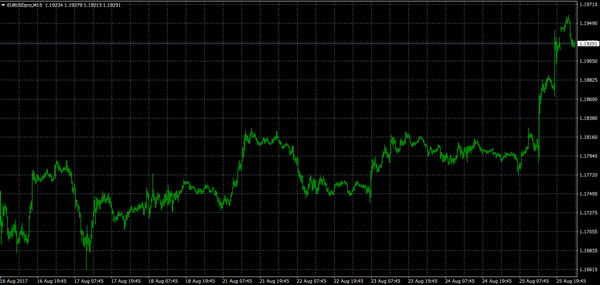
EURUSD Hits 2 ½-Year High, Bullish After Rising Above 1.19
EURUSD hit a fresh 2 1/2 -year high of 1.1959 today. The pair has shifted to bullish from neutral after breaking out of a 3-week consolidation phase between 1.1661 and 1.1900.
What was previously the top of the range and a strong resistance level, the key 1.1900 level is now expected to act as support. There is scope to target the next key round-figure at 1.2000.
But technical studies show that the market is close to being overextended since RSI is approaching 70 (overbought level), suggesting that upside momentum is fading. MACD has turned back down. A correction to the downside cannot be ruled out.
A break below the range-low of 1.1661 would open the way for a more significant decline towards 1.1471, which was tested as both support and resistance recently. A move back below 1.1312 would indicate that the upside bias has weakened since this would result in a more than 50% retracement of the uptrend from 1.0820 to 1.1959. A deeper correction would target major levels at 1.1300 and 1.1100.
Sustained trading above 1.1900 would increase the odds for further upside. A rise above 1.2000 would open the way towards 1.2200.
The bullish market structure in the medium-term remains intact and the pair continues to rise within an ascending channel. The crossover of the 50-day above the 200-day moving average on May 23 highlights the bullish picture.

Euro Holds Above 2½-Year High, Oil Prices Mixed In Wake Of Hurricane Harvey
As Asian trading was about to end for the day, the euro managed to hold above the two and a-half-year high, despite being under pressure in early trades. Euro/dollar was last trading at 1.1926, after reaching 1.1940 on Friday, levels last recorded in January 2015. Oil prices surged in early trading but gave up on some of the gains as the Asian session was coming to a close.
The euro came under some pressure during the Asian session, but managed to stay above the $1.19 mark it breached on Friday following European Central Bank President Draghi’s speech. While Mr. Draghi followed his counterpart, Janet Yellen in keeping their lips tight on the monetary policy outlook and focus on the financial regulation instead, the fact that he failed to talk down the single currency down gave euro-bulls more reason for going long. Forex markets welcomed that the ECB Head was neither dovish nor hawkish. This implies critical months ahead as new data gets released and assessed for potential clues of central banks’ moves.
The euro was trading at $1.1926 ahead of the European open, just shy of Friday’s intra-day high of $1.1940. Meanwhile, the dollar extended its losses following Friday’s plunge, with the greenback last trading at 109.09 yen.
The yen gained against the US currency despite the dovish speech by Bank of Japan Governor Haruhiko Kuroda. He pledged that the very accommodative monetary policy would continue “for some time” as the BOJ is far from its inflation target. Mr. Kuroda also made a parallel between the Japanese and US economy, assessing the latter is in a much better situation. This comes as a contrast to the other two key central bankers that kept very silent on their monetary policy stance.
While UK markets are closed for business due to a bank holiday, the UK government is positioning itself for the next round of Brexit talks. David Davis, Brexit secretary, will be in Brussels today calling for “flexibility and imagination” on both sides to make further progress in this process. The latest hold came on discussions around the Northern Ireland border. The pound was under pressure following a spike in Friday’s trading. Pound/dollar was trading at 1.2895 ahead of the Asian close.
In the wake of the weakness in the US currency, both the aussie and kiwi rose and were last trading at $0.7939 and $0.7237, respectively.
Oil prices had a mixed performance ahead of the European session after surging in early trades. As a result of disrupted supply due to Hurricane Harvey in the Gulf of Mexico, WTI surged to $48.20 a barrel and Brent was at $52.84. However, later WTI declined and last traded at $47.63 a barrel, while Brent was still up at $52.42. Different news channels have reported that around 20% of production in the heart of US oil fields has been shut-down, but that the impact on refineries is much bigger and it make take longer for them to come back online. This could create a glut of unrefined crude oil that would weigh on price.
Gold was up on the day and was testing the $1,300 an ounce mark in the wake of the dollar weakness. The precious metal was last trading at $1,297.89.
EURO Touches 1.1960
The EURUSD pair has moved to a new 2017 trading high, hitting 1.1960 during the Asian trading session, as investors continue to react to ECB President Mario Draghi's speech at the Jackson Hole Symposium.
Mario Draghi's failure to address the recent appreciation of the single currency at Jackson Hole, caused the euro to rise sharply. Additionally, Federal Reserve Chair Janet Yellen offered no indication the FED will raise rates in the upcoming September meeting, causing the U.S dollar to fall.
The EURUSD pair has now pulled back towards the 1.1920 region, finding support from the August 2nd price high, at 1.1910.
Intraday technical resistance for the EURUSD is found at the 1.1960, the psychological 1.2000 level, and the 50 percent Fibonacci retracement of the all-time EURUSD price high, to price low, at 1.2030.
Key intraday technical support for the EURUSD is found at the former 2017 price high, at 1.1910, the daily pivot point, at 1.1879, and the key monthly time frame, 50 period moving average, at 1.1860.
GBPUSD Moves Above 1.2900
The GBPUSD pair has moved to a ten-day trading high, hitting 1.2924 during the weekly price open. Sterling's move higher in Asia was provoked by broad-based weakness in the U.S dollar index.
At present, the GBPUSD pair has fallen back below the 1.2900 handle, with price currently trading around the key 1.2875 region, as day traders take profits from over extended levels.
The GBPUSD pair is currently strongly bullish on an intraday basis, but remains bearish in the medium and long-term below the 1.2920 level.
Key intraday technical support is found at the daily and weekly pivot points, converging in the 1.2854-1.2856 region. Below the 1.2854 level, the 1.2932 level offers critical weekly support.
Key intraday technical resistance is found at the 1.2890 level, with the 100-day moving average, acting as critical resistance, at 1.2920.
A move above the 1.2924 level, opens the door for a bullish advancement towards the GBPUSD pairs 50-day moving average, at 1.2982.
US Data Headlines Post-Jackson Hole Session
With the conclusion of the annual Jackson Hole Symposium, investors are once again turning their attention to the economic data. Monday features a relatively light release schedule in comparison with the rest of the week.
The only notable European release occurs at 08:00 GMT when the Italian government reports on consumer confidence and business confidence data. Italy is the Eurozone's third-largest economy in terms of GDP.
In US economic data, the Commerce Department will report on wholesale inventories at 12:30 GMT. The report captures sales and inventory statistics from the second stage of manufacturing.
At the same time, the Commerce Department will report on the July goods trade balance. Trade is a highly contentious issue under the Trump administration, which is looking to rewrite the North American Free Trade Agreement (NAFTA) with Canada and Mexico. NAFTA talks are set to resume early next month.
The Federal Reserve Bank of Dallas will release its manufacturing business index at 14:00 GMT. The report provides a snapshot of regional factory activity.
The economic calendar heats up toward the end of the week, with US nonfarm payrolls making headlines on Friday.
The Jackson Hole Symposium concluded on Saturday with no major headlines. On Friday, Janet Yellen gave what may have been her final Jackson Hole Speech as Federal Reserve chief.
In currencies, the US dollar was down during the Asian session, with the DXY basket falling 0.3%. The greenback is trading at it slowest level of the year.
GOLD
Gold prices were well supported at the start of Asian trading, as the market continues to eye the psychological $1,300.00 level. Bullion has benefited from several bouts of risk aversion this month, and its latest uptrend is being supported by a weak US dollar. The yellow metal is bullish, according to the Relative Strength Index (RSI) and MACD.
EUR/USD
The euro appears poised to extend its post-Jackson Hole recovery after the EUR/USD spiked more than 100 pips on Friday. The pair is currently trading at 1.1928, where it was little changed compared to the previous close. The EUR/USD faces immediate support at 1.1910, followed by 1.1860. On the opposite side of the ledger, immediate resistance is located at 1.1940. A break above this level would lead to new yearly highs.
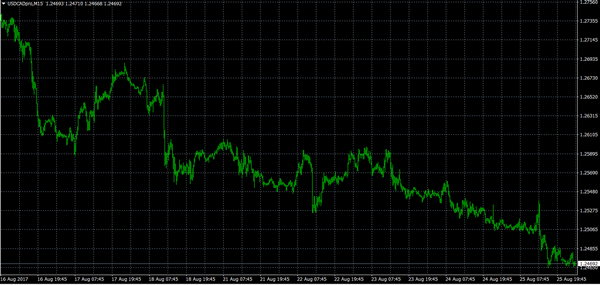
USD/CAD
The US dollar's breakdown following Jackson Hole is clearly reflected in the USD/CAD exchange rate. The pair is trading at nearly one-month lows, having declined more than 300 pips from the mid-August high. The USD/CAD was last seen trading around 1.2470. The greenback is approaching oversold levels relative to the loonie, according to the Relative Strength Index (RSI). This may prompt a short-term correction for the pair.
Harvey To Impact US Economic Growth?
Tropical Storm Harvey caused extensive flooding along the US Gulf coast over the weekend and markets are evaluating the damage caused to US oil refining centers and the impact this will have on crude oil production. The region is home to 25% of US crude oil refining capacity, and some areas are expected to see 12 months' worth of rainfall in the span of a week. Although the full impact of the storm's damage is yet to be determined, the markets expect the impact will be felt globally and affect energy markets for many weeks. Following Hurricane Katrina in 2005, US economic growth dropped by 50% in a Quarter, therefore markets will be closely watching the damage from Harvey and its effect on the US economy.
On Friday, the markets focused on speeches from the Jackson Hole Symposium. ECB President Mario Draghi said 'the central bank's ultra-easy monetary policy was working and the euro zone's economic recovery had taken hold' – such comments helped EUR rise to levels not seen since 2015. The markets were disappointed with Fed Chair Yellen's speech, which focused more on financial stability. The markets had been looking for clues/hints on interest rates and with no information forthcoming sold USD.
EURUSD traded as high as 1.09594 in early Monday trading, before retracing to currently trade at 1.1925.
USDJPY is little changed over the weekend, currently trading around 109.15.
GBPUSD is down 0.3% in early trading. Currently, GBPUSD is trading around 1.2885.
Gold remains firm, up 0.3% in early trading and currently trading near Monday's high of $1,295.63.
WTI, down 0.62% on Monday, will be influenced by news from the US Gulf coast with regards to Tropical Storm Harvey's impact on the region and the US's major refining region. Currently, WTI is trading around $47.80pb.
A relatively quiet day for data releases, today is a UK Bank Holiday, with the only moderately impactful release coming out of the US:
At 15:00 BST, the Federal Reserve Bank of Dallas will release their Manufacturing Business Index for August. The markets will be looking to see another monthly improvement, as the previous general business activity index edged up to 16.8, marking a 10th consecutive positive reading. A strong reading will see USD buying – with the reverse being true for a weak reading.
Houston Flood And Jackson Hole Speeches Economic Impact
Greenback Slides After Janet Yellen's Speech. Markets were disappointed on the Janet Yellen speech last Friday. Traders sold the dollar and pushed bond yields down. The dollar index slid nearly 1% to the 92.4 area continuing its bearish trend. Catastrophic flooding in Houston would likely further weigh on the U.S. dollar as it is a major negative weather event and obviously bad for the economy.
Euro Jumps After ECB's President Speech. The euro climbed to a 2-1/2-year high on Monday after the ECB President Mario Draghi held back from talking down the currency and as markets worried about the impact of Tropical Storm Harvey on the U.S. economy. The euro reached $1.1966, its highest since January 2015.
Gold Rises To 1-Week High. Gold price advanced on Monday to its key resistance levels at US$1,295, extending gains from the previous session, after Federal Reserve Chair Janet Yellen skipped any mention of monetary policy in a speech at a central bankers meeting in Jackson Hole.
Hurricane Harvey Drives Oil Up. Oil prices rose as the dollar fell and as the U.S. petroleum industry braced for Hurricane Harvey, which could become the biggest storm to hit the U.S. mainland in more than a decade.